
System for performing an analysis of pressure-signals derivable from pressure measurements on or in a body

a pressure measurement and analysis system technology, applied in the field of systems for performing pressuresignal analysis, can solve the problems of inability to take single wave parameters into daily clinical practice, inability to explore trends in single wave characteristics, and inability to continuously examine compliance solely on the basis of pressure curves. to achieve the effect of reducing pressur

Inactive Publication Date: 2008-02-26
SENSOMETRICS AS (NO)
View PDF14 Cites 74 Cited by
  • Summary
  • Abstract
  • Description
  • Claims
  • Application Information

AI Technical Summary

Benefits of technology

"The invention is a method for analyzing pressures in the brain and other body cavities by measuring and recording pressure waves. The method quantifies the pressure curve by calculating the number of pressure elevations and their duration, and presents the data in a variety of ways to show important information about the pressures. The method can be used for a variety of pressures and offers different types of data presentations. The technical effect of the invention is to provide a more accurate and reliable way of analyzing intracranial pressure and to show important information about the pressures that was previously not possible."

Problems solved by technology

It has, however, not been possible to take the knowledge of single wave parameters into daily clinical practice.
Though single waves may be displayed on the monitor, strategies to explore trends in changes of single wave characteristics are lacking.
Furthermore, strategies to continuously examine compliance solely on the basis of the pressure curves have not been established.

Method used


Image

  • System for performing an analysis of pressure-signals derivable from pressure measurements on or in a body
  • System for performing an analysis of pressure-signals derivable from pressure measurements on or in a body
  • System for performing an analysis of pressure-signals derivable from pressure measurements on or in a body

Examples


example 1

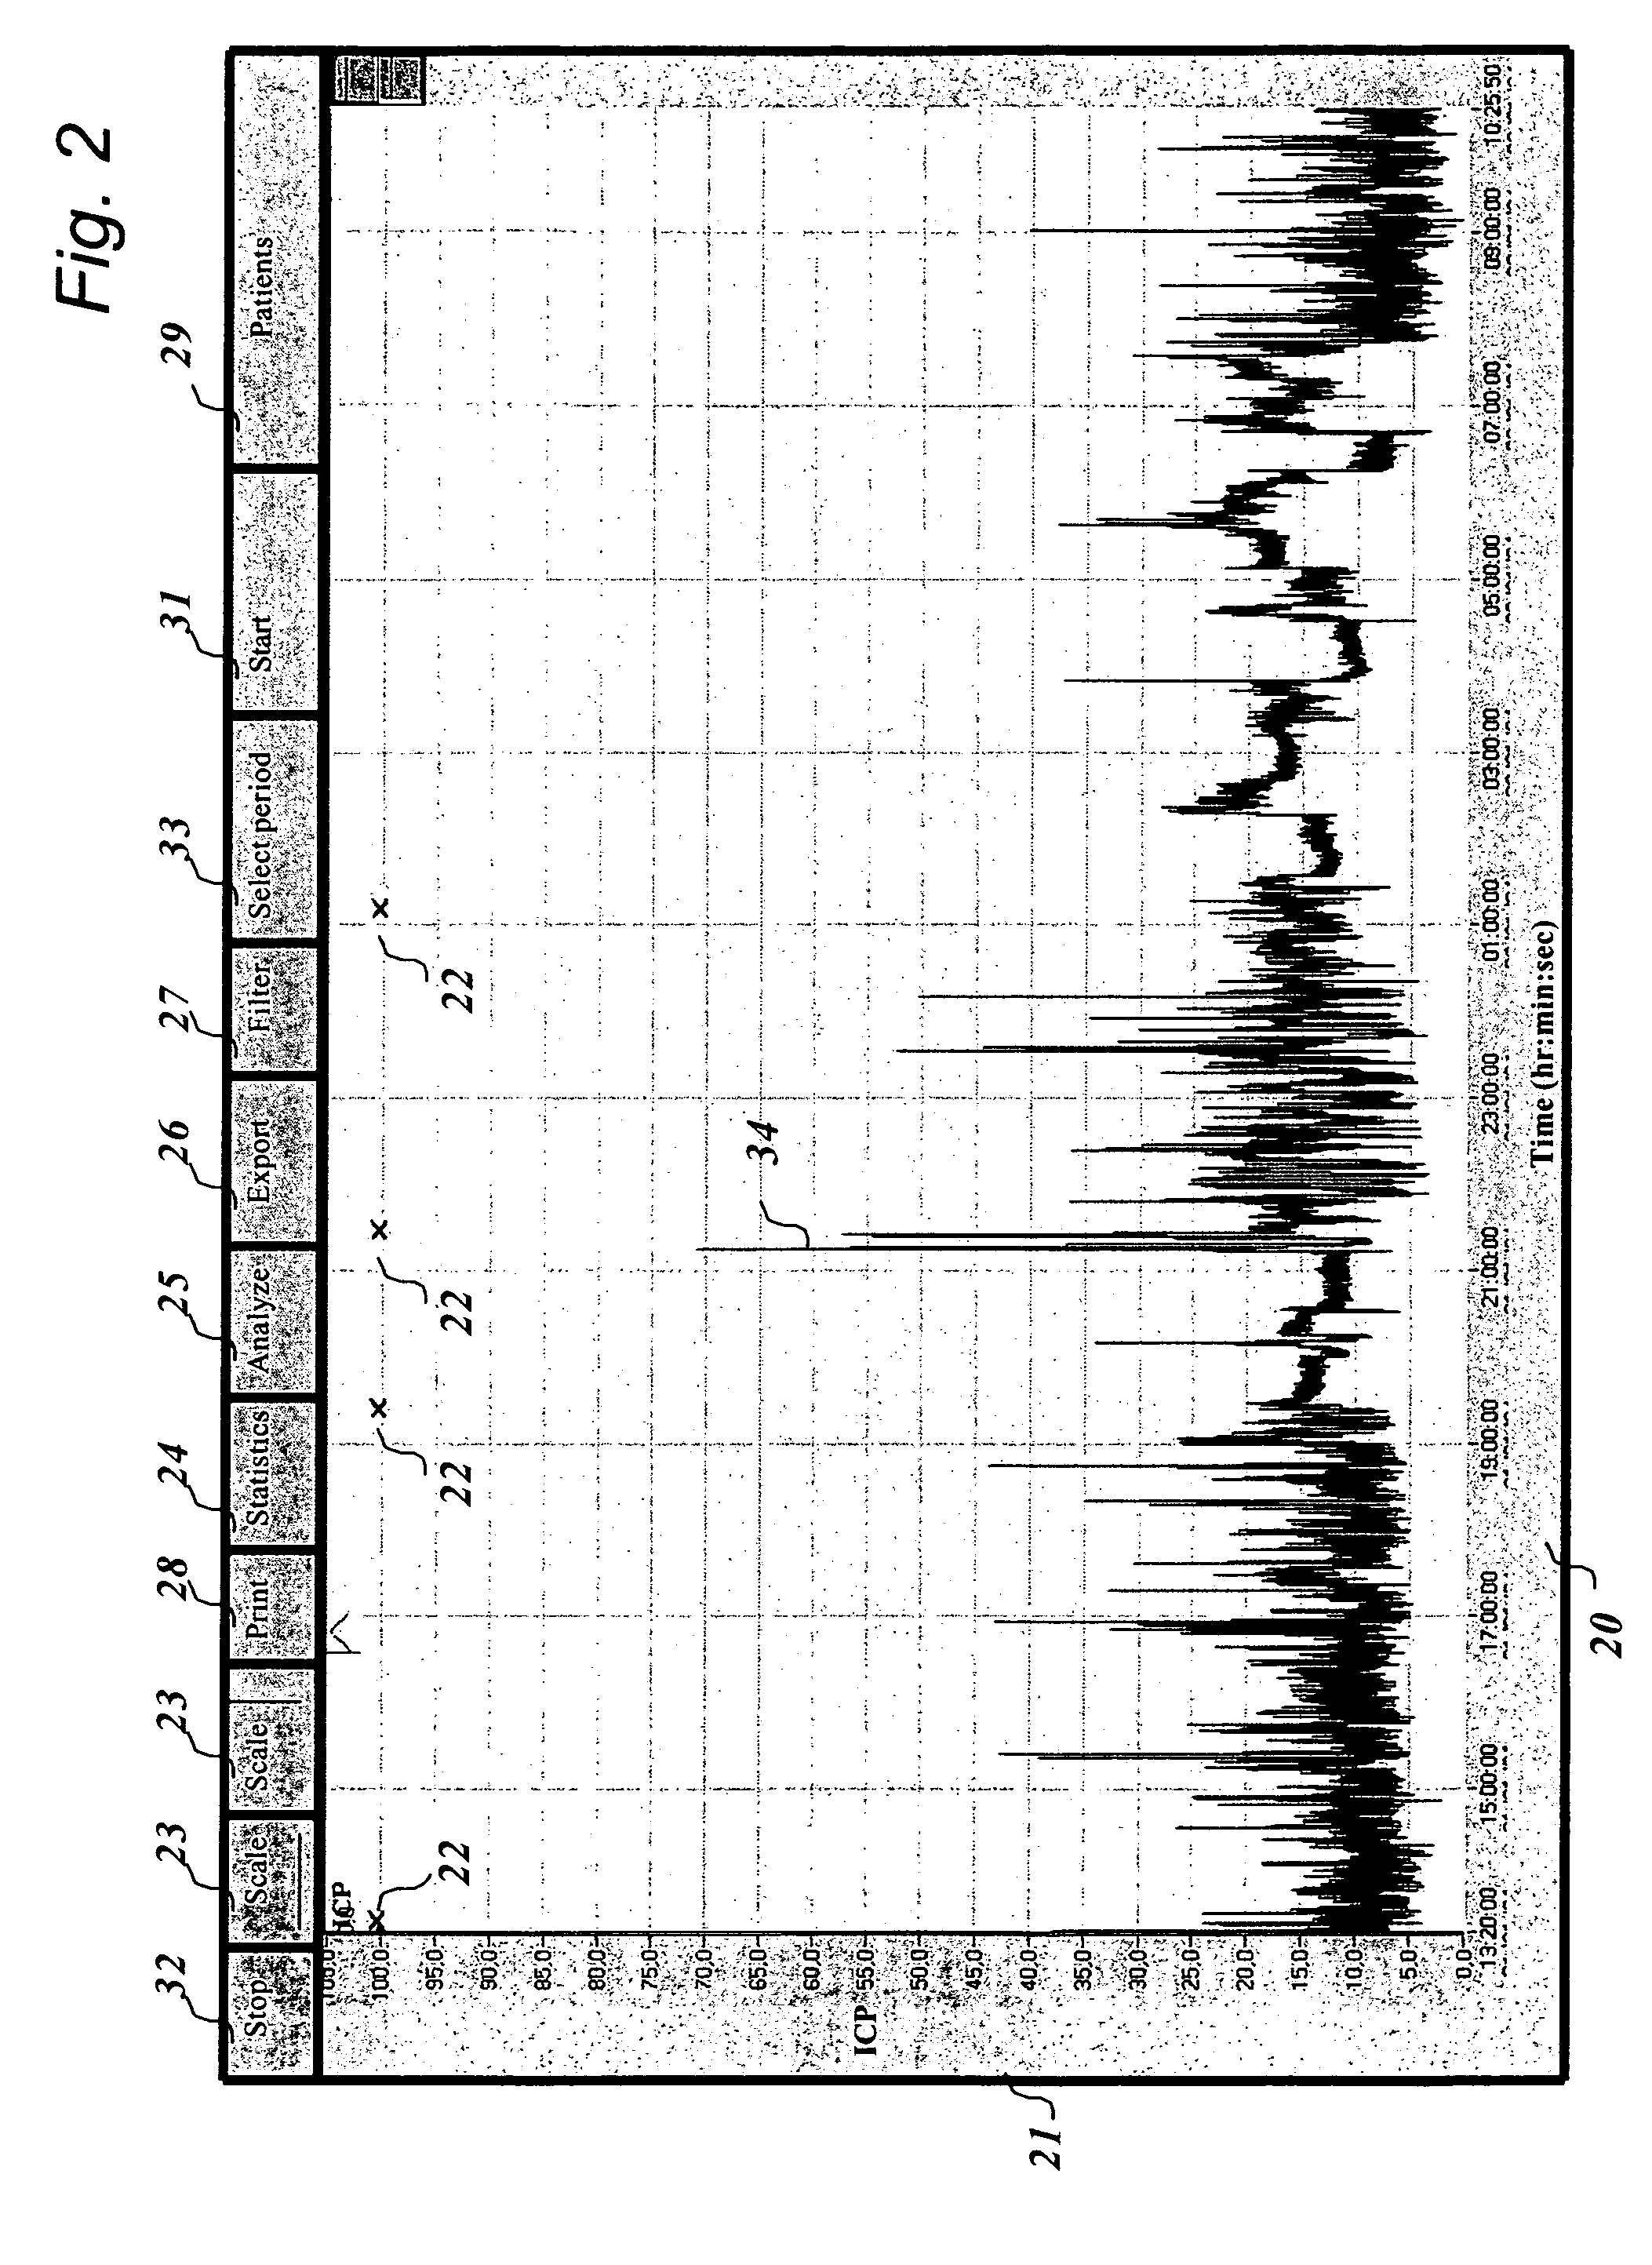
[0117]Continuous intracranial pressure monitoring was performed in a girl aged 2 years and 11 months because of suspected shunt failure. In this girl an extracranial shunt was previously placed because of hydrocephalus. Shunt failure was suspected because of headache, lethargy and irritability. In fact, increased, reduced or normal intracranial pressures may cause these symptoms. The results of intracranial pressure monitoring during sleep in this girl were as follows: Mean intracranial pressure 14.4 mmHg, range 0.1-67.3 mmHg, std 5.7 mmHg. The duration of intracranial pressure monitoring was 544 minutes. A mean pressure of 14.4 mmHg is by most physicians considered as borderline whereas a pressure above 15 mmHg is considered as abnormal. Therefore, no indication for surgery (shunt revision) was found on the basis of the intracranial pressure monitoring. The girl was not treated which resulted in lasting symptoms of headache and lethargy for more than 2 years. A retrospective analys...

example 2

[0120]Continuous intracranial pressure monitoring was performed in a 3 years and 10 months old boy due to suspected premature closure of the cranial sutures. The boy had symptoms of increased intracranial pressure. During sleep the data of the intracranial pressure curve were as follows: Mean intracranial pressure 15.4 mmHg, range 0-57.1 mmHg, std 6.0 mmHg, and time of pressure recording 480 min (8.0 hrs). On the basis of the results of intracranial pressure monitoring, surgery was performed. A cranial expansion procedure that is a rather major procedure was performed to increase the cranial volume and thereby reduce intracranial pressure. However, after surgery the patient still had symptoms of intracranial hypertension. Therefore it was decided to repeat the intracranial pressure monitoring, that was undertaken six months after surgery. The data for this monitoring during sleep were as follows: Mean intracranial pressure 15.2 mmHg, range 5.5-39.4 mmHg, std 3.9 mmHg, and time of in...


PUM


Abstract

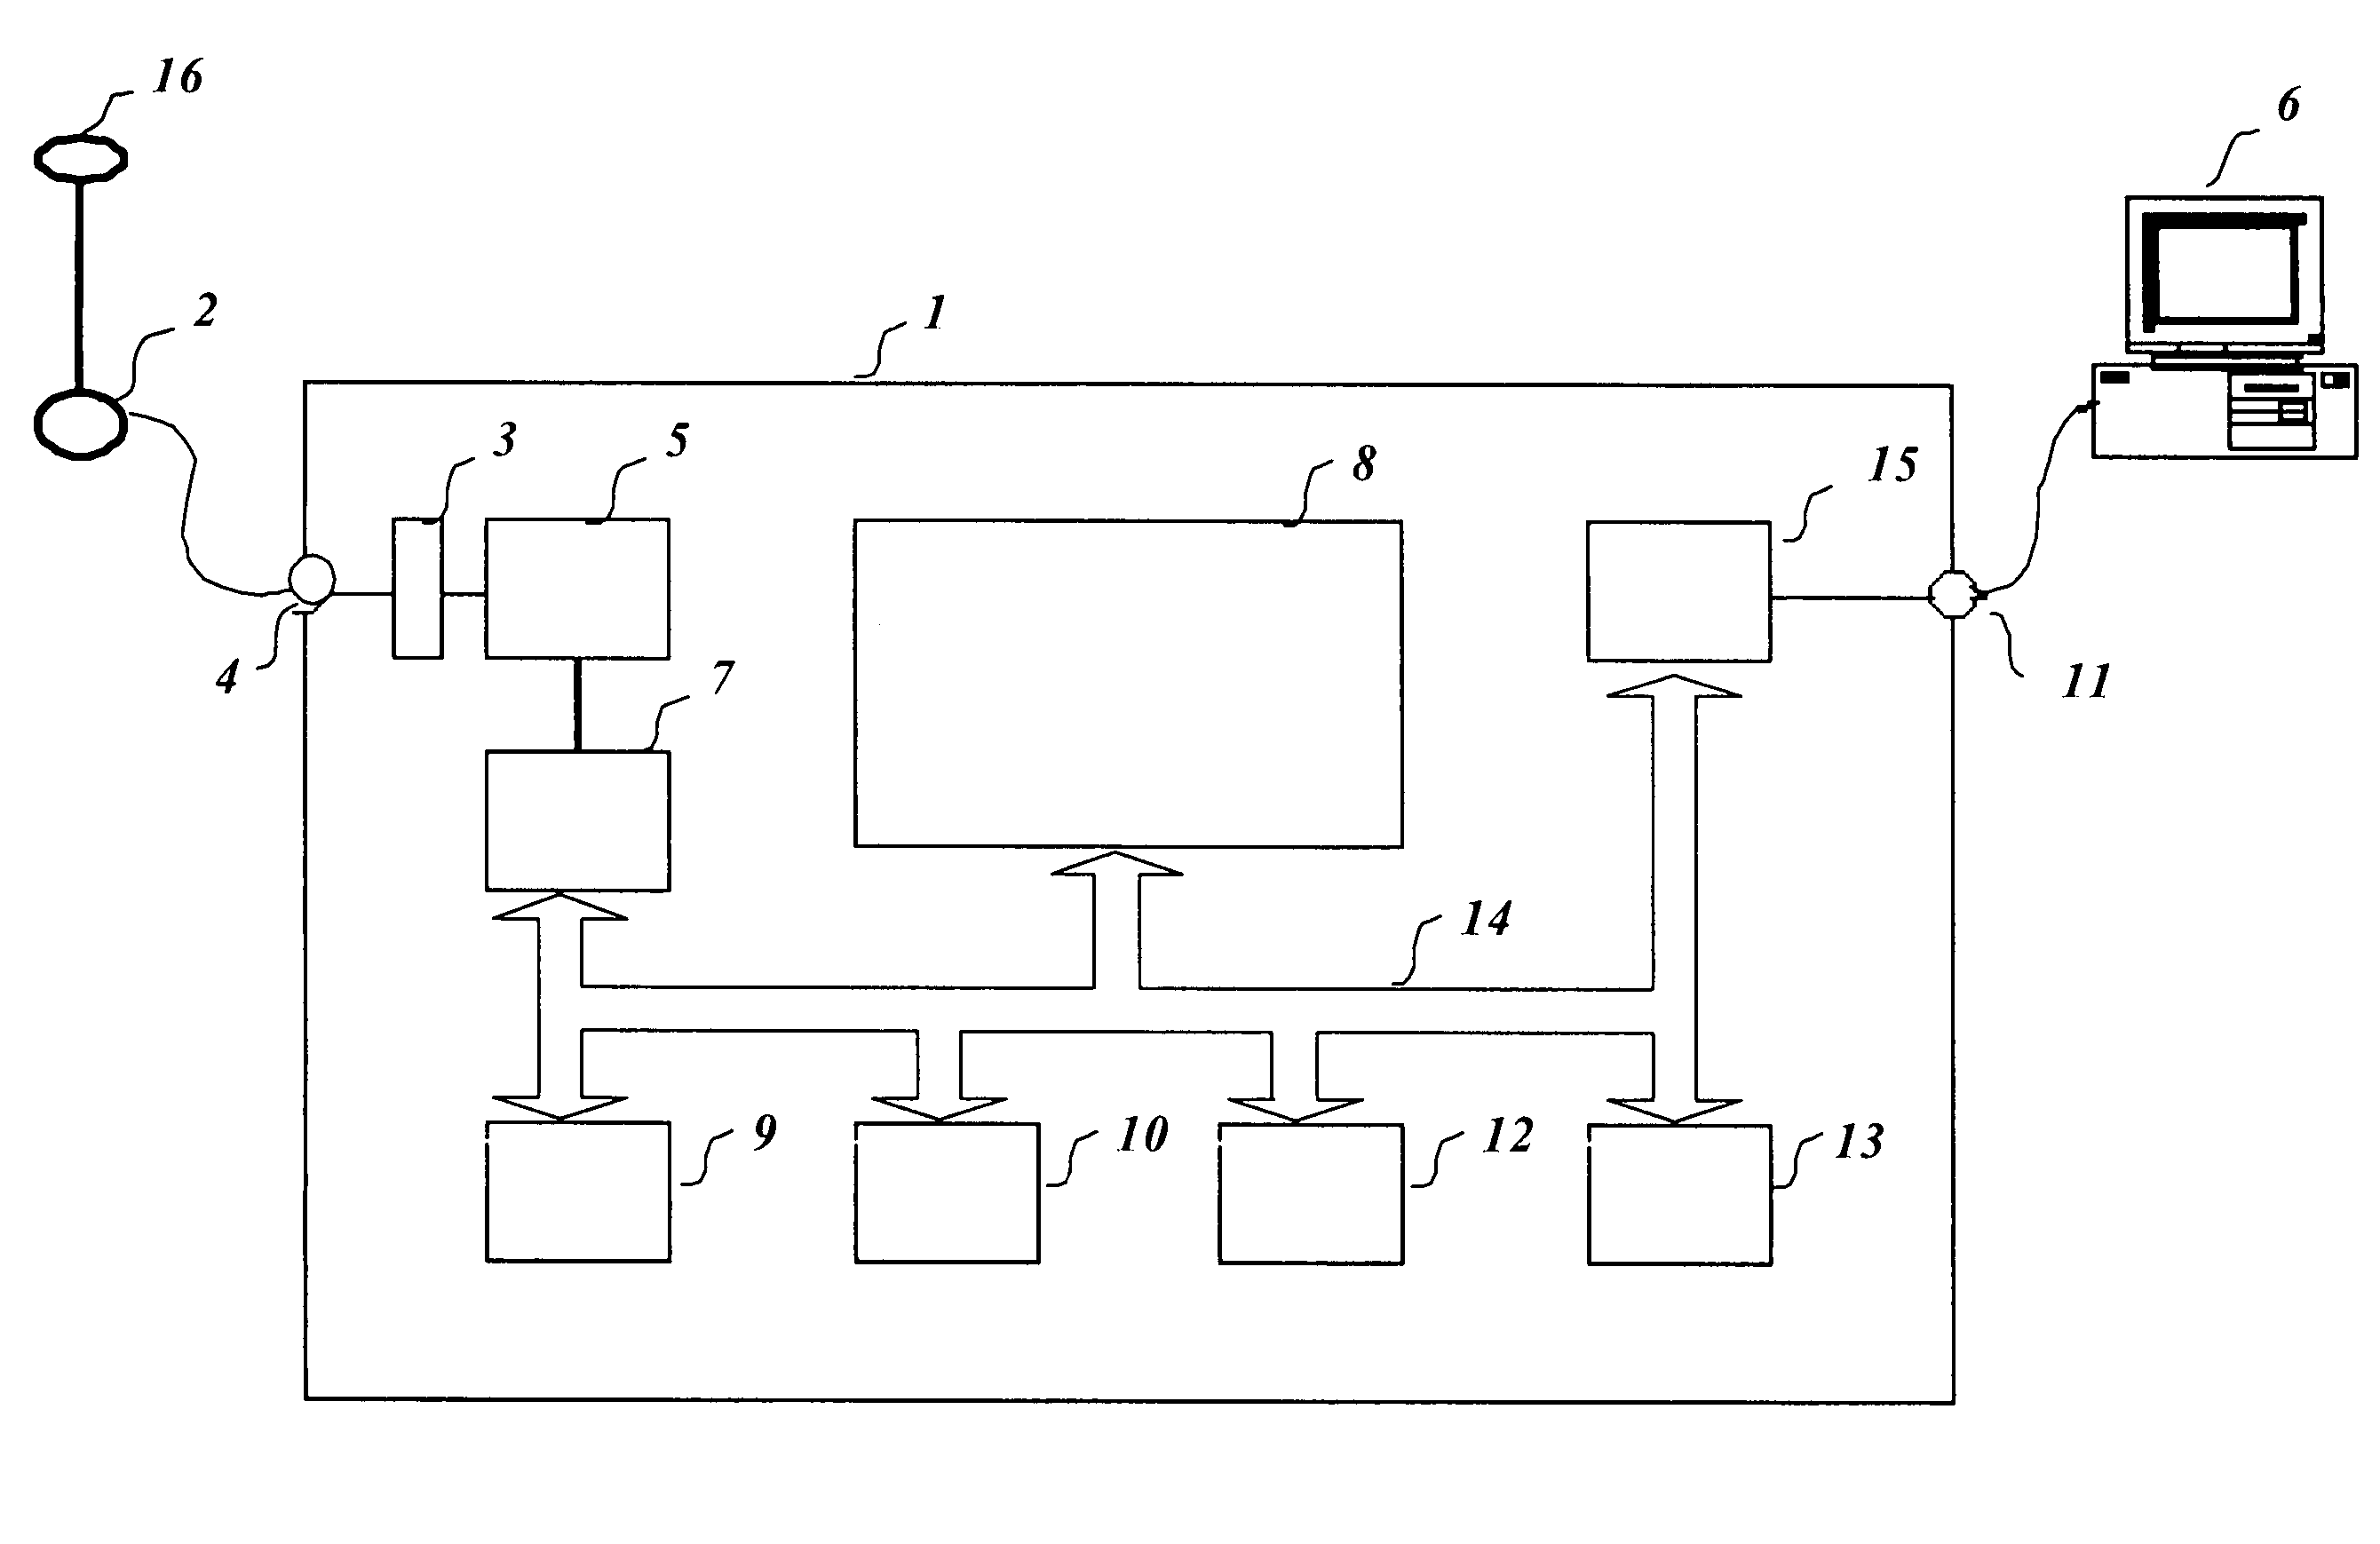
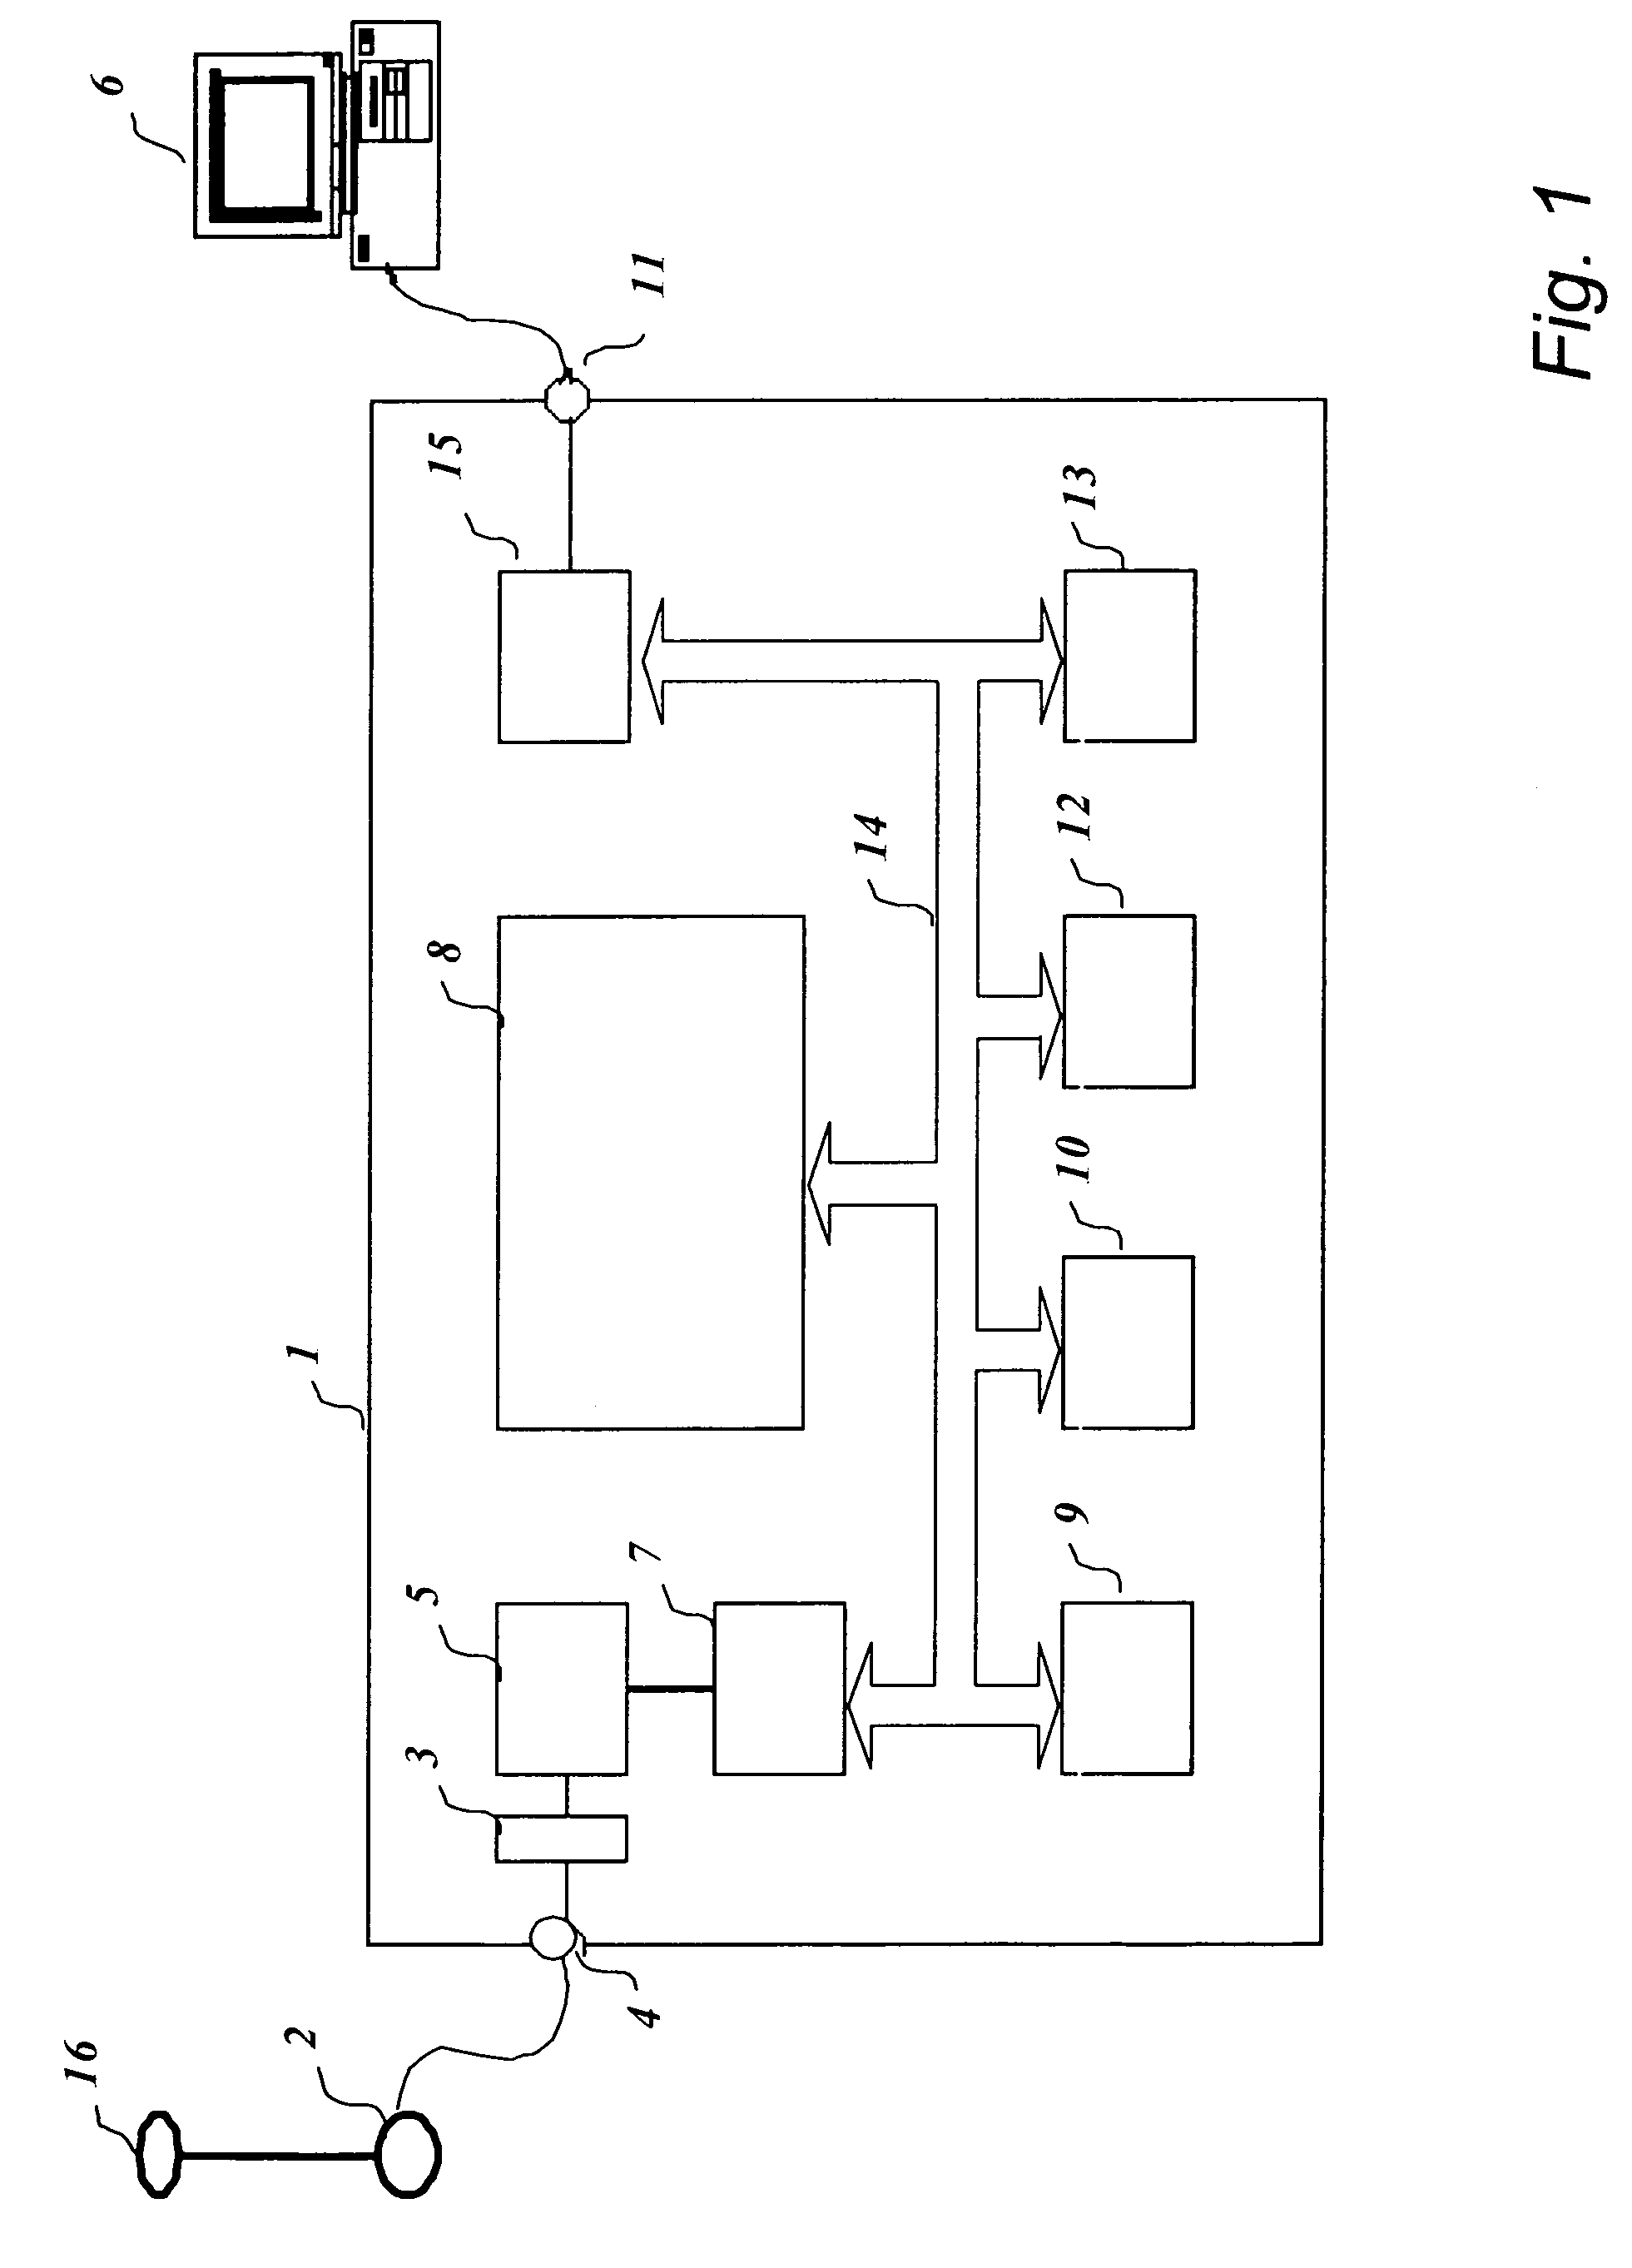
A system for performing an analysis of pressure-signals derivable from pressure measurements on or in a body of a human being or animal, includes a communication interface for receiving a set of digital pressure sample values, a memory for storing these values, and a processor capable of performing the analysis, the processor having means to identify features related to single pressure waves in the pressure signals based on input of the digital data into the processor, and the processor further having determination means which based on the features is configured to a) determine a minimum pressure value related to diastolic minimum value and a maximum pressure value related to systolic maximum value, b) determine at least one parameter of the single wave parameters elected from the group of: pressure amplitude=ΔP=[(maximum pressure value)−(minimum pressure value)], latency (ΔT), rise time or rise time coefficient=ΔP / ΔT, and wavelength of the single wave, c) determine number of the single pressure waves occurring during a given time sequence, including determination of the number of single pressure waves with pre-selected values of one or more of the single pressure wave parameters during the given time sequence, and d) determine number of single pressure waves with pre-selected combinations of two or more of the single pressure wave parameters during the given time sequence. Further, the system has a display for visual presentation of the result of analysis performed by the processor.

Description

[0001]This application is a Divisional of application Ser. No. 10 / 283,245, filed on Oct. 30, 2002 now U.S. Pat. No. 7,198,602, which is a Continuation-in-Part of U.S. application Ser. No. 09 / 843,702, filed on Apr. 30, 2001 now abandoned, the entire contents of each of which are hereby incorporated by reference and for which priority is claimed under 35 U.S.C. § 120. This nonprovisional application also claims priority under 35 U.S.C. § 119(a) on International Application PCT / N002 / 00164 filed on Apr. 29, 2002 under the Patent Cooperation Treaty, the entire contents of which are hereby incorporated by reference.BACKGROUND OF THE INVENTION[0002]1. Field of the Invention[0003]The present invention relates to a system for performing an analysis of pressure-signals derivable from pressure measurements on or in a body of a human being or animal, as defined in the preamble of attached claim 1. The invention provides for monitoring and analyzing of pressure within body cavities in a human bo...

Claims


Application Information

Patent Timeline
Patent Type & Authority Patents(United States)
IPC IPC(8): A61B5/02A61B5/00A61B5/0215A61B5/0245A61B5/03
CPCA61B5/021A61B5/03A61B5/031G06F19/3487A61B5/02108G16H15/00
Inventor EIDE, PER KRISTIAN
Owner SENSOMETRICS AS (NO)
Learn More