Electrochemical method for producing ferrate(VI) compounds
a technology of electric chemistry and ferrate, which is applied in the direction of electrolysis process, electrolysis components, etc., can solve the problems of easy decomposition of ferric oxides, unstable samples of low purity products, and difficult production of ferra
- Summary
- Abstract
- Description
- Claims
- Application Information
AI Technical Summary
Benefits of technology
Problems solved by technology
Method used
Image
Examples
example 1
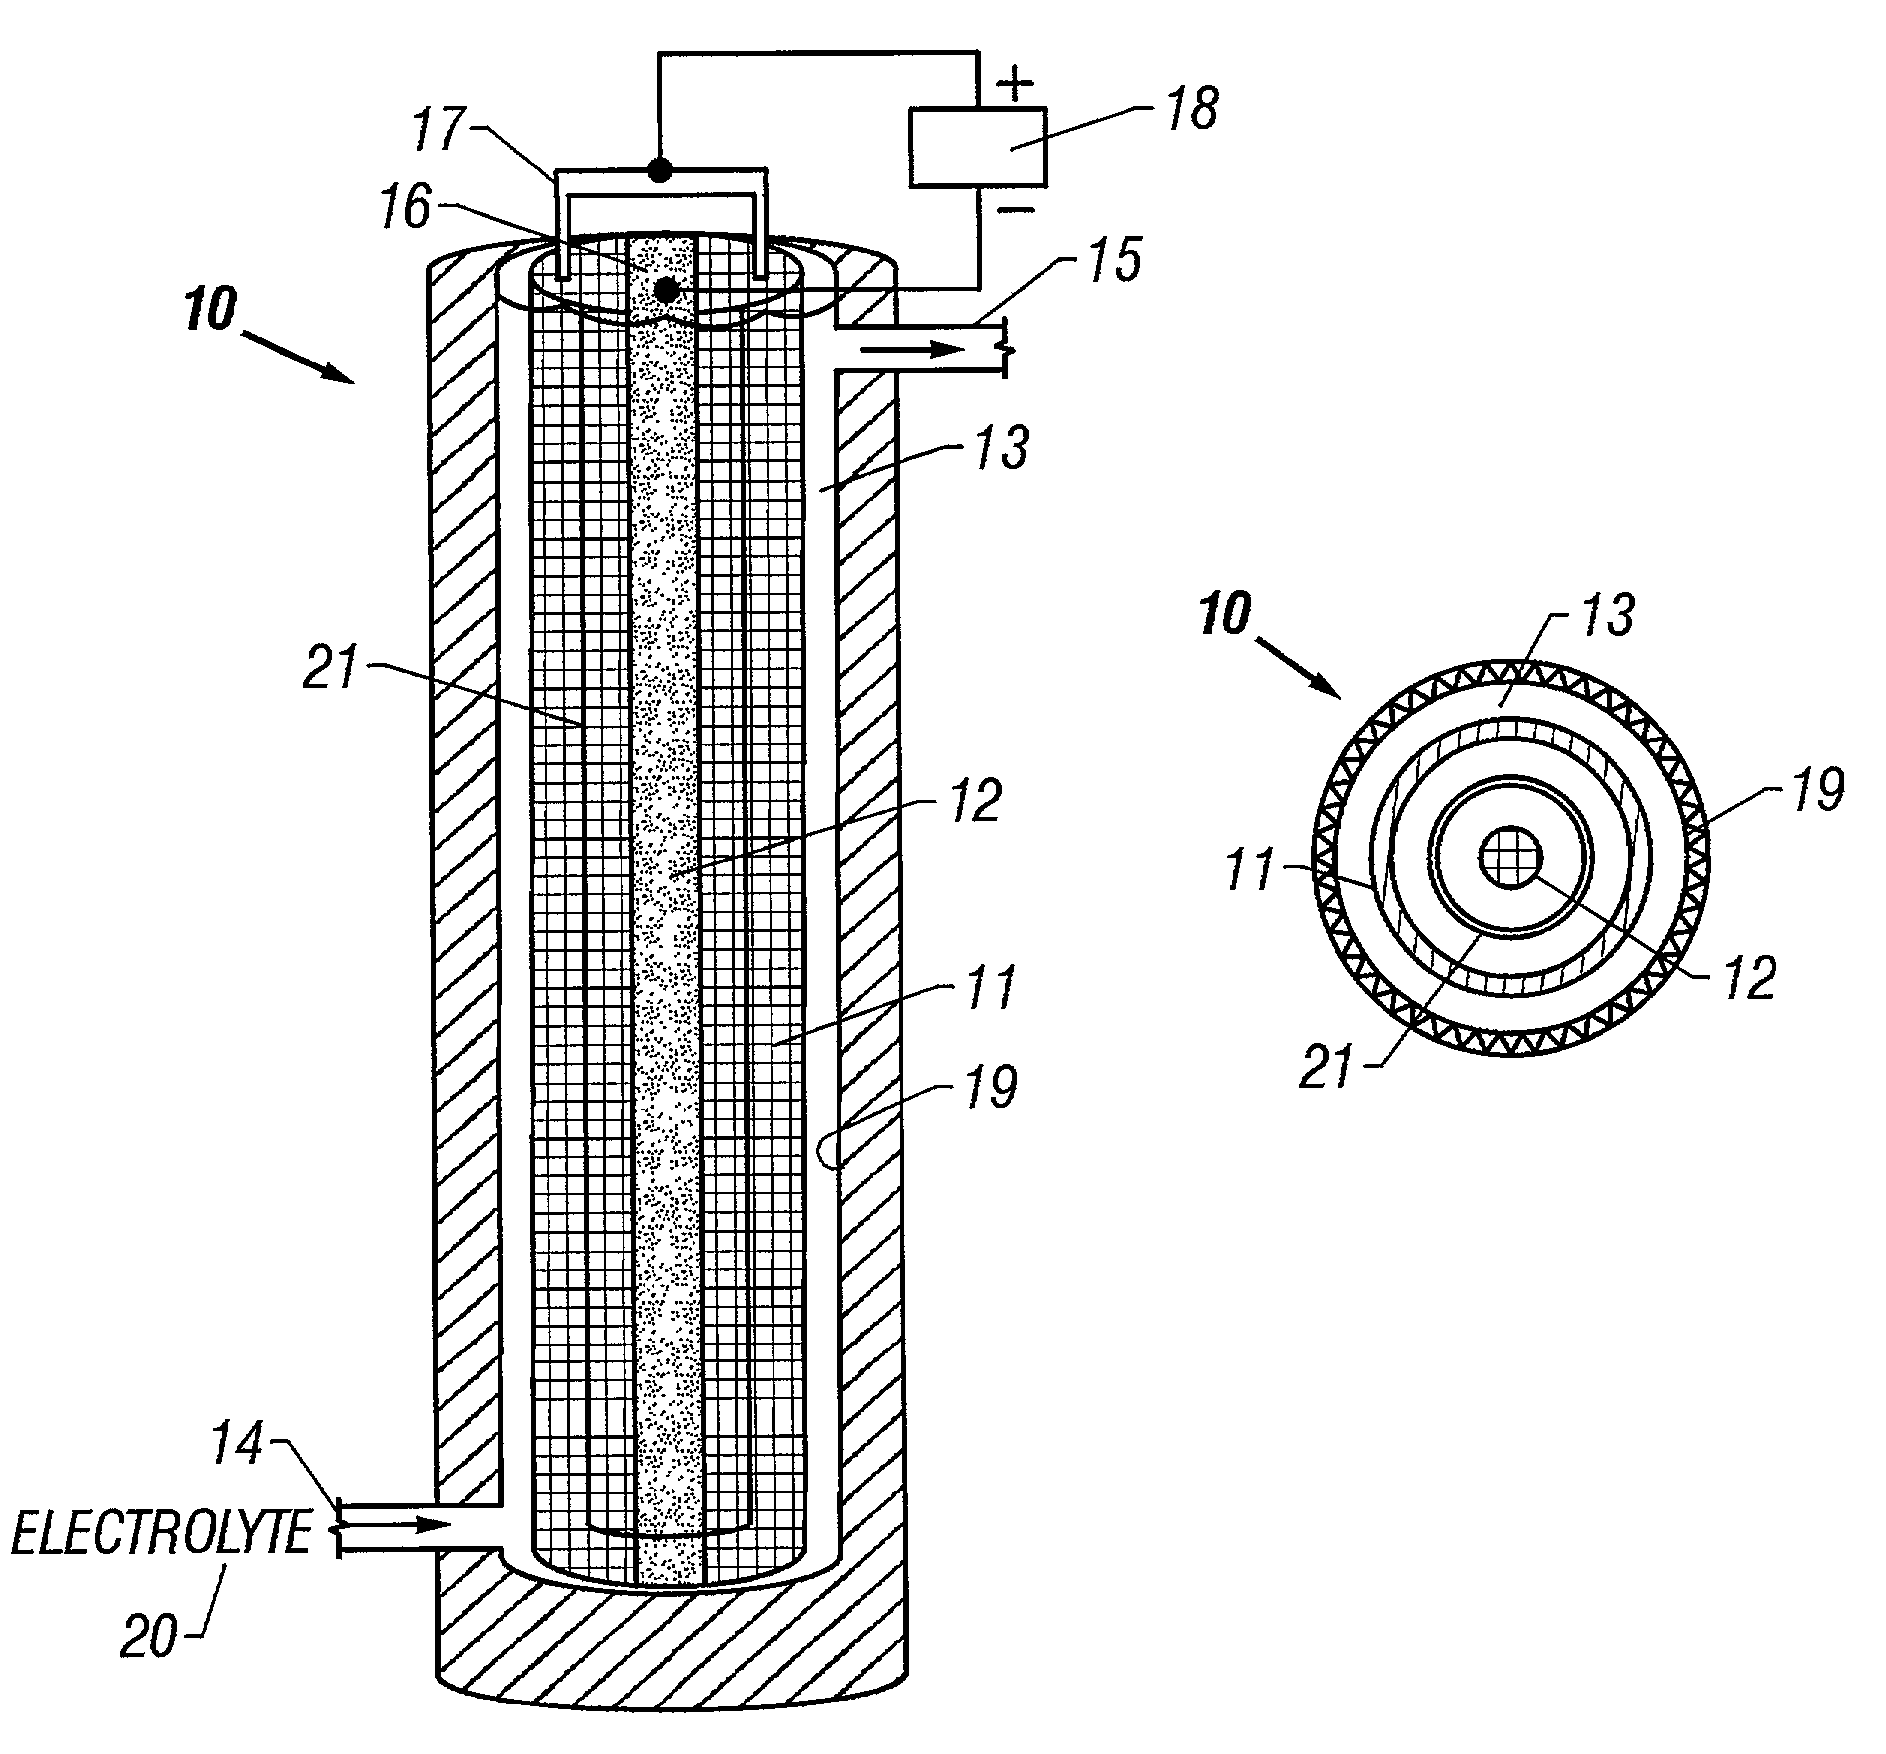
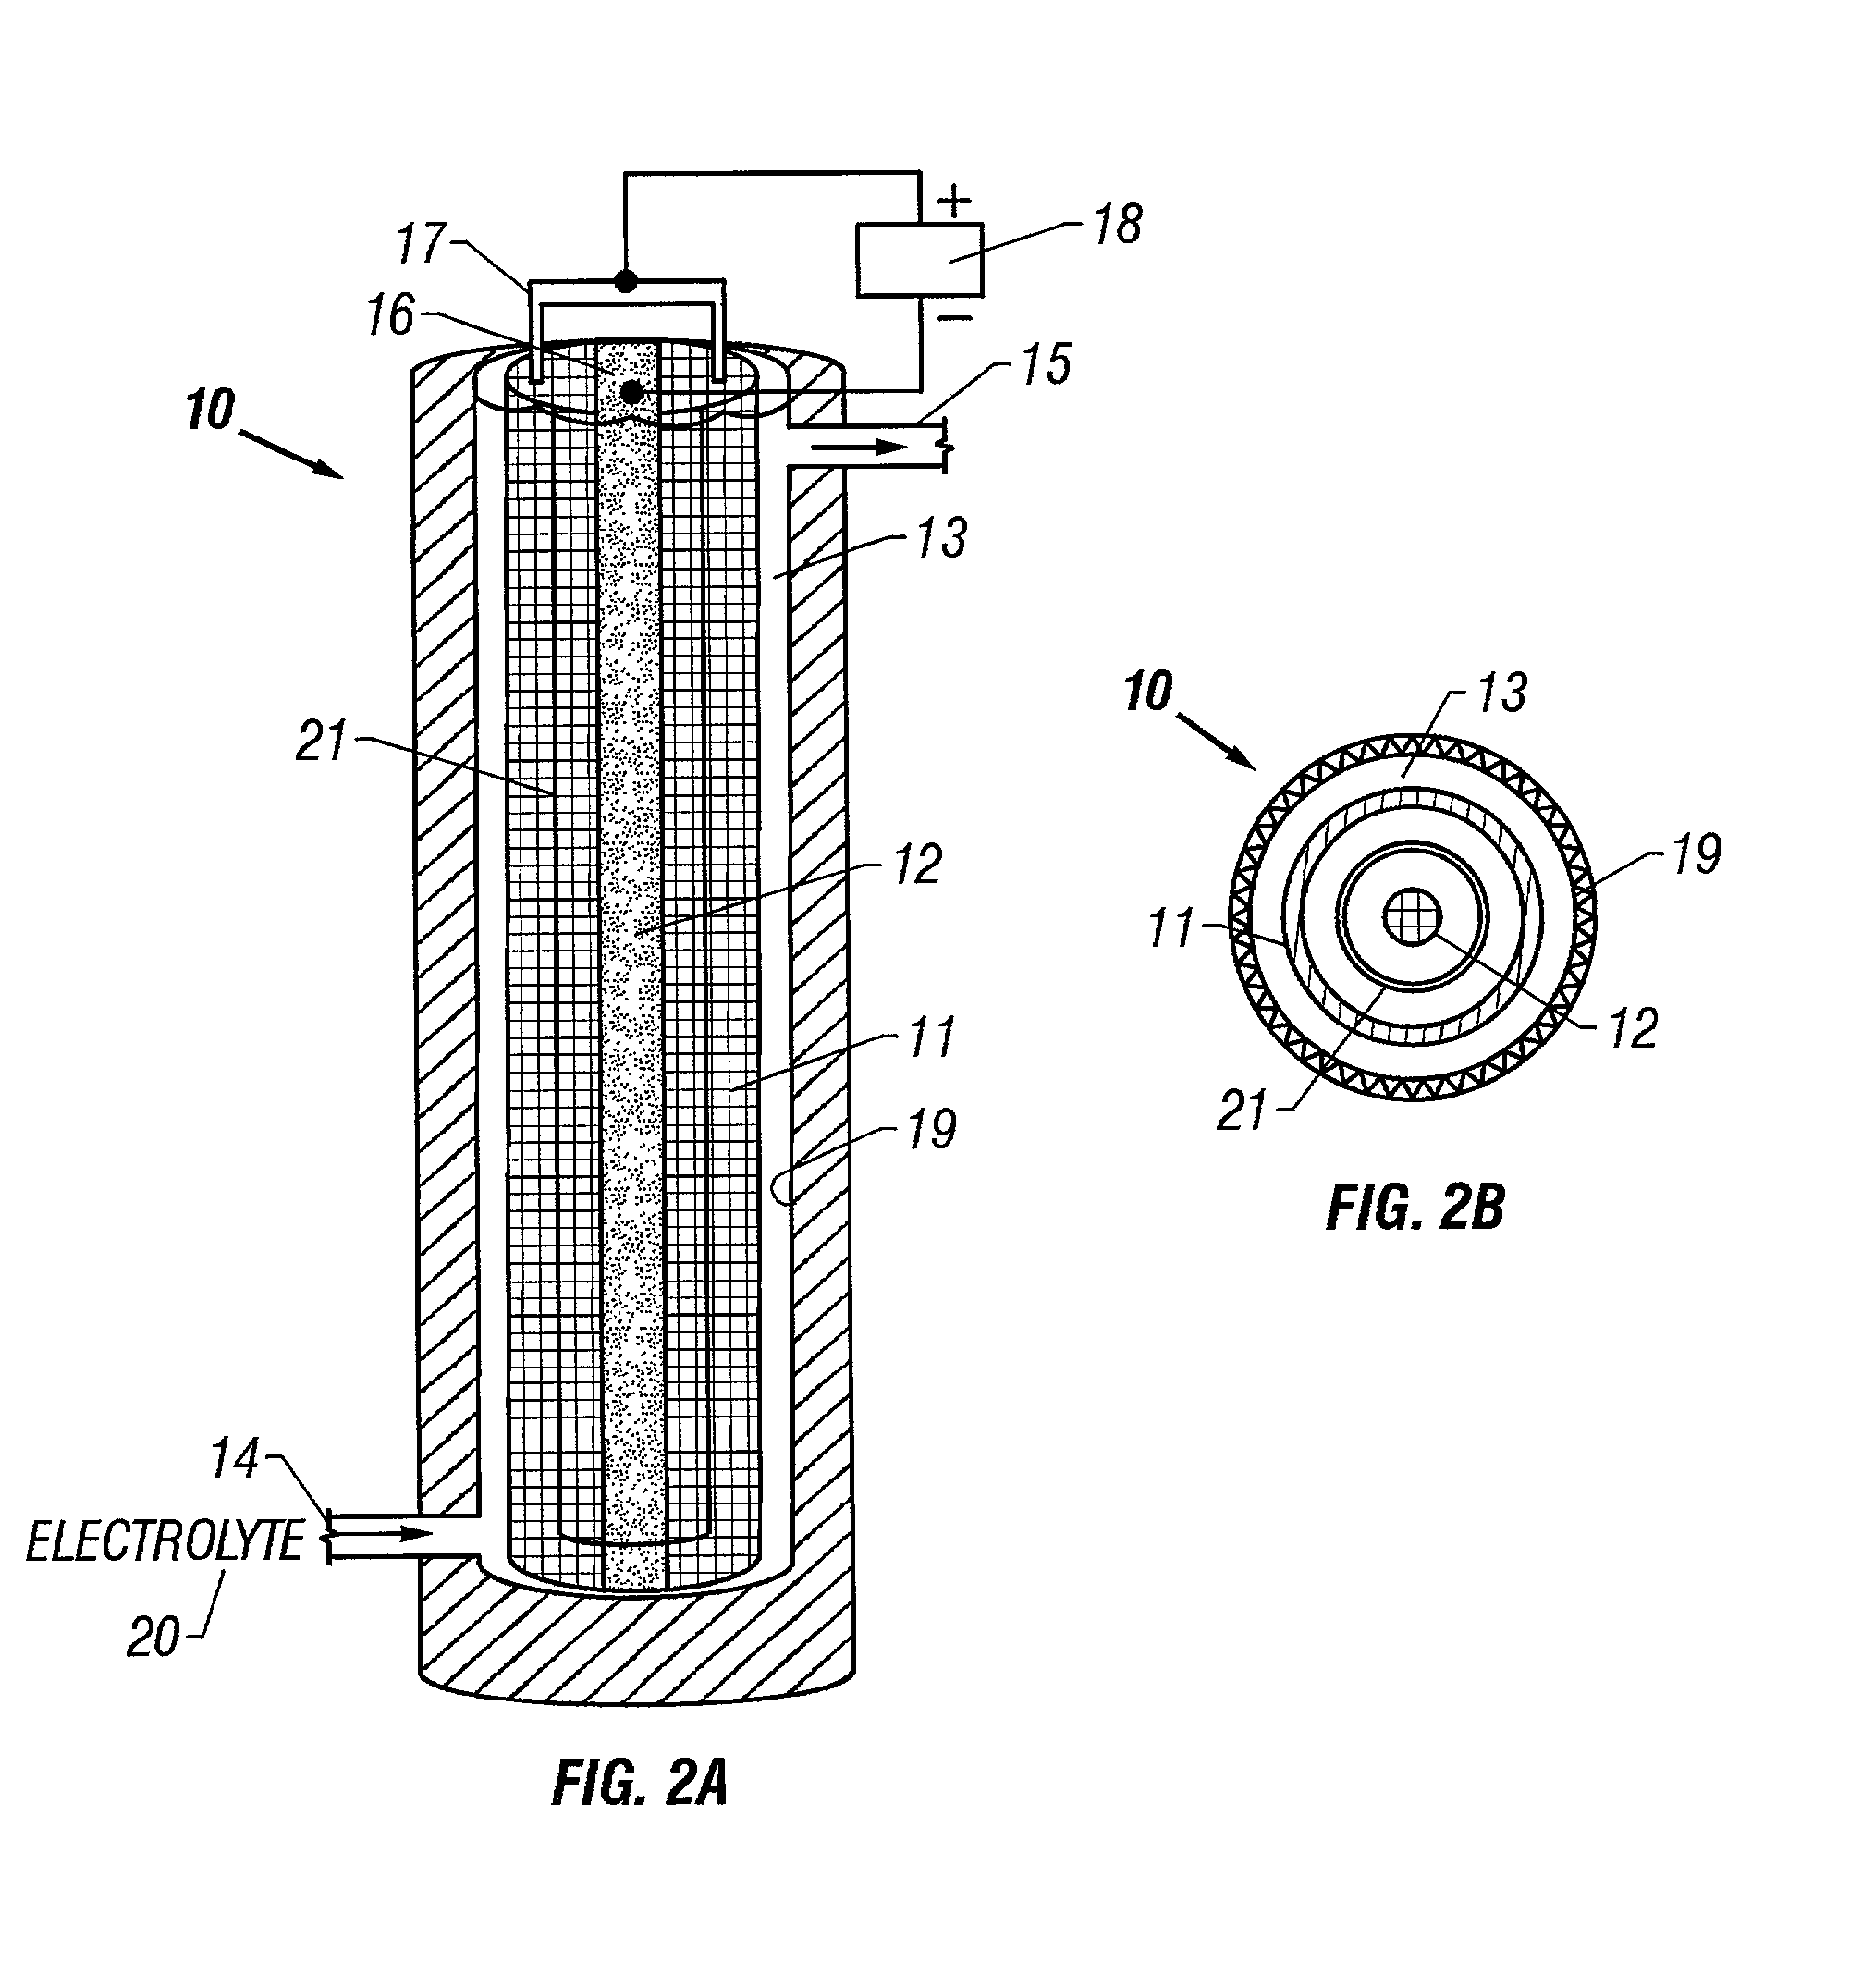
[0075]This example is of the production of ferrate (VI) using a pure NaOH electrolyte. Except where indicated, the following conditions apply to all the examples. The anode and cathode materials used in the following examples were a mesh of 1008 carbon steel (containing iron and less than 0.1% carbon, 0.5% manganese, 0.04% phosphorous, 0.05% sulfur) having a surface area of approximately 5.7 cm2 / g. The anode was a flat sheet 15 cm wide×25 cm high wrapped to form a cylindrical shell 25 cm high and 5 cm in diameter with a mass of 236 grams. The cathode consisted of a strip of mesh 25 cm high and 1.3 cm wide. One liter of an electrolyte solution was circulated for 120 minutes through a cylindrical cell, as shown in FIG. 2, having an internal volume of approximately 800 ml. A 40 amp current was applied to the cell, giving a current density at the anode of 30 mA / cm2. Ferrate concentration in solution was determined by UV / VIS spectroscopy at 505 nm (at this wavelength, the ferrate extinct...
example 2
[0077]This example is of the production of ferrate (VI) using a pure KOH electrolyte. A solution of 10 M KOH was used as electrolyte in an identical cell to that of Example 1. FIG. 6B is a graph of the ferrate concentration over time, showing that a maximum ferrate concentration of about 4 millimolar was reached after 20 minutes. After this time, the ferrate concentration leveled off and fluctuated between 3 and 4 millimolar. The average ferrate production rate was 0.03 mM / min.
example 3
[0078]This example is of the production of ferrate (VI) using various mixtures of KOH and NaOH as the electrolyte. Mixtures of KOH and NaOH at various concentrations and ratios were used as the electrolyte solutions in identical cells to that of Example 1. FIGS. 6D through 6G are graphs of the ferrate concentration over time for four different hydroxide solutions. The hydroxide solutions were: FIG. 6D, 5 M KOH / 5 M NaOH; FIG. 6E, 10 M KOH / 5 M NaOH; FIG. 6F, 15 M KOH / 5 M NaOH; FIG. 6G, 5 M KOH / 10 M NaOH. The average ferrate production rates corresponding to the hydroxide concentrations shown in each of the figures were: FIG. 6D, 0.05 mM / min.; FIG. 6E, 0.07 mM / min.; FIG. 6F, 0.19 mM / min.; FIG. 6G, 0.08 mM / min.
PUM
| Property | Measurement | Unit |
|---|---|---|
| molar ratio | aaaaa | aaaaa |
| molar ratio | aaaaa | aaaaa |
| molar ratio | aaaaa | aaaaa |
Abstract
Description
Claims
Application Information
 - R&D
- Intellectual Property
- Life Sciences
- Materials
- Tech Scout
- Unparalleled Data Quality
- Higher Quality Content
- 60% Fewer Hallucinations
Browse by: Latest US Patents, China's latest patents, Technical Efficacy Thesaurus, Application Domain, Technology Topic, Popular Technical Reports.
© 2025 PatSnap. All rights reserved.Legal|Privacy policy|Modern Slavery Act Transparency Statement|Sitemap|About US| Contact US: help@patsnap.com


