Method and apparatus for displaying production data for improved manufacturing decision making

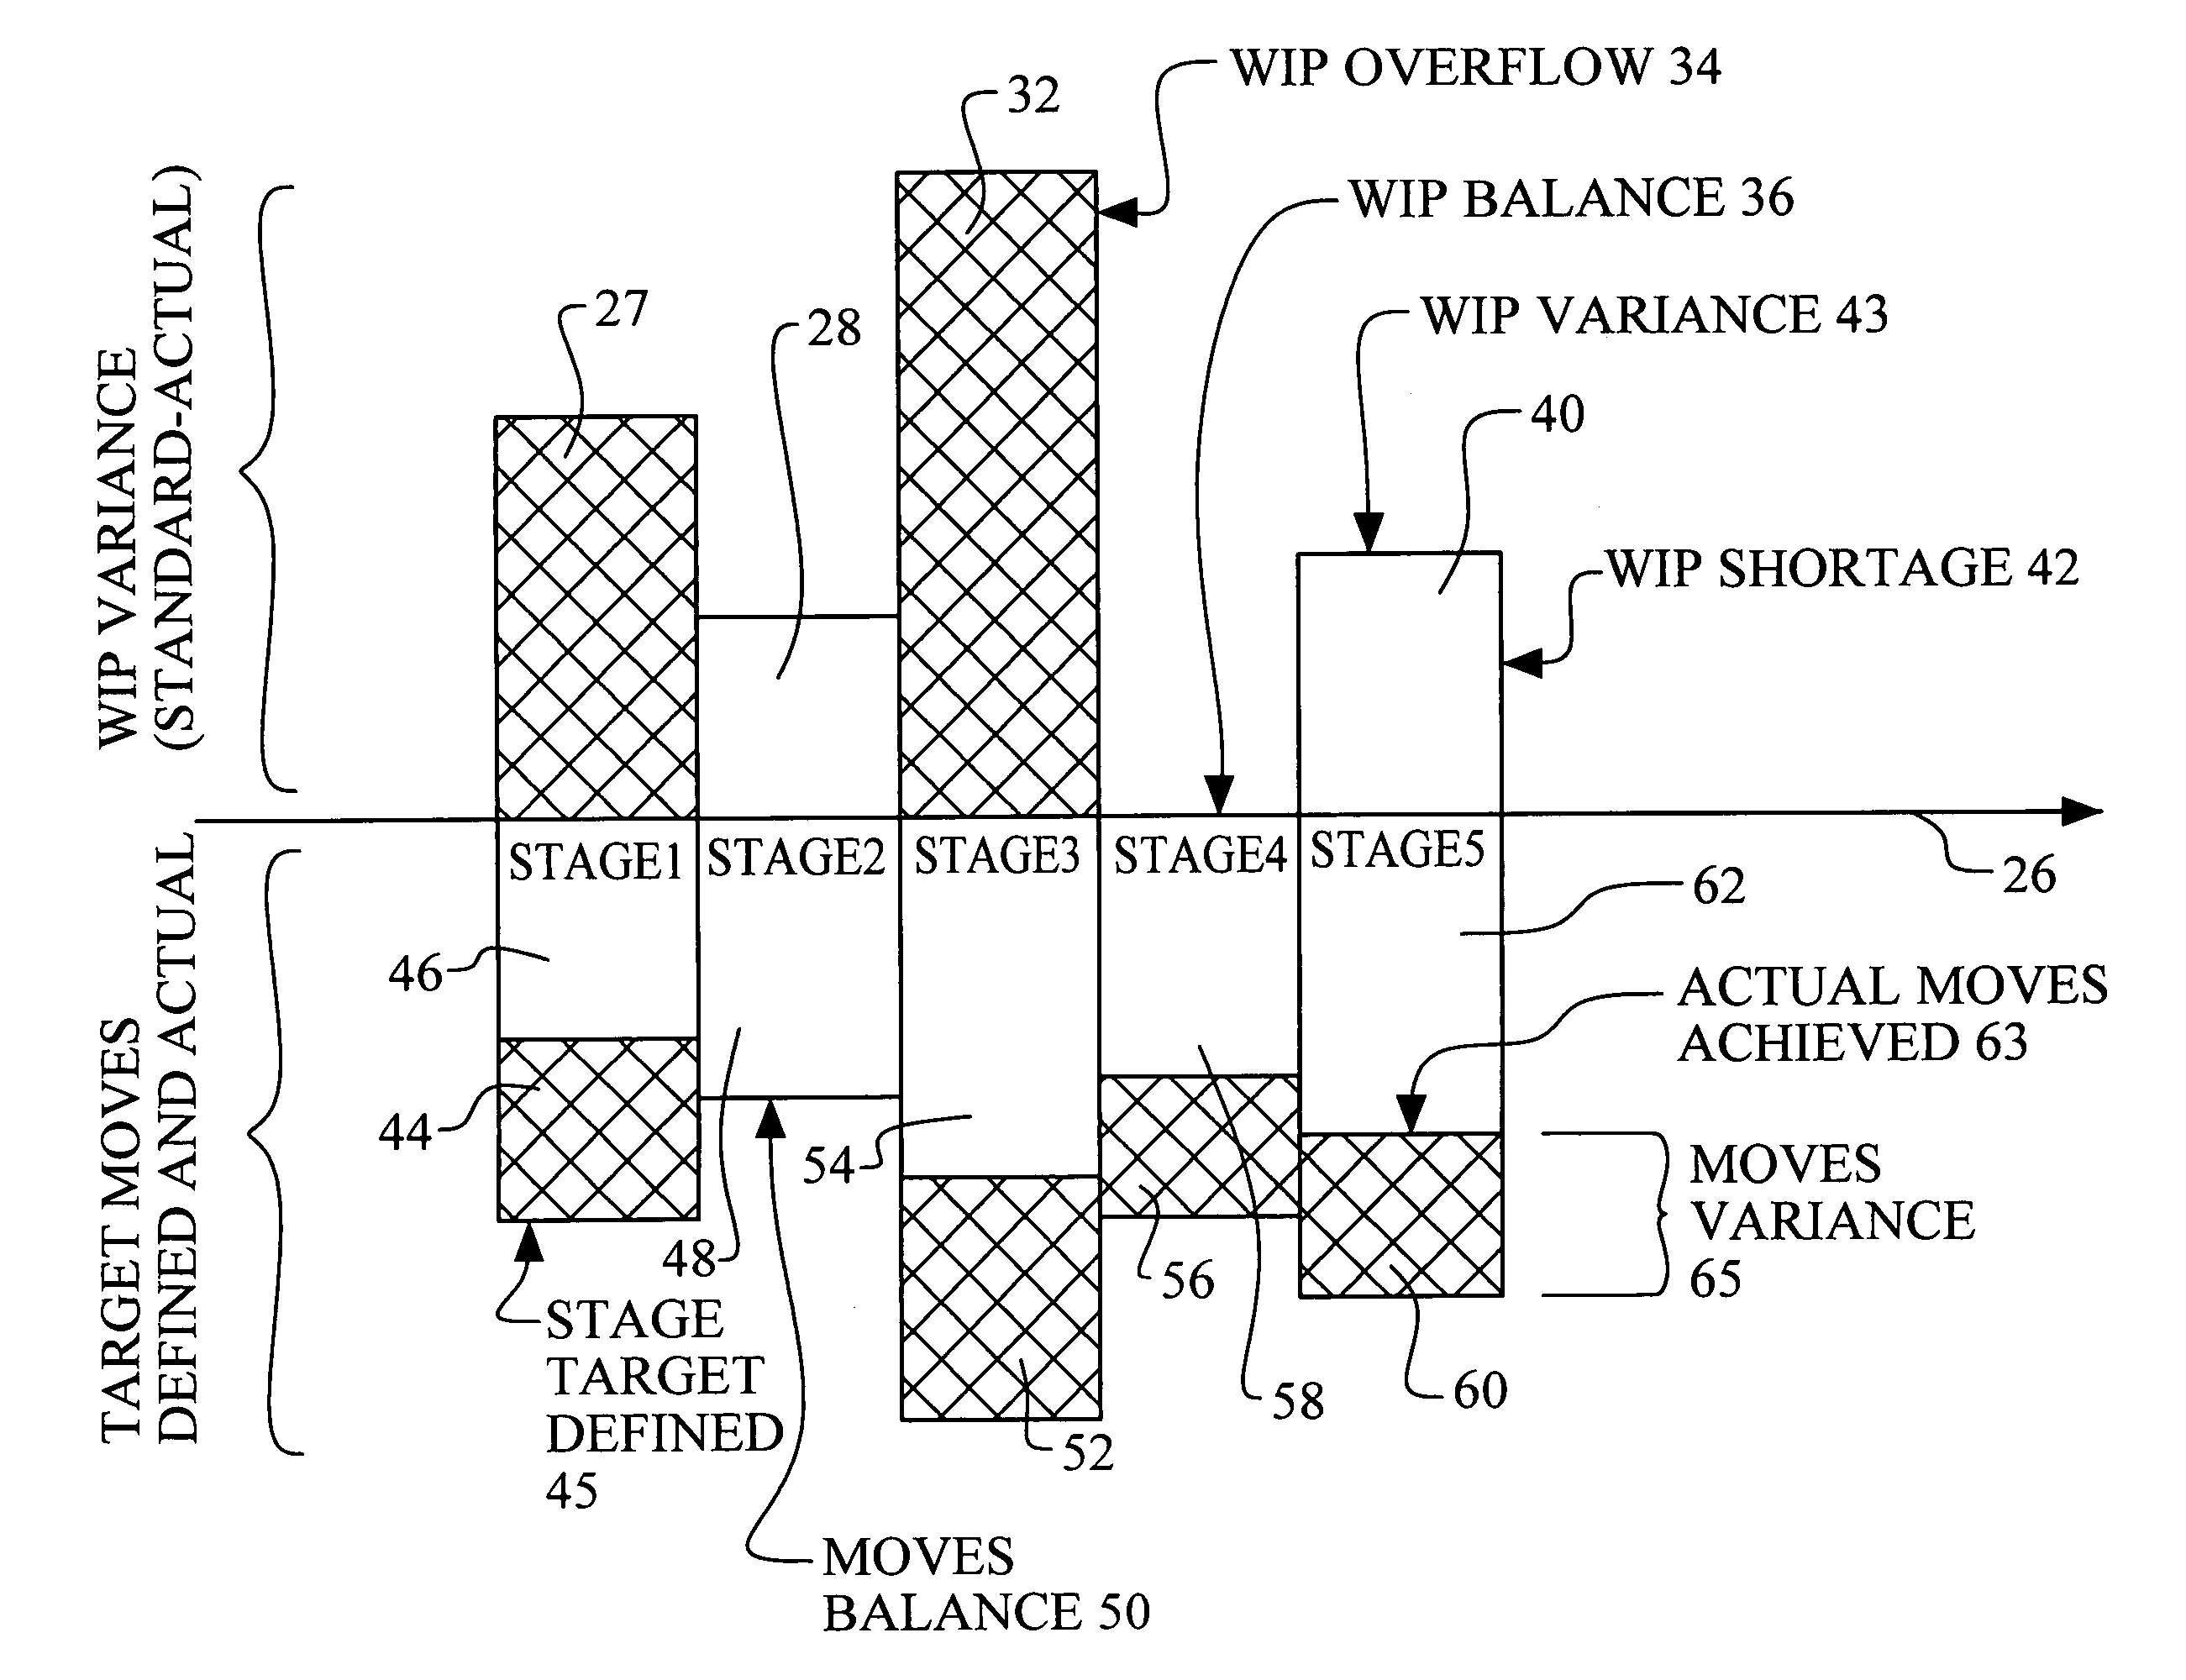
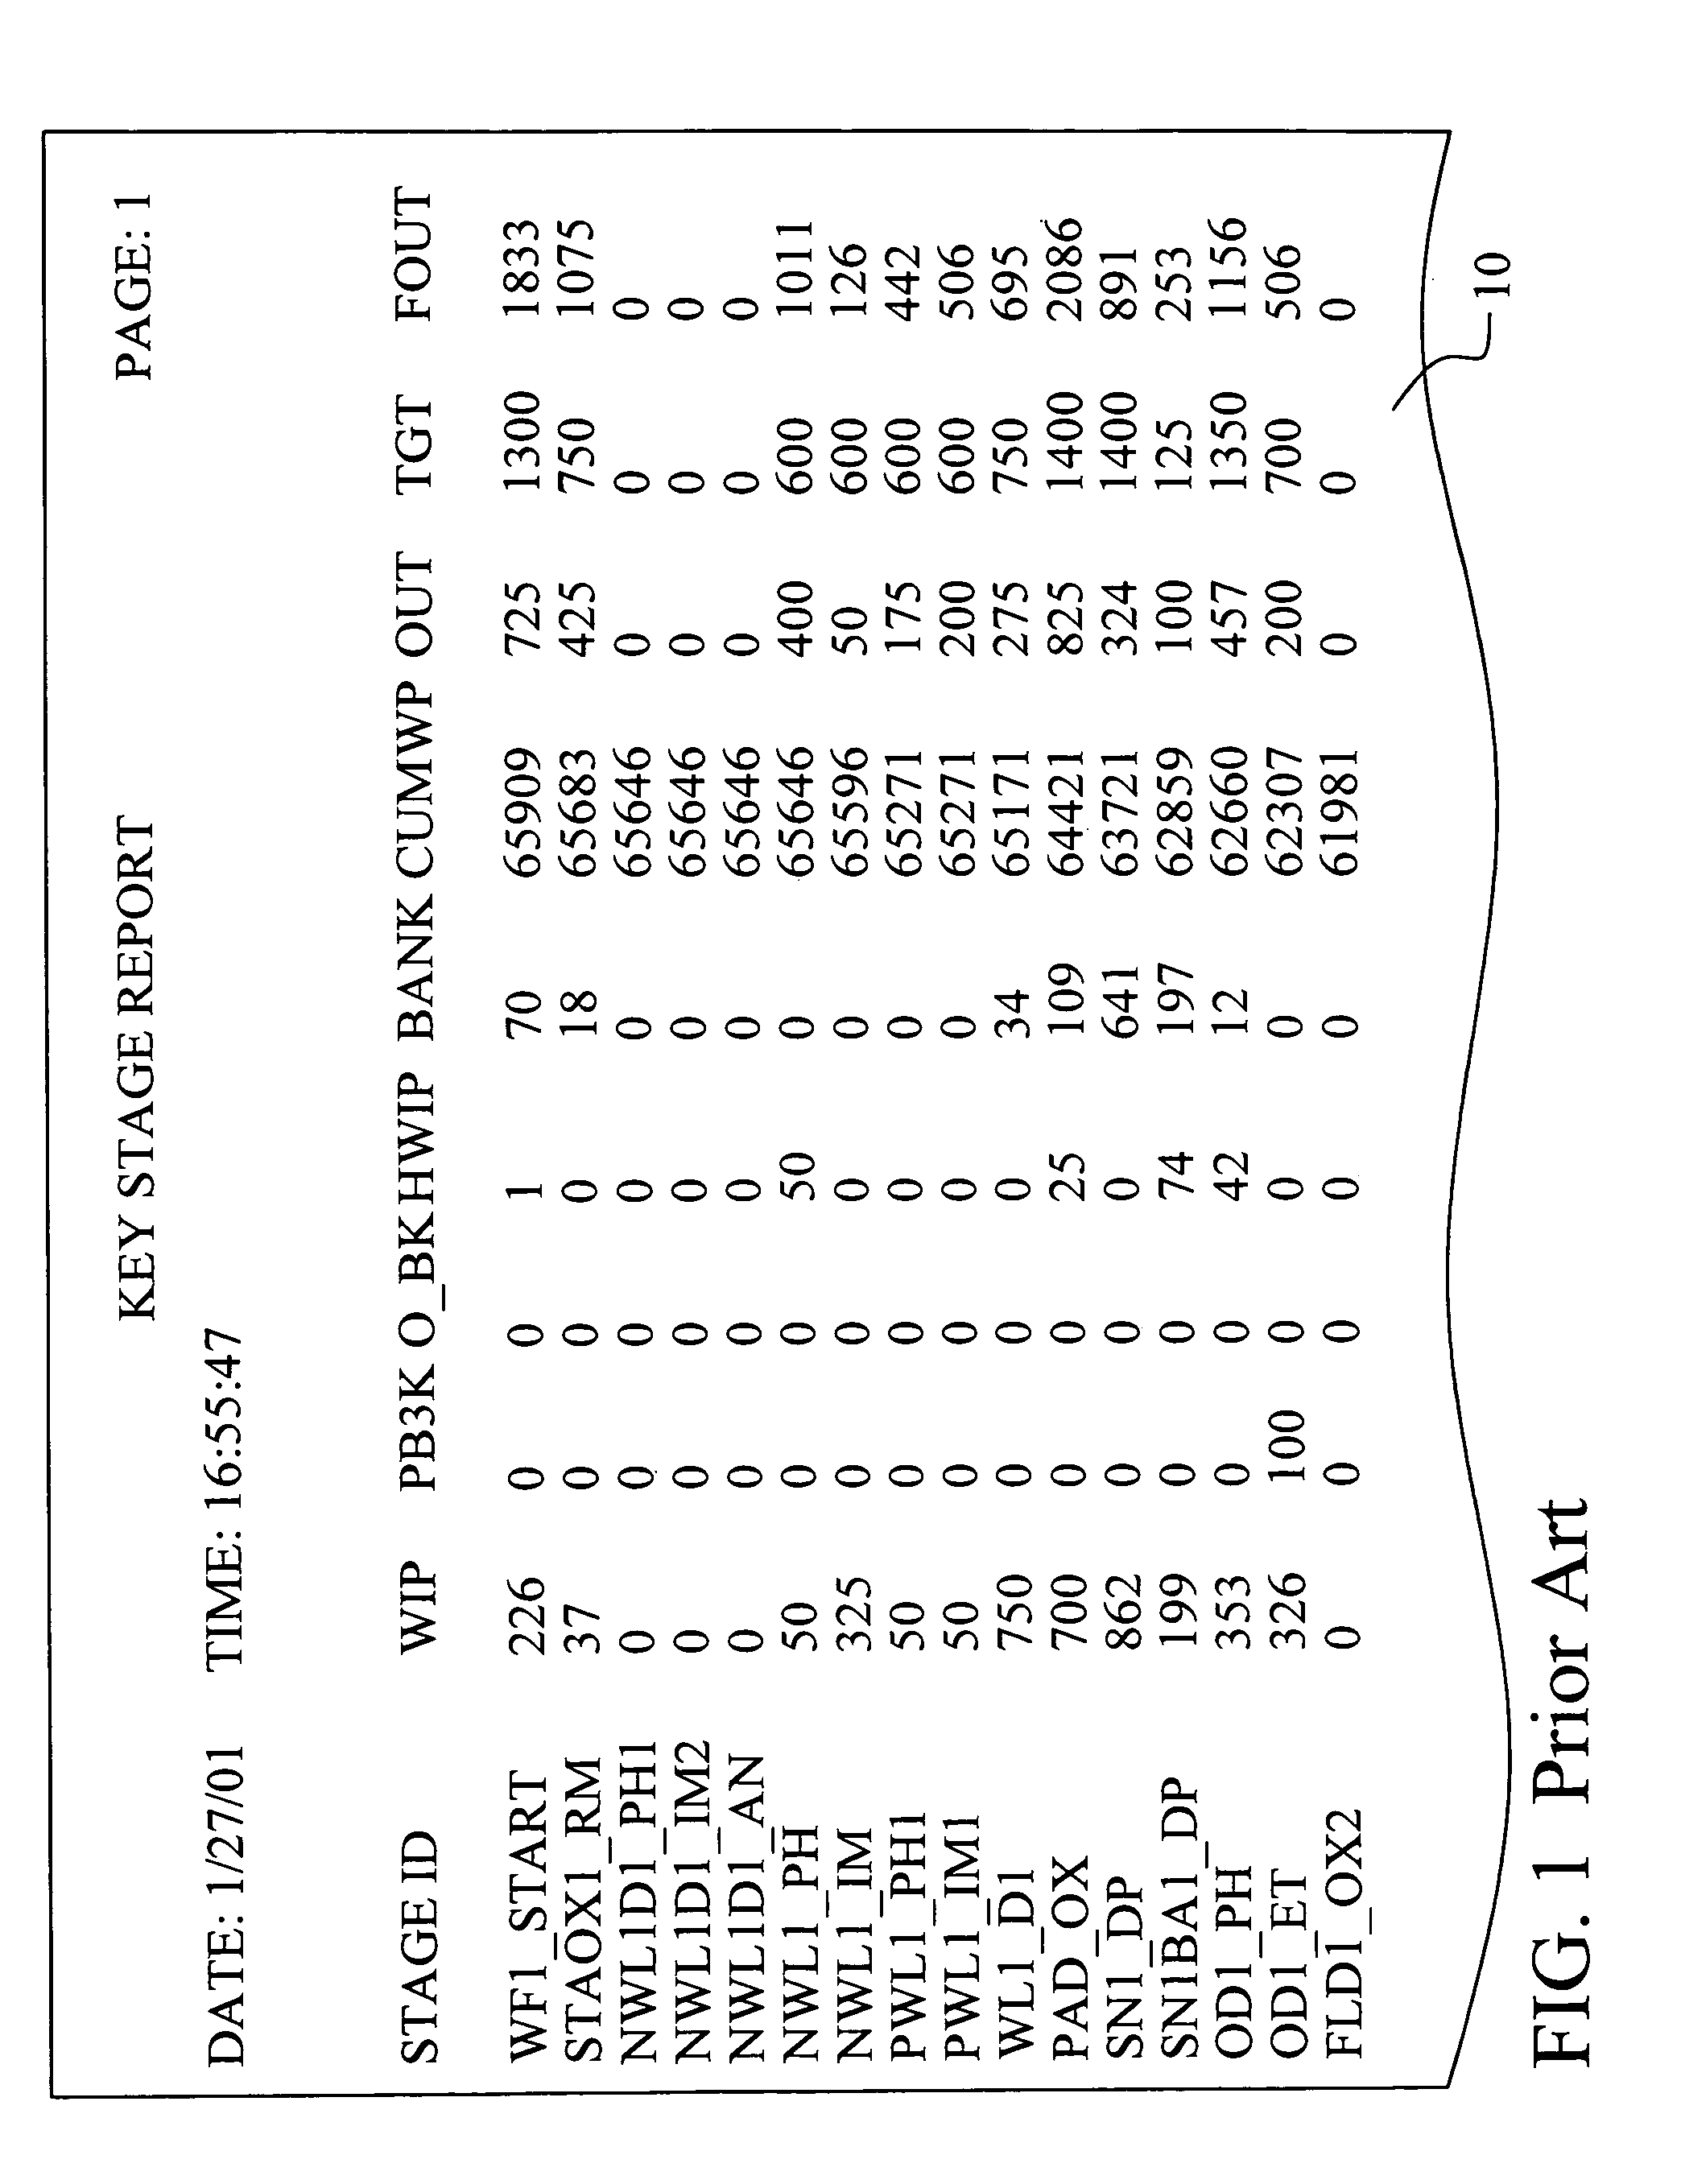
a technology of production data and display method, applied in the field of data processing and analysis of manufacturing data, can solve the problems of difficult for line supervisors or production operators to have an intuitive feeling of where the production imbalance is, and the large list of data will not be very useful in the decision-making process, and achieve the effect of easy interpretation

Inactive Publication Date: 2006-02-14
TAIWAN SEMICON MFG CO LTD
View PDF10 Cites 10 Cited by
  • Summary
  • Abstract
  • Description
  • Claims
  • Application Information

AI Technical Summary

Benefits of technology

[0012]Another yet further object of the present invention is to present variance data in an intuitive bar graph format that is easy to interpret.

Problems solved by technology

Efficient management of a integrated circuit manufacturing plant is a difficult technical and managerial challenge.
Meeting customer delivery dates, maintaining a balanced manufacturing line, working around equipment maintenance and repair, and responding to frequently changing customer orders are among the problems facing the manufacturing manager.
The KSR 10 shown in FIG. 1 has a distinct disadvantage because it is a text-only report.
It is difficult for the line supervisor or the production operator to have an intuitive feeling as to where the production imbalance lies.
Unless the person analyzing the textual data has a wealth of experience, it is likely that the large listing of data will not be very useful in the decision making process.

Method used


Image

  • Method and apparatus for displaying production data for improved manufacturing decision making
  • Method and apparatus for displaying production data for improved manufacturing decision making
  • Method and apparatus for displaying production data for improved manufacturing decision making

Examples


Embodiment Construction

[0023]The preferred embodiment discloses the method and the apparatus of the present invention. In the preferred embodiment, the present invention is applied to the analysis and display of WIP and production moves data used in integrated circuit manufacture. It should be clear to those experienced in the art that the present invention can be applied and extended without deviating from the scope of the present invention.

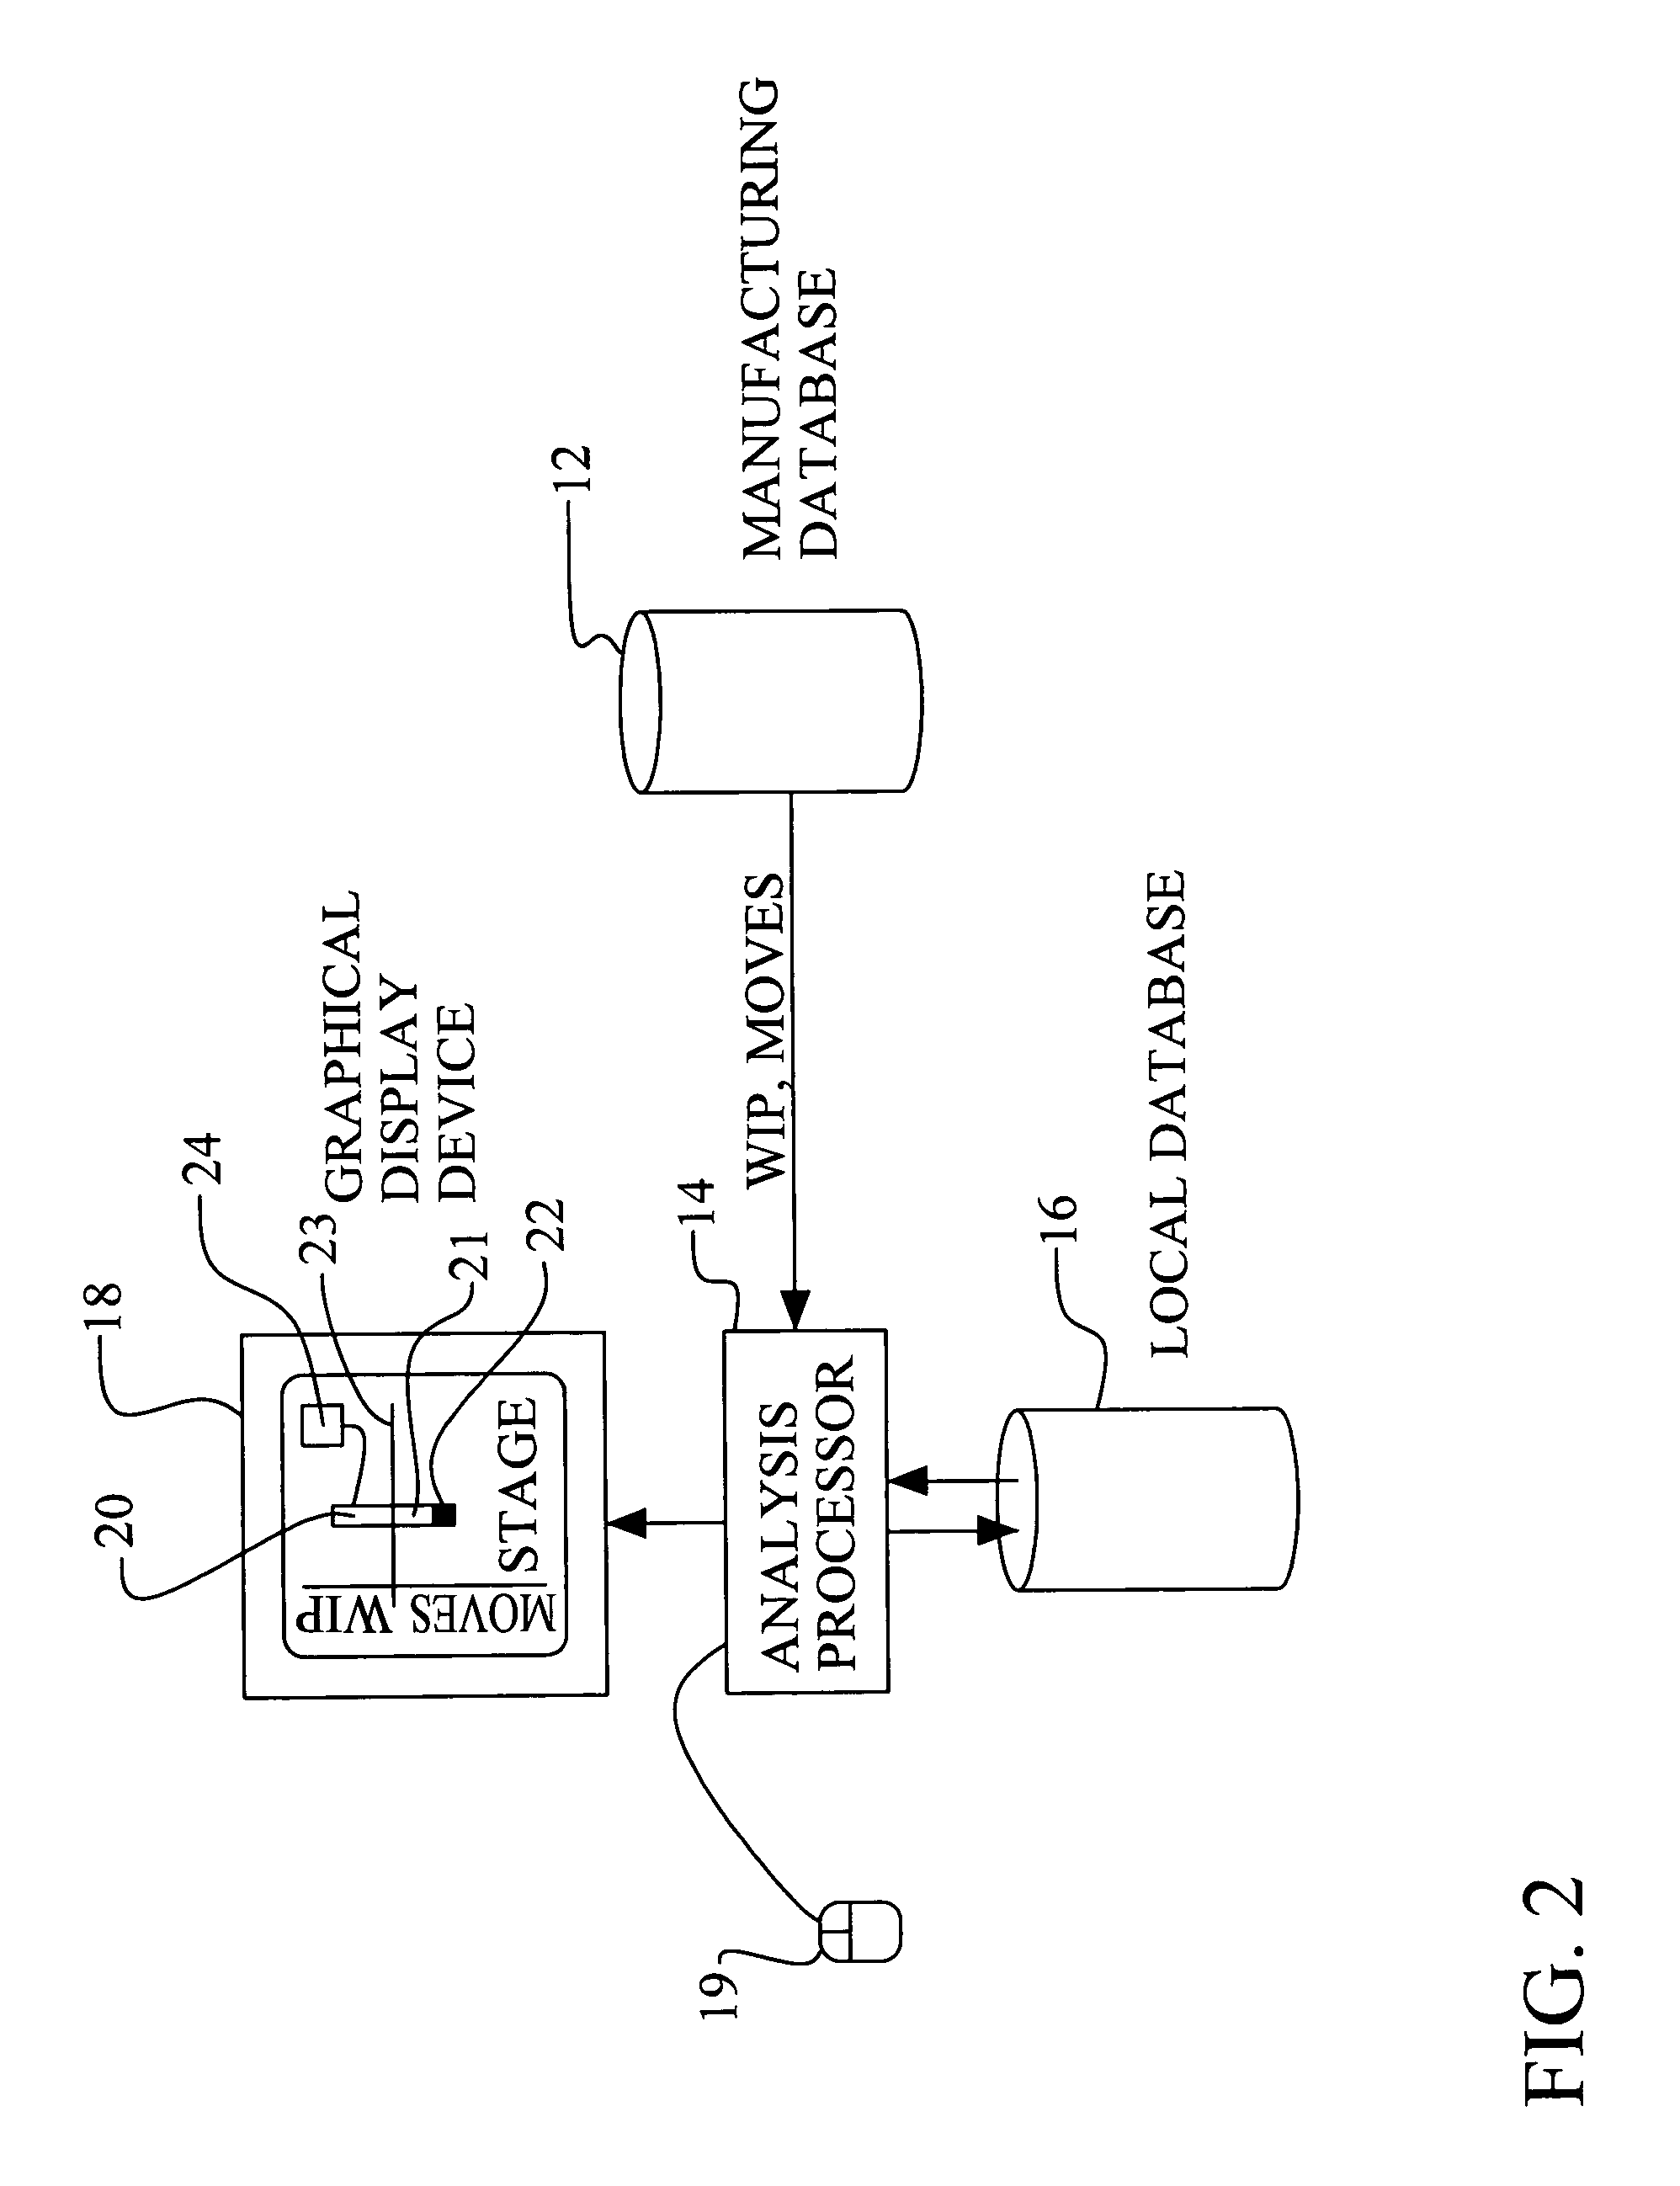
[0024]Referring now particularly to FIG. 2, a simplified diagram of the preferred embodiment of the apparatus of the present invention is shown. Several important features are illustrated. First, manufacturing data for the processes in the plant are stored in the manufacturing database 12. A manufacturing information system (MIS) records data on every production lot, process run, and production move in the processing plant. The MIS tracks the WIP at each stage in the processing sequence. For example, a key thermal process may have 6 product lots, each containing 25 wa...


PUM


Abstract

A new data processing and display method for use in interactive manufacturing process management is achieved. A first variable value, such as WIP, for a manufacturing stage is uploaded from a database and is subtracted from a first target value to obtain a first variable variance. A first variable variance bar is displayed above a stage axis on a graphical display device and is non-filled if the first variable variance is positive and is filled if the first variable variance is negative. A second variable value, such as production moves, is uploaded and is subtracted from a second target value to obtain a second variable variance. A second variable value bar is displayed below the stage axis on the graphical display device and is non-filled. A second variable variance bar is displayed below the second variable value bar on the graphical display device if the second variable variance is positive.

Description

BACKGROUND OF THE INVENTION[0001](1) Field of the Invention[0002]The invention relates to data processing and analysis of manufacturing data, and more particularly, to a method and an apparatus for an improved graphical depiction of work-in-progress and production moves data for use in integrated circuit manufacturing management.[0003](2) Description of the Prior Art[0004]Efficient management of a integrated circuit manufacturing plant is a difficult technical and managerial challenge. Meeting customer delivery dates, maintaining a balanced manufacturing line, working around equipment maintenance and repair, and responding to frequently changing customer orders are among the problems facing the manufacturing manager. To properly manage the production facility, manufacturing managers rely on data reports that provide ‘snapshots’ of the status of the wafer fab.[0005]Referring now to FIG. 1, an example of a prior art data report is illustrated. A Key Stage Report 10, or KSR, is a summa...

Claims


Application Information

Patent Timeline
Patent Type & Authority Patents(United States)
IPC IPC(8): G09G5/22
CPCG06Q50/00G06Q10/00
Inventor LIN, KUO-CHENHSIEH, MING-HONG
Owner TAIWAN SEMICON MFG CO LTD
Why Eureka
Try Eureka