
Network traffic visualization

a network traffic and visualization technology, applied in the field of network management applications, can solve the problems of reducing the information that can be gleaned, difficult to assimilate the data presented, and overwhelming amounts of data, so as to reduce human errors and quick assimilation

Inactive Publication Date: 2004-02-03
CISCO TECH INC
View PDF30 Cites 53 Cited by
  • Summary
  • Abstract
  • Description
  • Claims
  • Application Information

AI Technical Summary

Benefits of technology

The present invention is a visualization application that allows a system administrator to quickly and easily gather and analyze information about network traffic. The application collects data from routers and stores it for display at specific times or at the request of the administrator. The display shows a map of the network with dynamic images that represent the selected information. This allows the administrator to quickly understand the composition of network activity and reduce human errors in interpreting static data tables. The technical effect of the invention is to provide a more efficient and effective way to analyze network traffic.

Problems solved by technology

Typically, the data is presented in tabular form, and the amount of data can be overwhelming.
Thus, it is often difficult to assimilate the data presented.
In order to facilitate assimilation of the data, the amount of data may be selectively reduced in volume, but this correspondingly diminishes the information that can be gleaned from it.
While such views are interesting in and of themselves, they fail to present a comprehensive, gestalt view of the network

Method used


Image

  • Network traffic visualization
  • Network traffic visualization
  • Network traffic visualization

Examples


Embodiment Construction

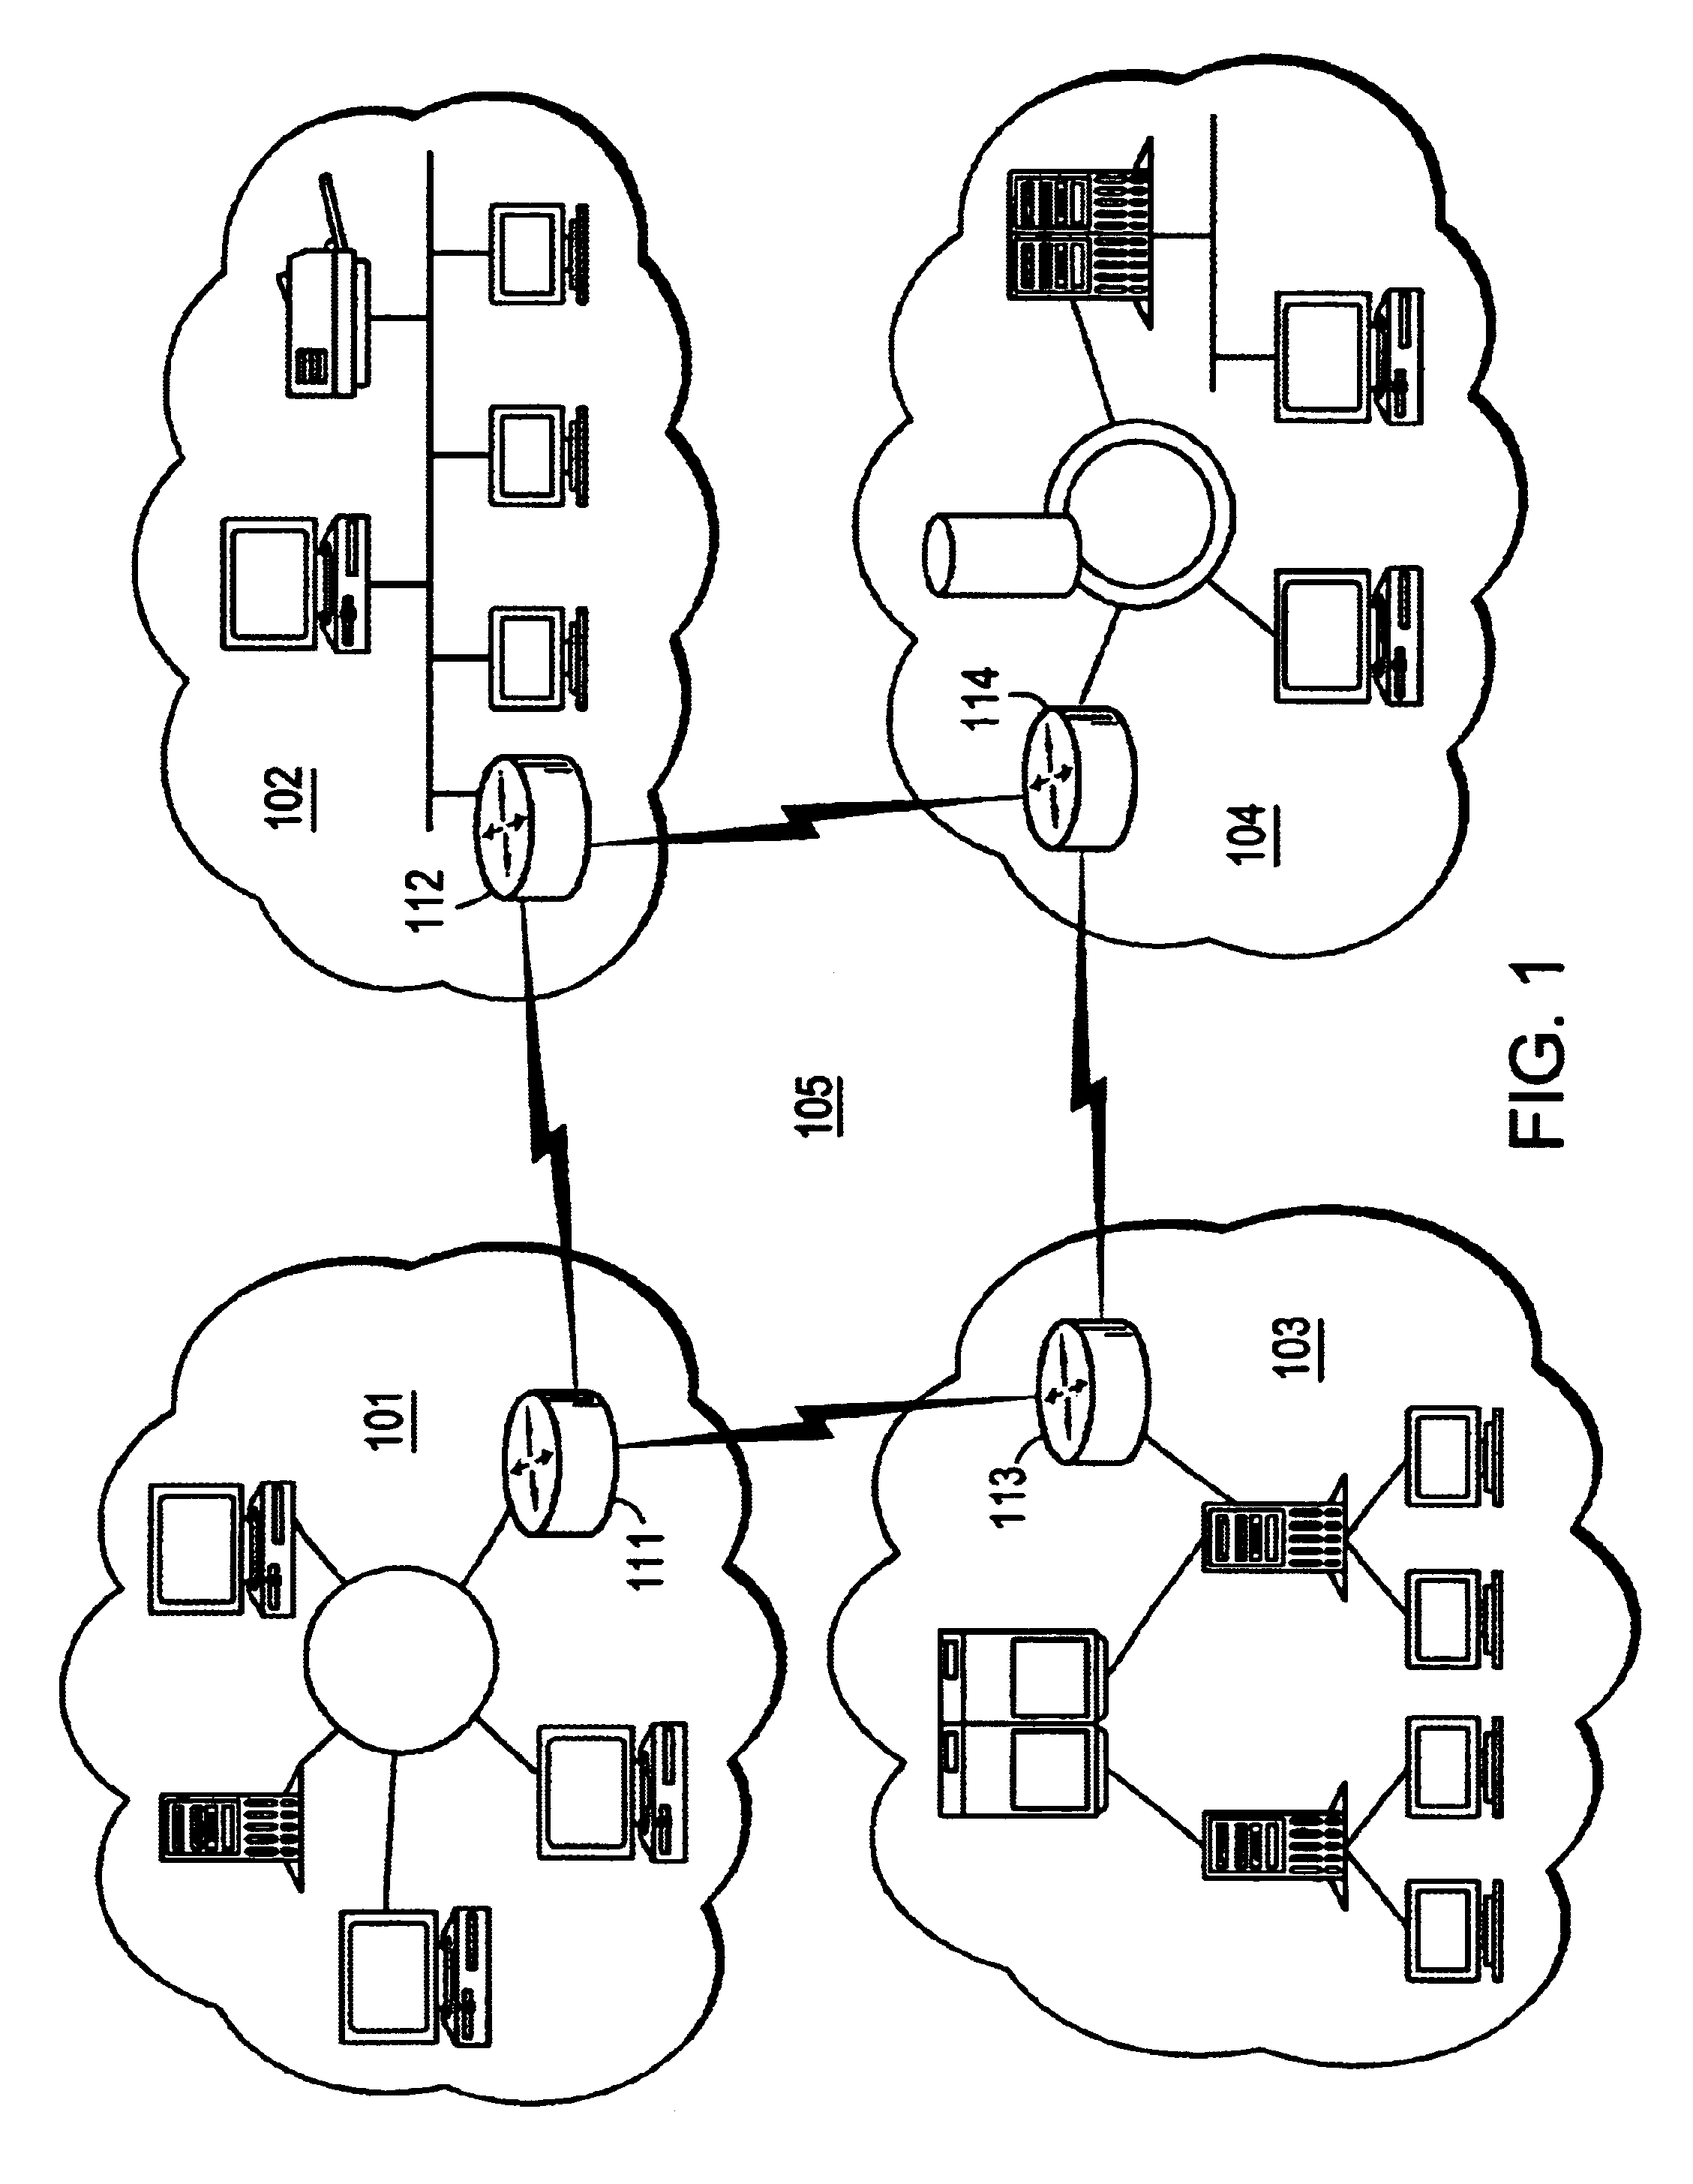
FIG. 1 is a schematic diagram of a distributed network management system that is configured to share resources and data in accordance with the present invention. The illustrated system is a combination of four separate local area networks (LAN) 101-104 that are interconnected into a wide area network (WAN) 105 to form a single distributed network structure. Each LAN 101-104 may include servers and clients that are connected by physical media such as cables and network cards in order to share resources such as files or applications. A server may be a computer or process that provides shared network resources to network users, and a client may be a computer or process that accesses the shared network resources provided by the servers. Shared resources in a network may include printers and other peripherals, as well as software applications. The LANs 101-104 are interconnected to communicate with each other by routers 111-114. The routers exchange protocol-specific information between ...


PUM


Abstract

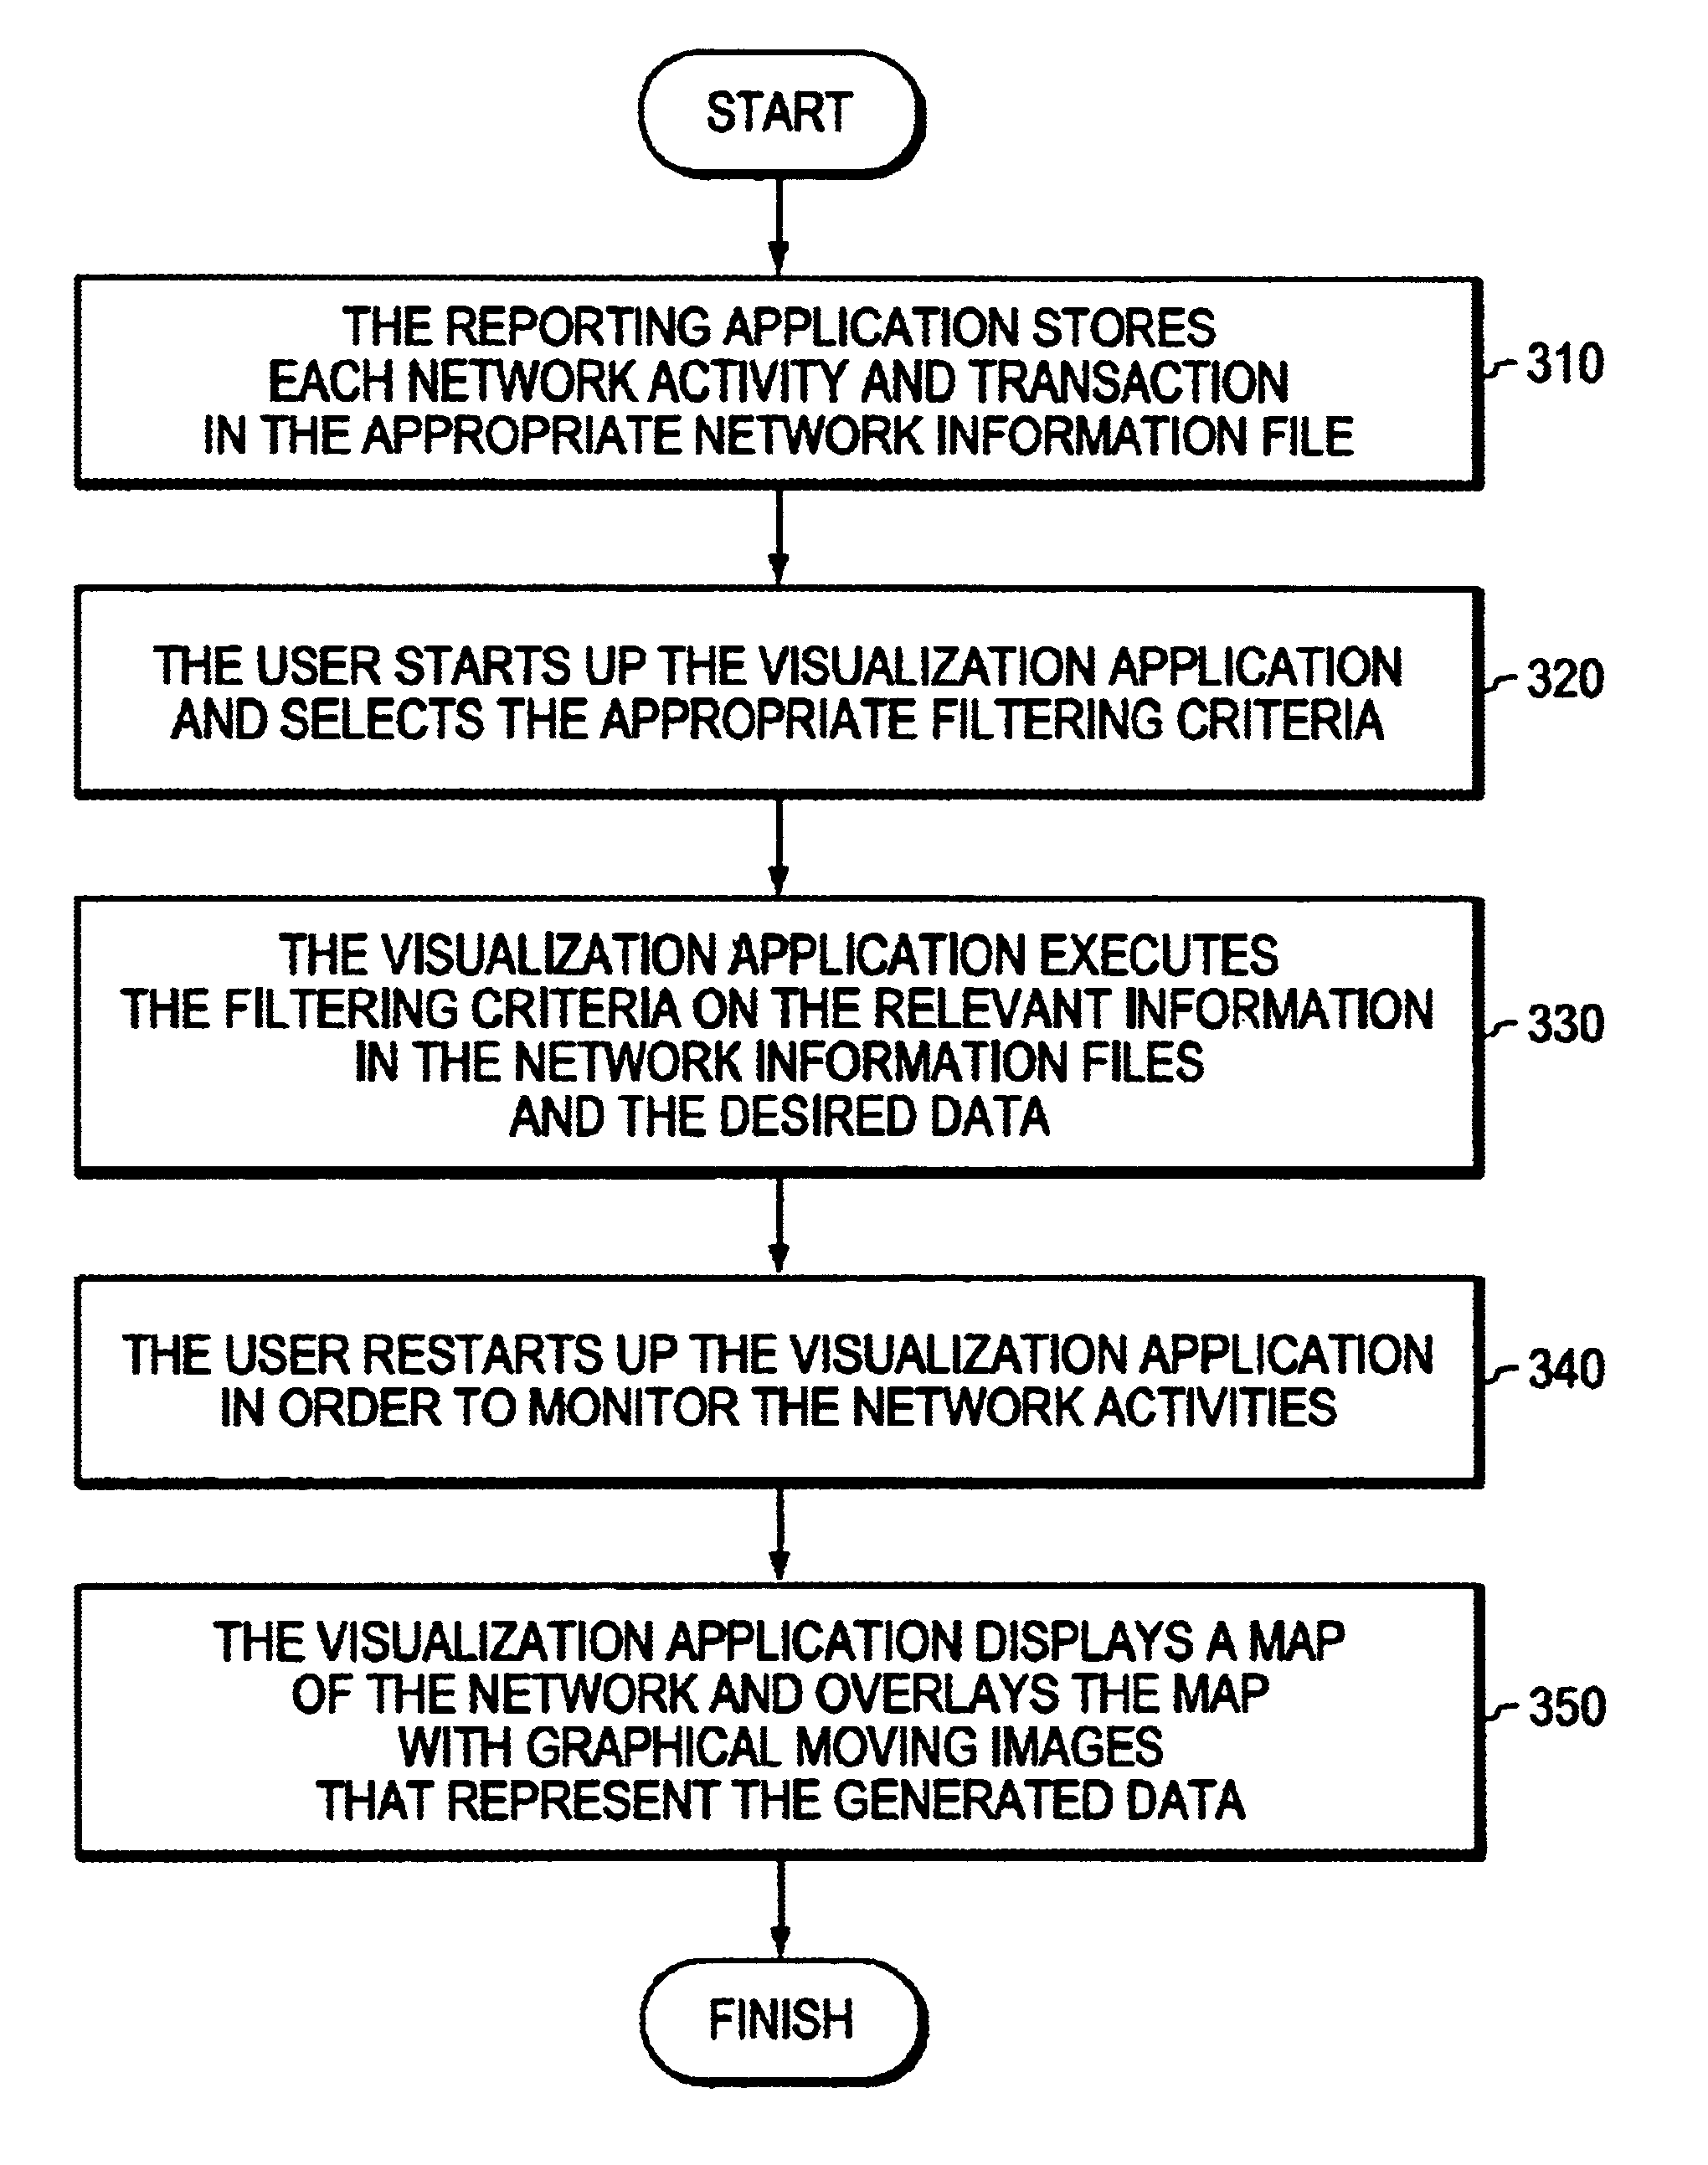
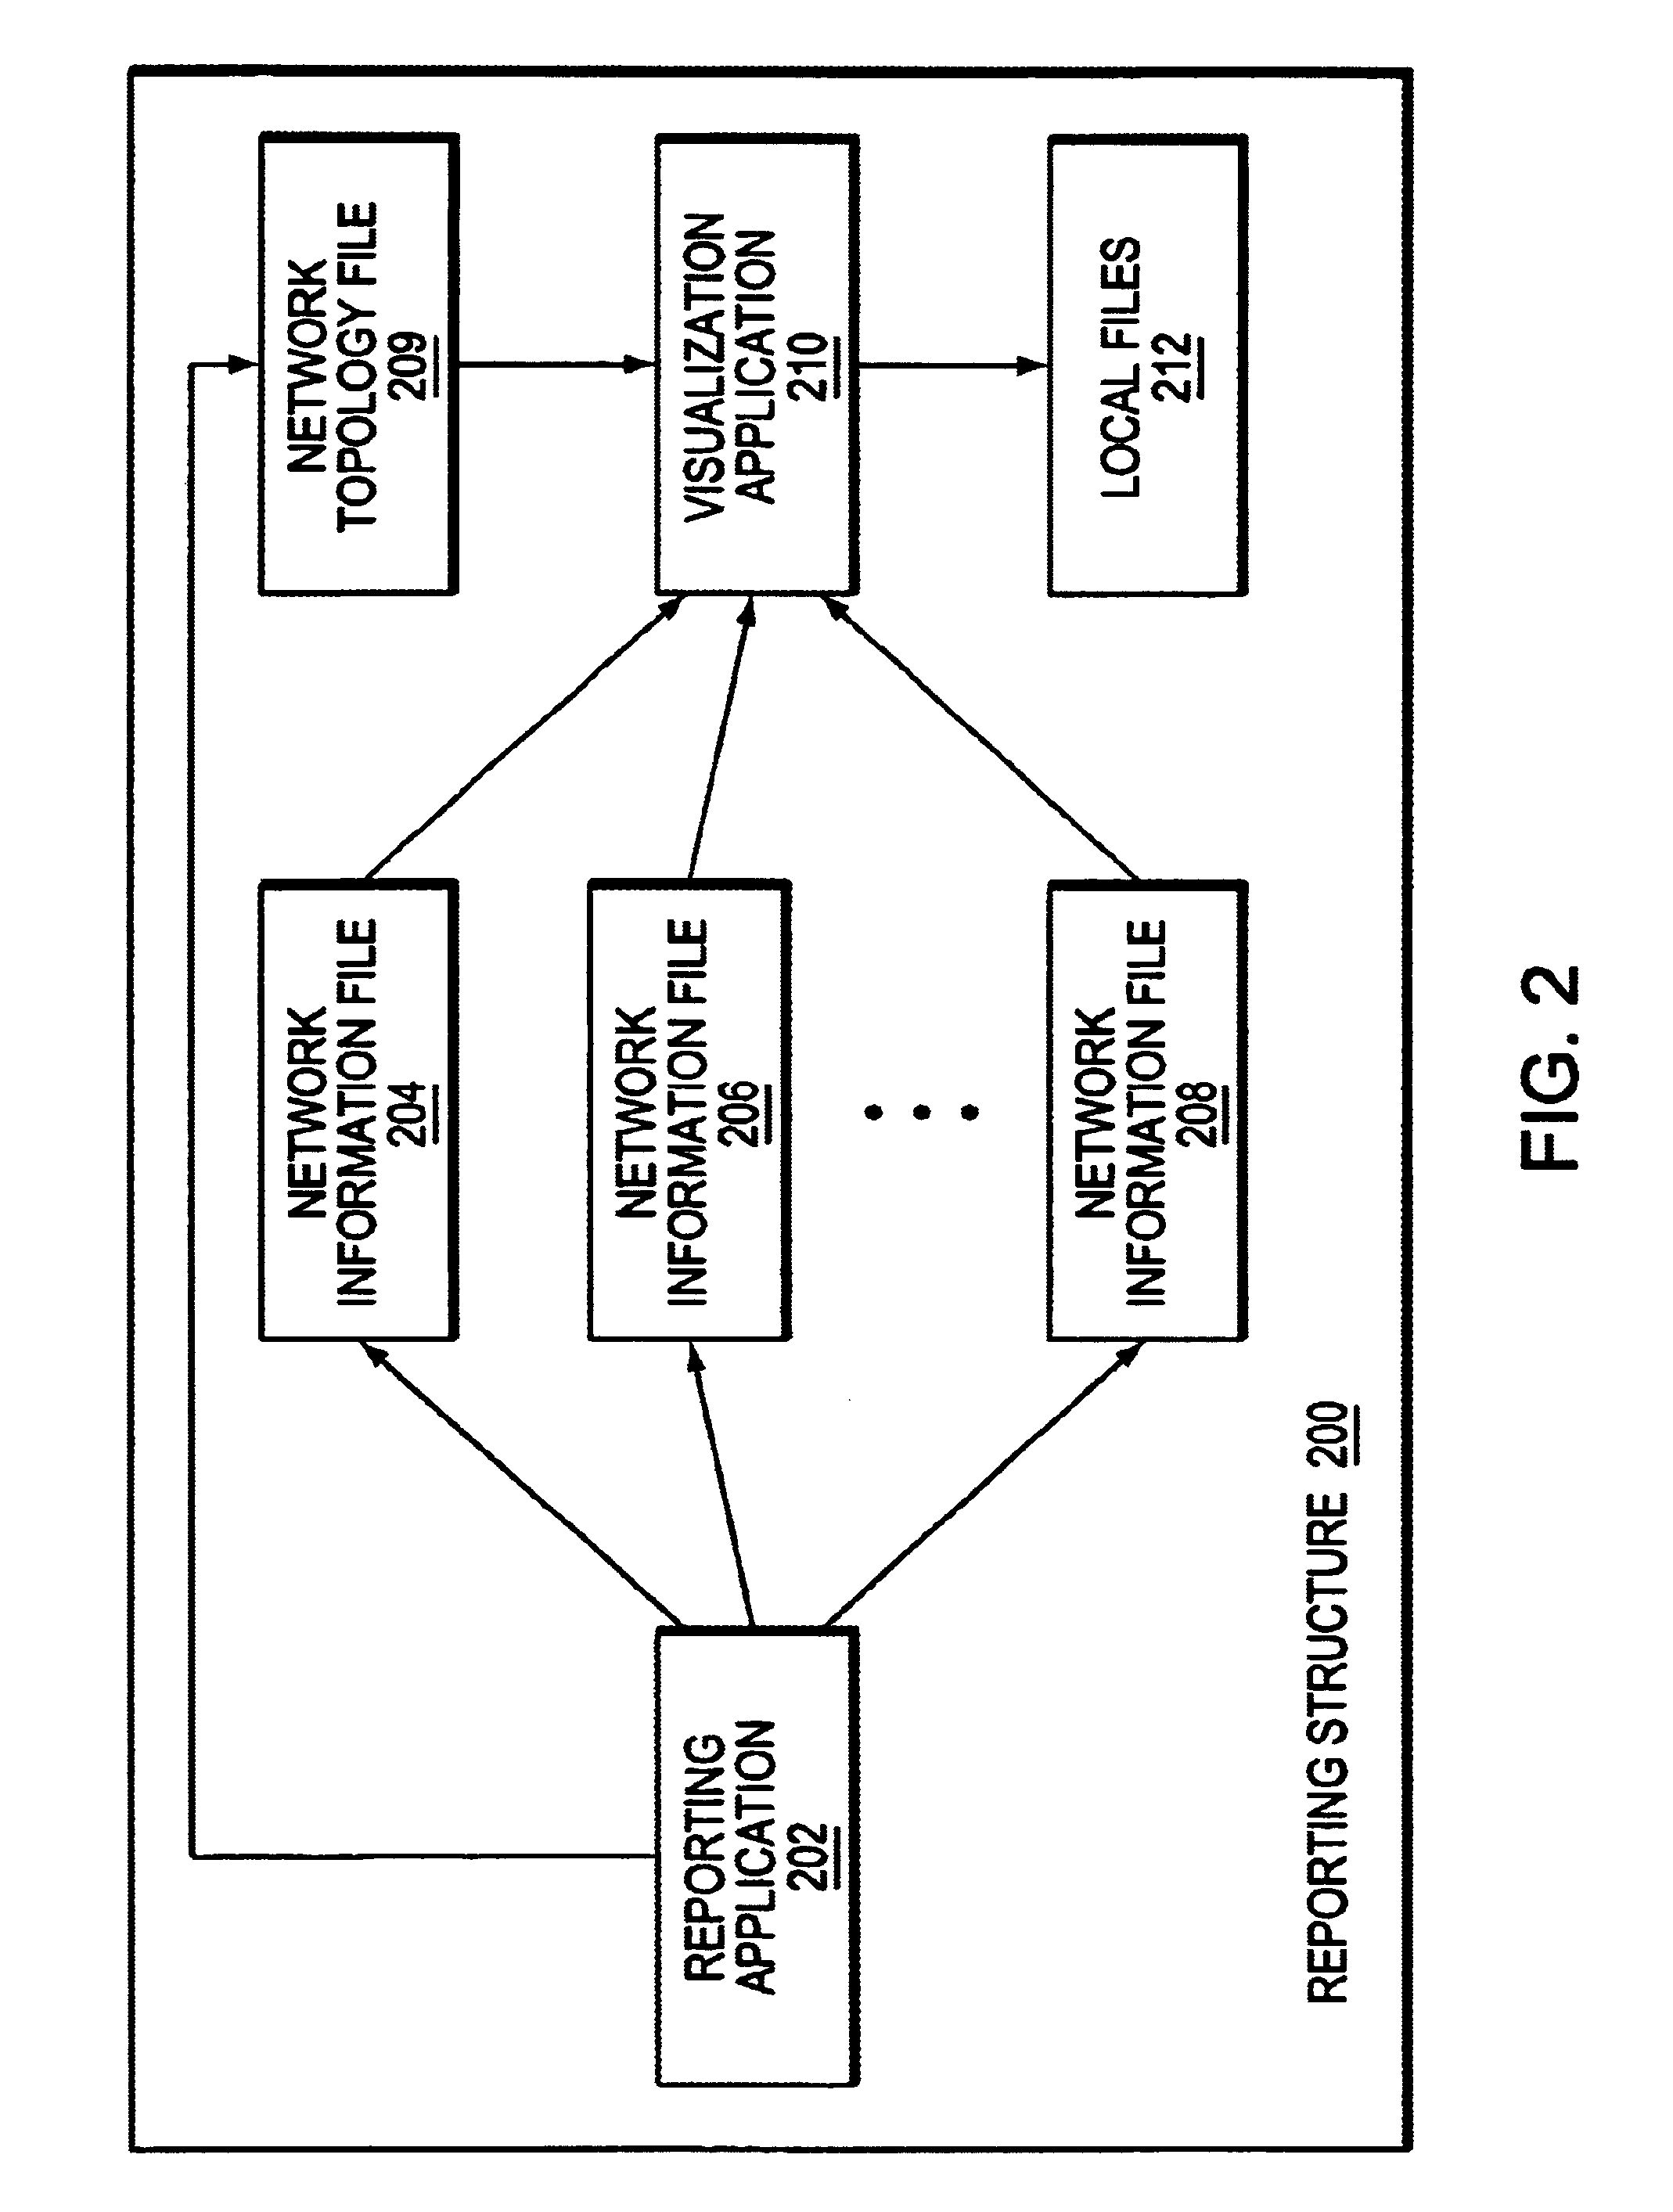
A system containing a visualization application which enables the user or other user to obtain information about various types of transactions involving the respective activities of the components. The user selects filtering criteria that identify various types of transactions performed on each network component from the visualization application and the visualization application uses these criteria in compiling the appropriate records from the network information files. The visualization application then forms the data that represent the records that meet each selected criterion and stores the data in a local file. Thereafter, the user may view the network activity through the visualization application which displays a map of the network and overlays the map with graphical moving images that represent the data for each selected criterion. The graphical images change with time to reflect changes in the underlying data.

Description

FIELD OF THE INVENTIONThis invention relates to network management applications that assemble network information, and specifically to a visualization application that displays network traffic information assembled by the network management applications.BACKGROUND OF THE INVENTIONDistributed computer networks, to which this invention applies, are systems comprising a number of components such as printers, computers, routers and the like, that are interconnected to enable communication among the components and sharing of data and resources. For example, a distributed computer network may include a combination of separate local area networks (LAN) that are connected in a wide area network (WAN) to form a single distributed network structure. The LANs are interconnected to communicate with each other by routers. Each LAN may include servers and clients that are connected by physical media such as cables and network cards in order to share resources such as files or applications. A serv...

Claims


Application Information

Patent Timeline
Patent Type & Authority Patents(United States)
IPC IPC(8): H04L12/24
CPCH04L41/22
Inventor MESSINGER, FREDSWALLOW, GEORGE
Owner CISCO TECH INC
Learn More