
Method and system for visualising colocalised fluorescence signals

a fluorescence signal and colocalisation technology, applied in the field of me and system for visualising colocalised fluorescence signals, can solve the problems of inconvenient interpretation of visualisation, inability to convey spatial information, and work undertaken

Pending Publication Date: 2022-06-16
STELLENBOSCH UNIVERSITY
View PDF3 Cites 2 Cited by
  • Summary
  • Abstract
  • Description
  • Claims
  • Application Information

AI Technical Summary

Benefits of technology

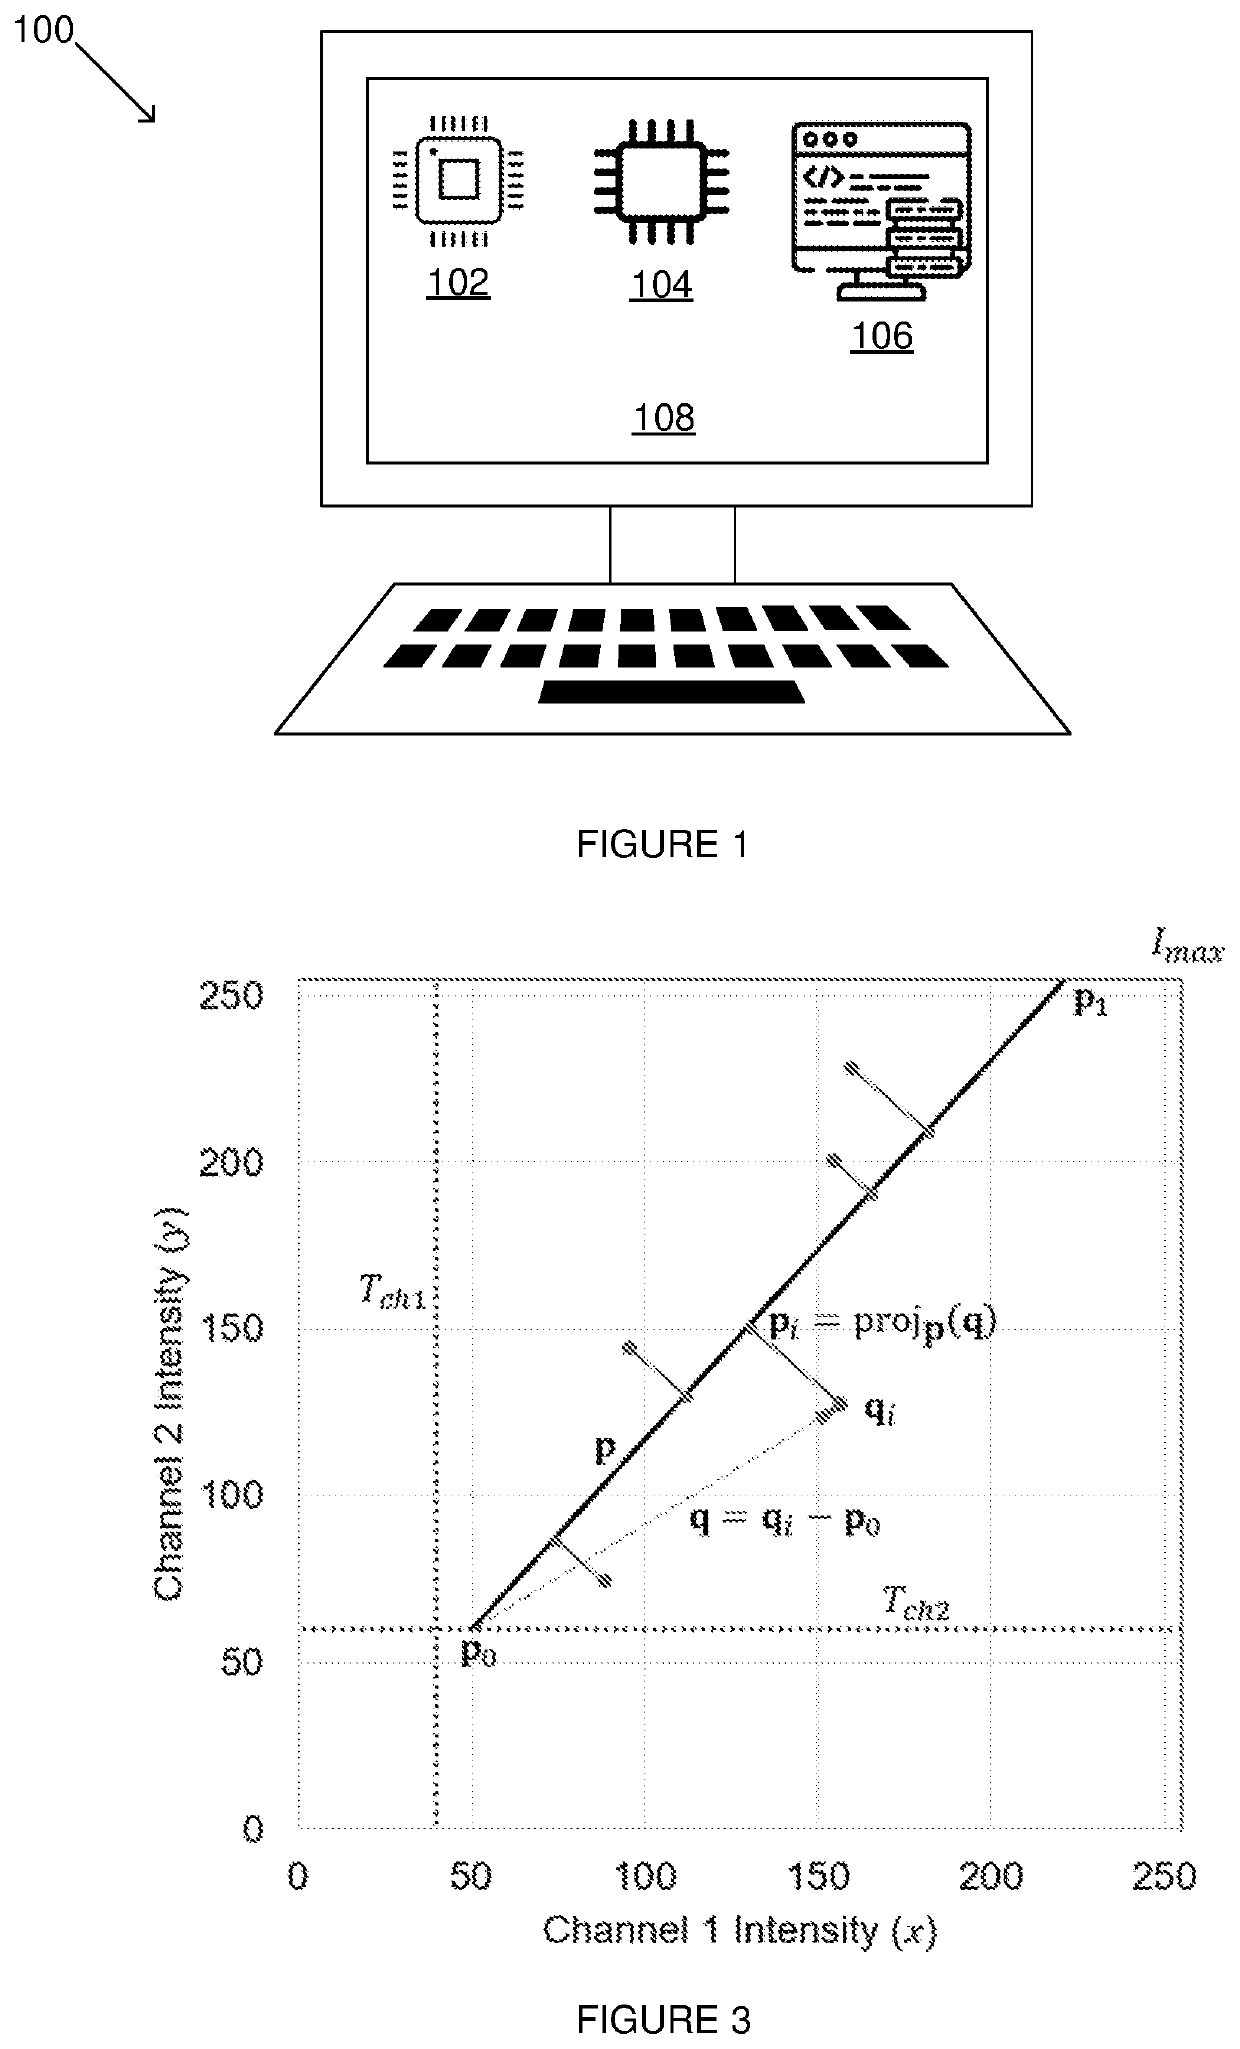
The present invention provides a computer system for analyzing and visualizing fluorescence data in a three-dimensional image. The system includes an accessing component for accessing fluorescence data, a regression calculating component for calculating a regression parameter based on the signal intensity data from two fluorescence channels, a mapping component for mapping the signal intensity data to the regression parameter, a colormap value assigning component for assigning a color map value to each voxel, and a rendering component for rendering the voxels in the image in the assigned colors. The technical effect of this invention is to provide a tool for visualizing colocalization of fluorescence data in an image in a more intuitive and user-friendly way.

Problems solved by technology

Although these measures are effective for the comparison of colocalisation between samples, especially when coupled with region of interest (ROI) selection, they are less suitable to convey any spatial information.
This is problematic since the intensity dynamics are rarely similar across different samples acquired through fluorescence microscopy.
Furthermore, visualisation of spatial colocalisation is most often performed two-dimensionally (2D) and only limited work has been undertaken to allow visualisation in three-dimensional (3D) space.
This can however introduce inconsistencies into the interpretation of the visualisation.

Method used


Image

  • Method and system for visualising colocalised fluorescence signals
  • Method and system for visualising colocalised fluorescence signals
  • Method and system for visualising colocalised fluorescence signals

Examples


examples

[0083]In the following examples, the method and system is applied and validated by visualising colocalisation in both synthetically generated data as well as in three distinct biological samples.

[0084]This demonstrates the advantages offered by the method and system of the present disclosure. In the first biological sample the colocalisation between α / β tubulin and acetylated tubulin is visualised. In the second and third samples the colocalisation between two organelles and between an organelle and tubulin are respectively visualised. In the third example, the fused state between lysosomes and autophagosomes and between autophagosomes and tubulin are investigated. Due to the small size of the organelles and the fineness of the filamentous tubulin structures, it is commonly challenging to accurately investigate the degree of colocalisation between them. These structures were therefore deliberately chosen to demonstrate the performance of the present method and system in challenging ...


PUM


Abstract

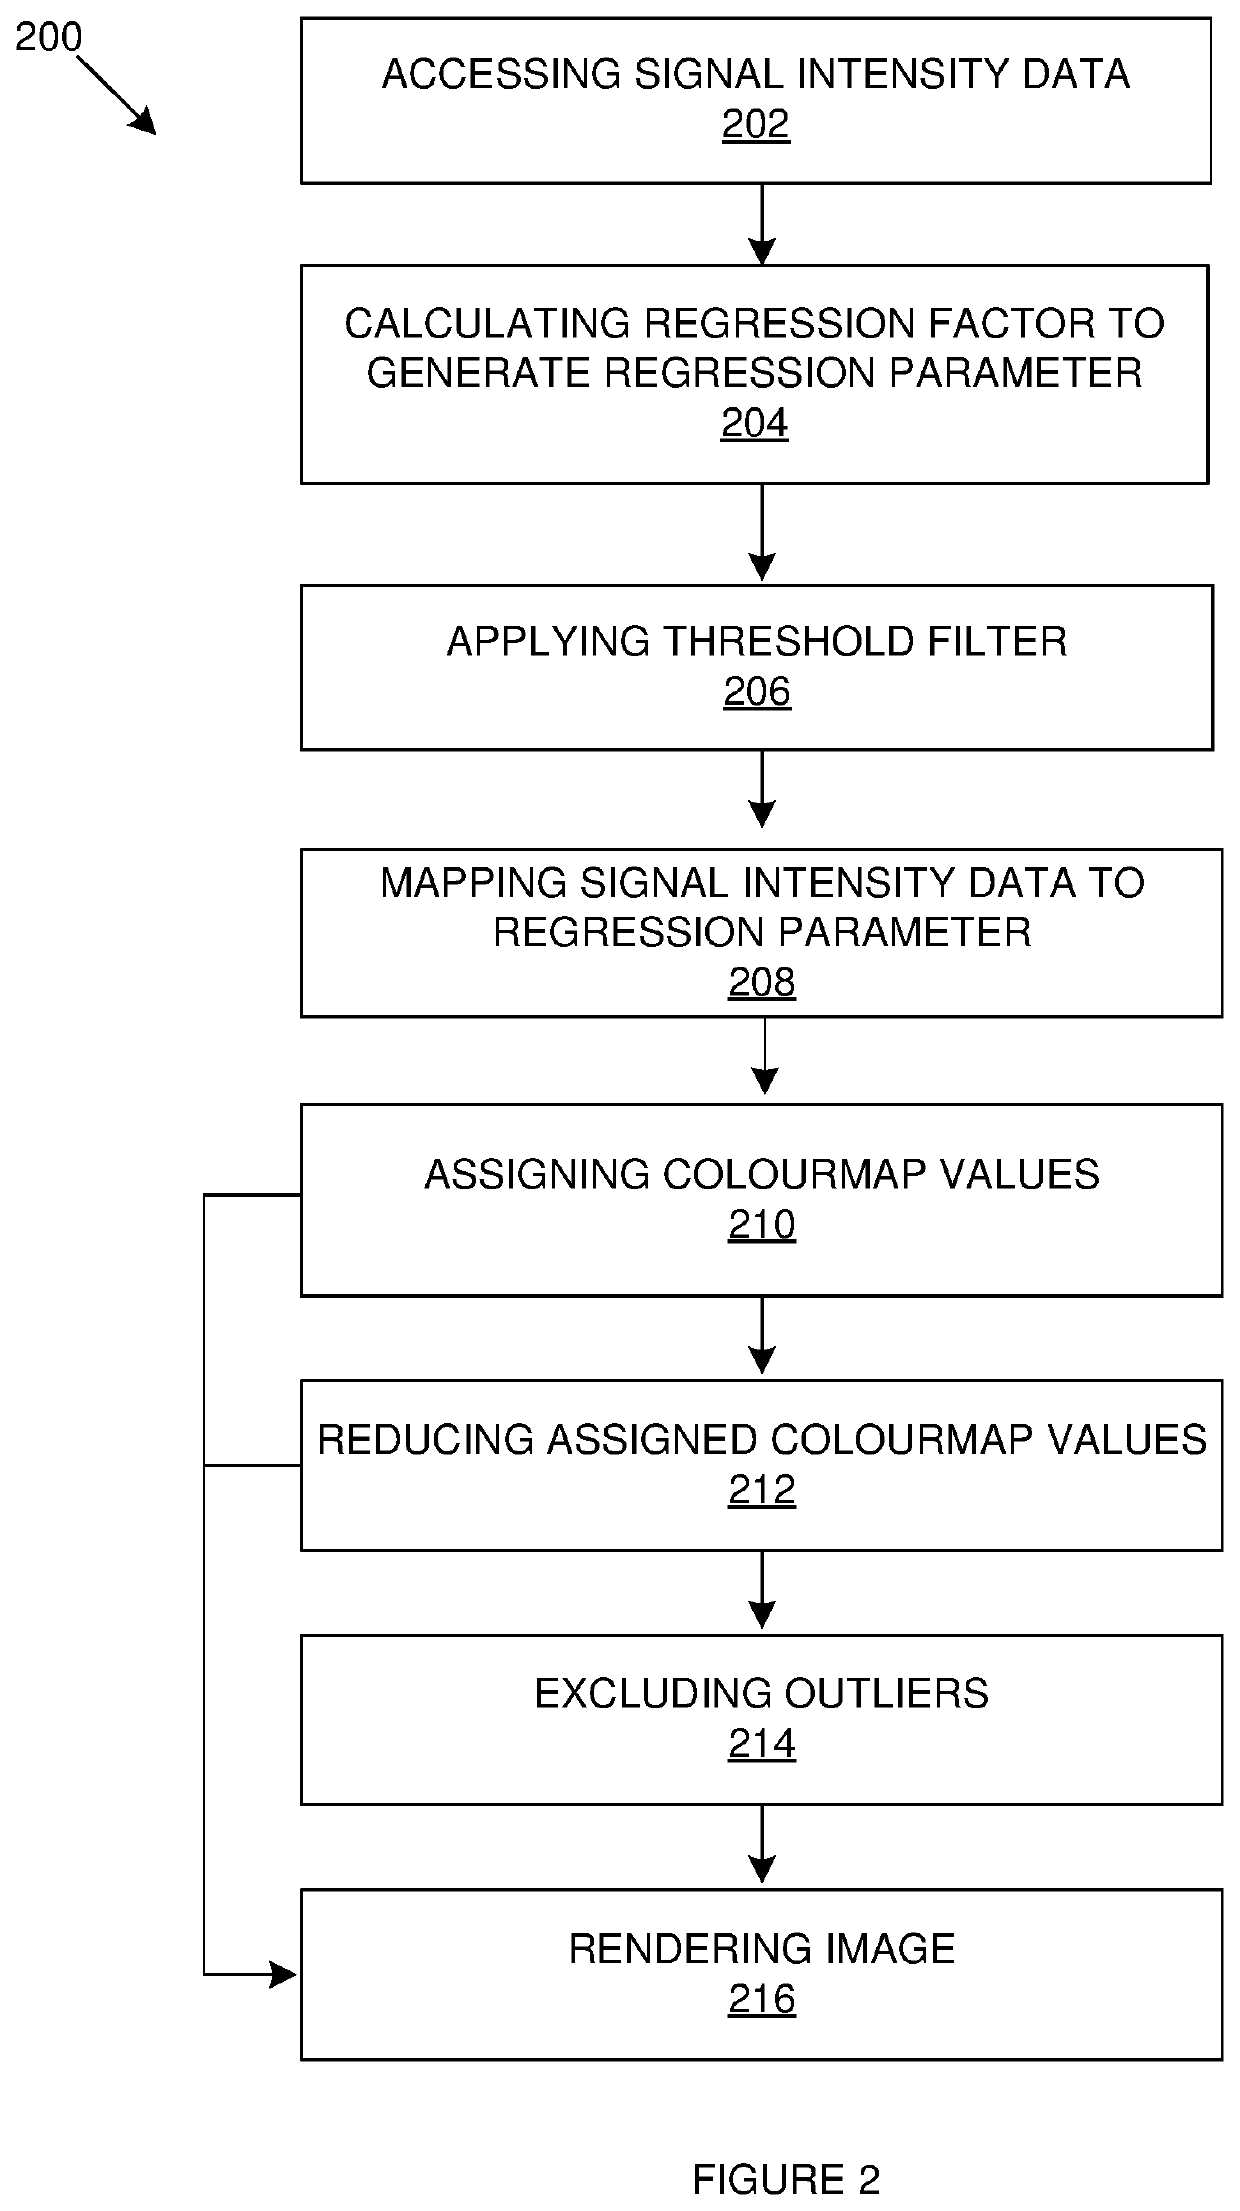
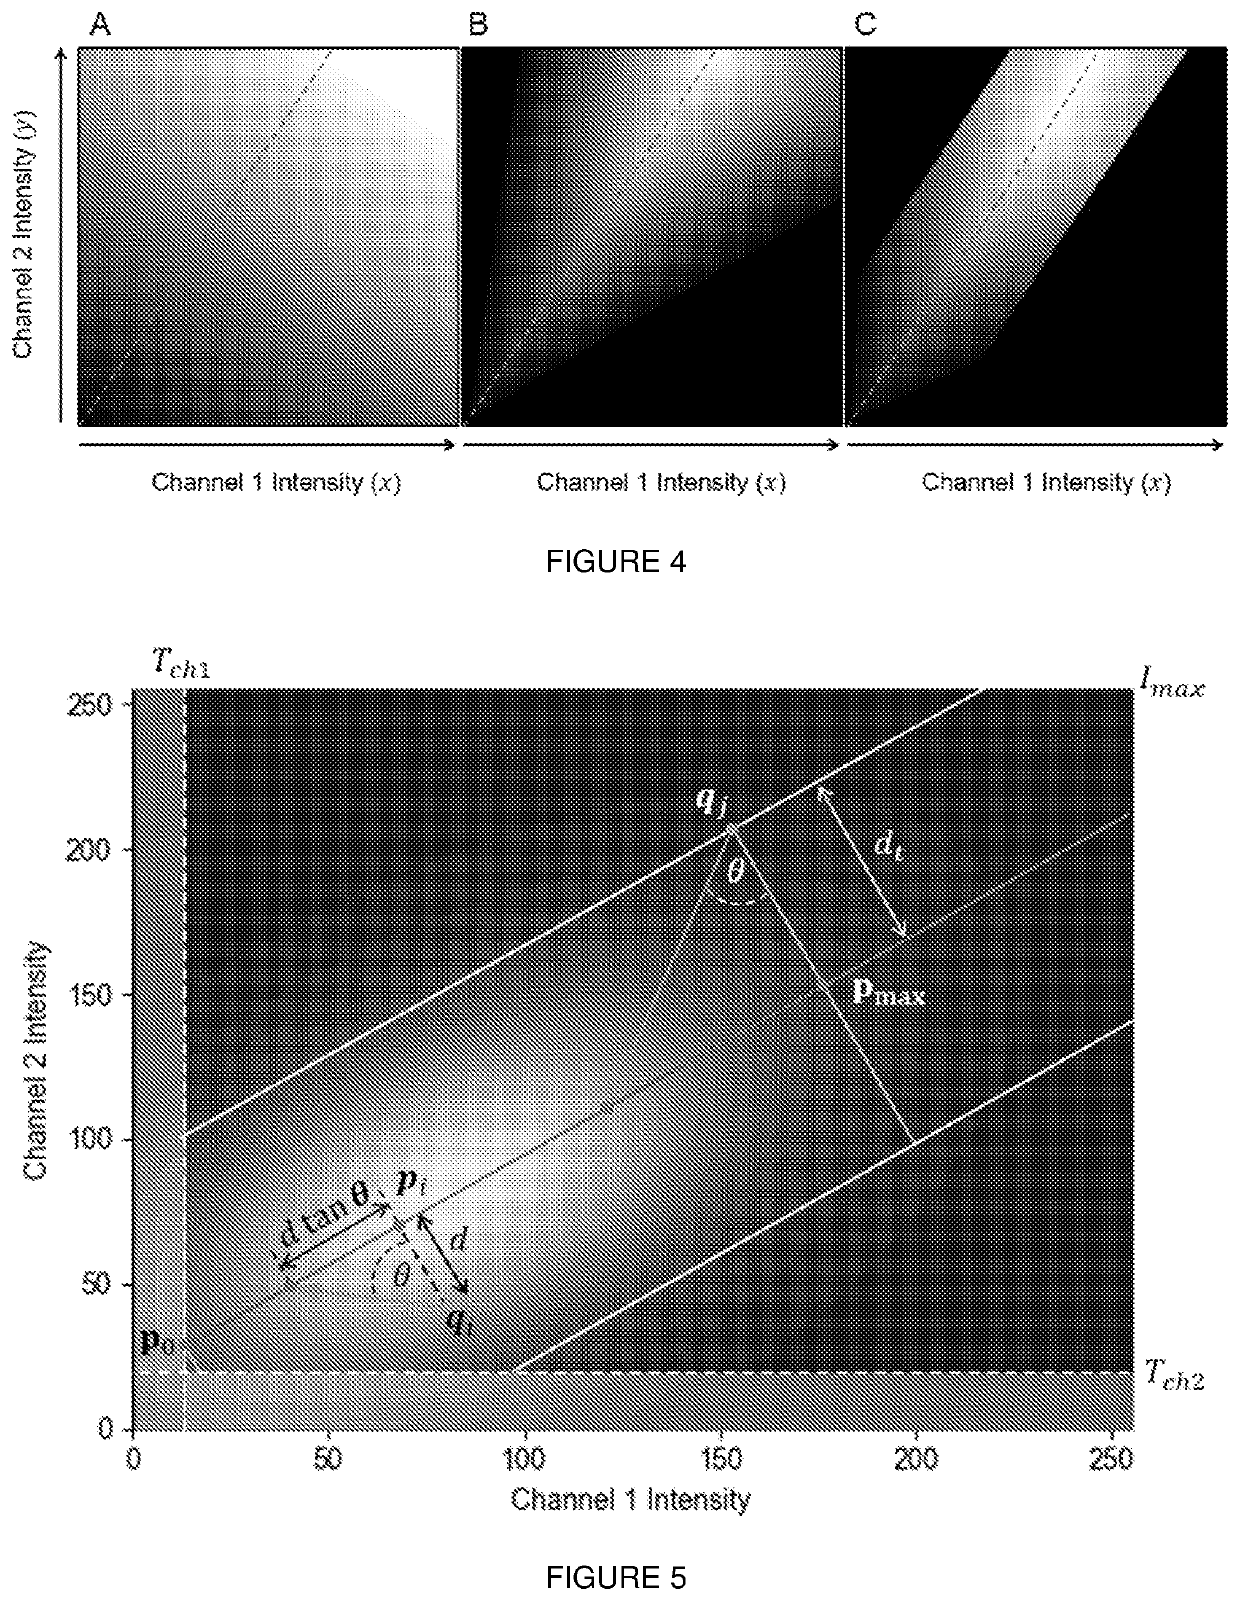
A computer-implemented method and a system are provided for visualising colocalised fluorescence signals. The method accesses signal intensity data obtained from a first fluorescence channel and a second fluorescence channel in which the signal intensity data is associated with voxels in an image. A regression factor on the signal intensity data is calculated to generate a regression parameter corresponding to a degree of correlation between the signal intensity data obtained from the first and second fluorescence channels The signal intensity data is mapped to the regression parameter and colourmap values are assigned to each voxel based on the mapped signal intensity data in which colourmap values of voxels embodying poorly correlated signal intensity data are reduced. The method renders the voxels in the image in colours according to their colourmap values to visualise colocalisation in the image.

Description

CROSS-REFERENCE(S) TO RELATED APPLICATIONS[0001]This application claims priority from South African provisional patent application number 2019 / 02511 filed on 23 Apr. 2019, which is incorporated by reference herein.FIELD OF THE INVENTION[0002]This invention relates to a me and system for visualising colocalised fluorescence signals in an image of a sample, such as a biological sample. The fluorescence signals may typically be obtained by fluorescence microscopy.BACKGROUND TO THE INVENTION[0003]Fluorescence microscopy is a major driving force in modern biology and medicine. Imaging of fluorescence signals is commonly carried out in biological sciences for investigating localisation of proteins, receptors, organelles, cells, etc. Researchers are often required to establish whether two molecules of interest are located in the same area (i.e., whether they are colocalised). Colocalisation can be defined as the presence of two or more different molecules in close spatial positions in a sa...

Claims


Application Information

Patent Timeline
IPC IPC(8): G06T19/20G01N21/64
CPCG06T19/20G06T2219/2012G01N21/6458
Inventor LOOS, BENJAMINNIESLER, THOMAS RICHARDTHEART, RENSU PETRUS
Owner STELLENBOSCH UNIVERSITY
Learn More