Process for detecting electrolyte and biomarker analyte levels with femtogram resolution in ionic solutions
a biomarker and electrolyte technology, applied in the field of biosensors, can solve the problems of prolonging the diagnosis and treatment of potentially life-threatening medical conditions, unable to provide real-time information, and difficult to assess whether a patient is responding to a course of treatment as intended
- Summary
- Abstract
- Description
- Claims
- Application Information
AI Technical Summary
Benefits of technology
Problems solved by technology
Method used
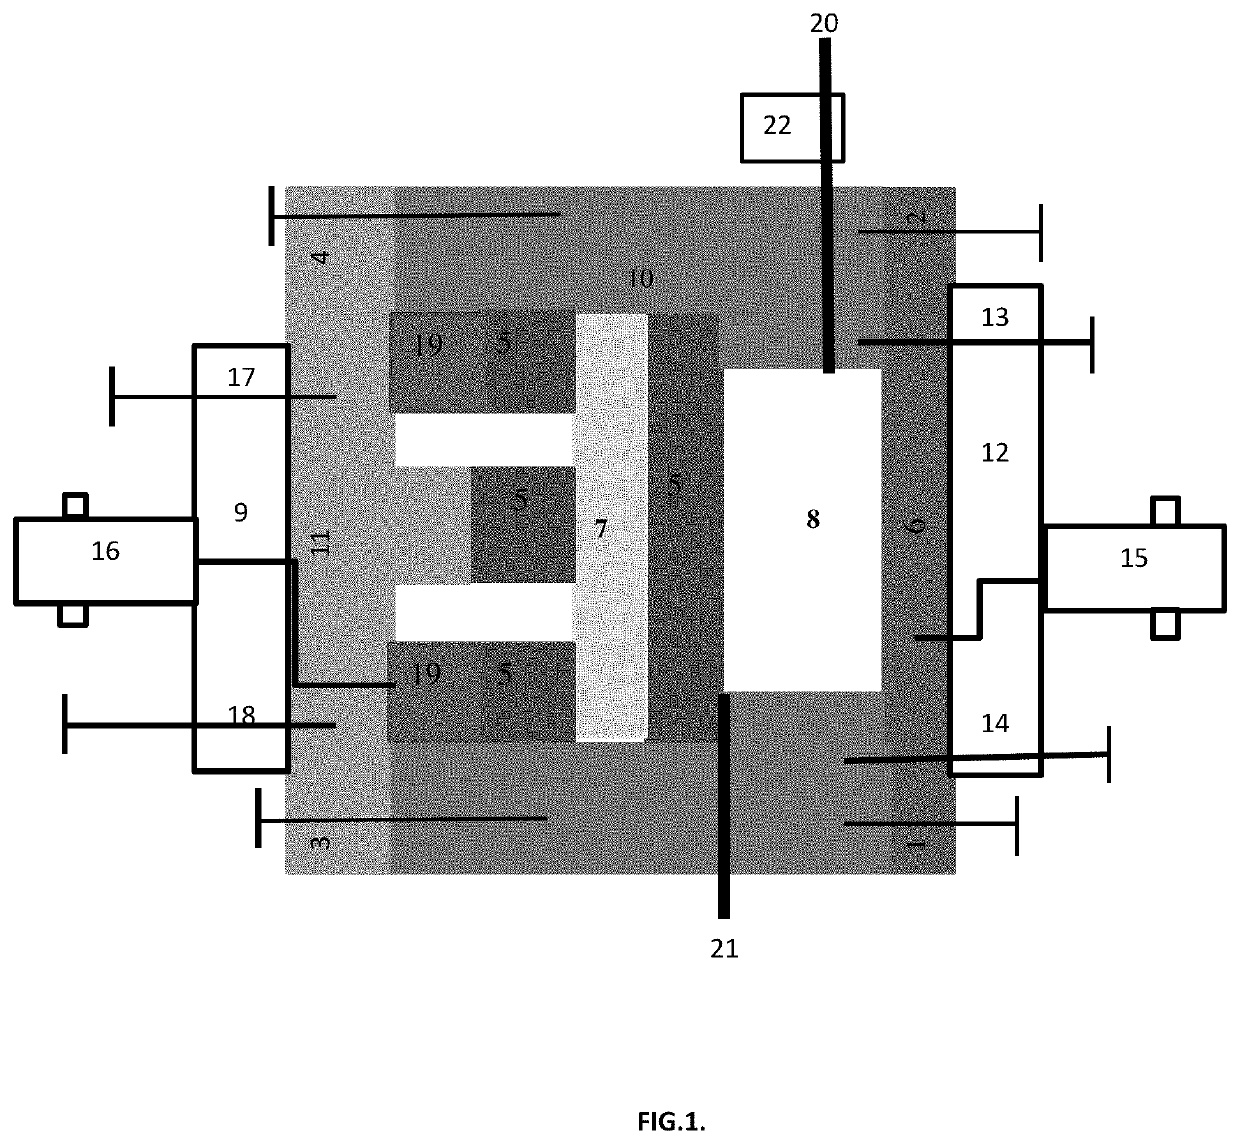
Image

Examples
examples
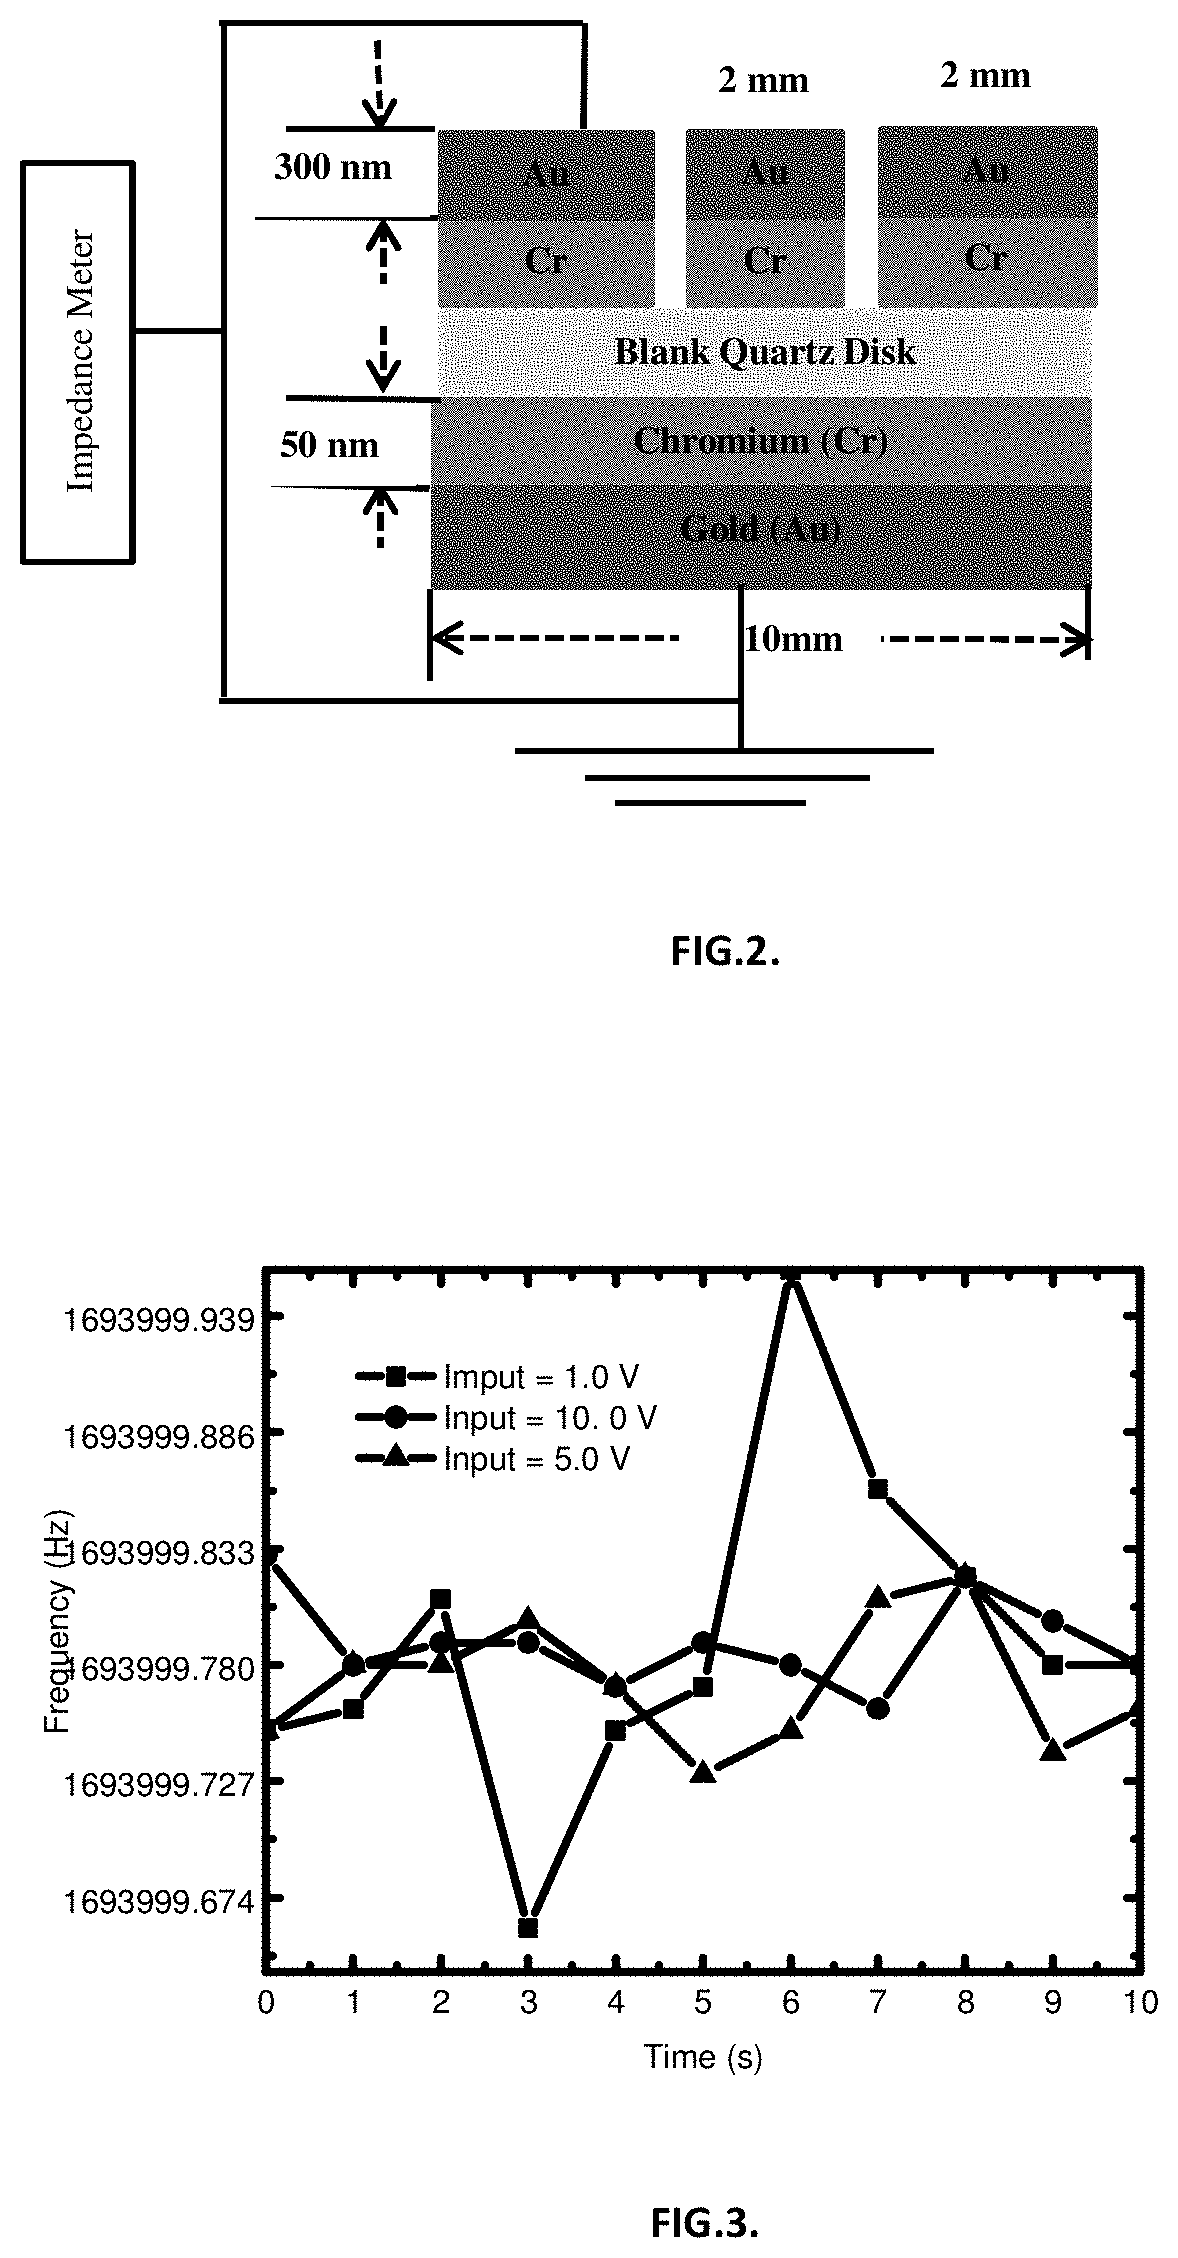
[0052]Before doing the Q-factor measurements using impedance meter, the frequency counter and the signal generator are calibrated using different input voltage to find the maximum input voltage where the frequency noises stable. The input parameters from the signal generator (Tekronix AFG2021) are varied from 1.0 V, 5.0 V and 10.0 V at 1.694 MHz, and the output frequency noises are then measured using a frequency counter (Tektronic FCA3000) as shown in FIG. 2. FIG. 3 is a graph showing the frequency noise stability at the different input voltages. The frequency noises became more stable at 10.0V and the maximum detectable noise is 10−10 MHz. The measured frequency noise when the input voltage is 1.0 V, is 10−6 MHz.
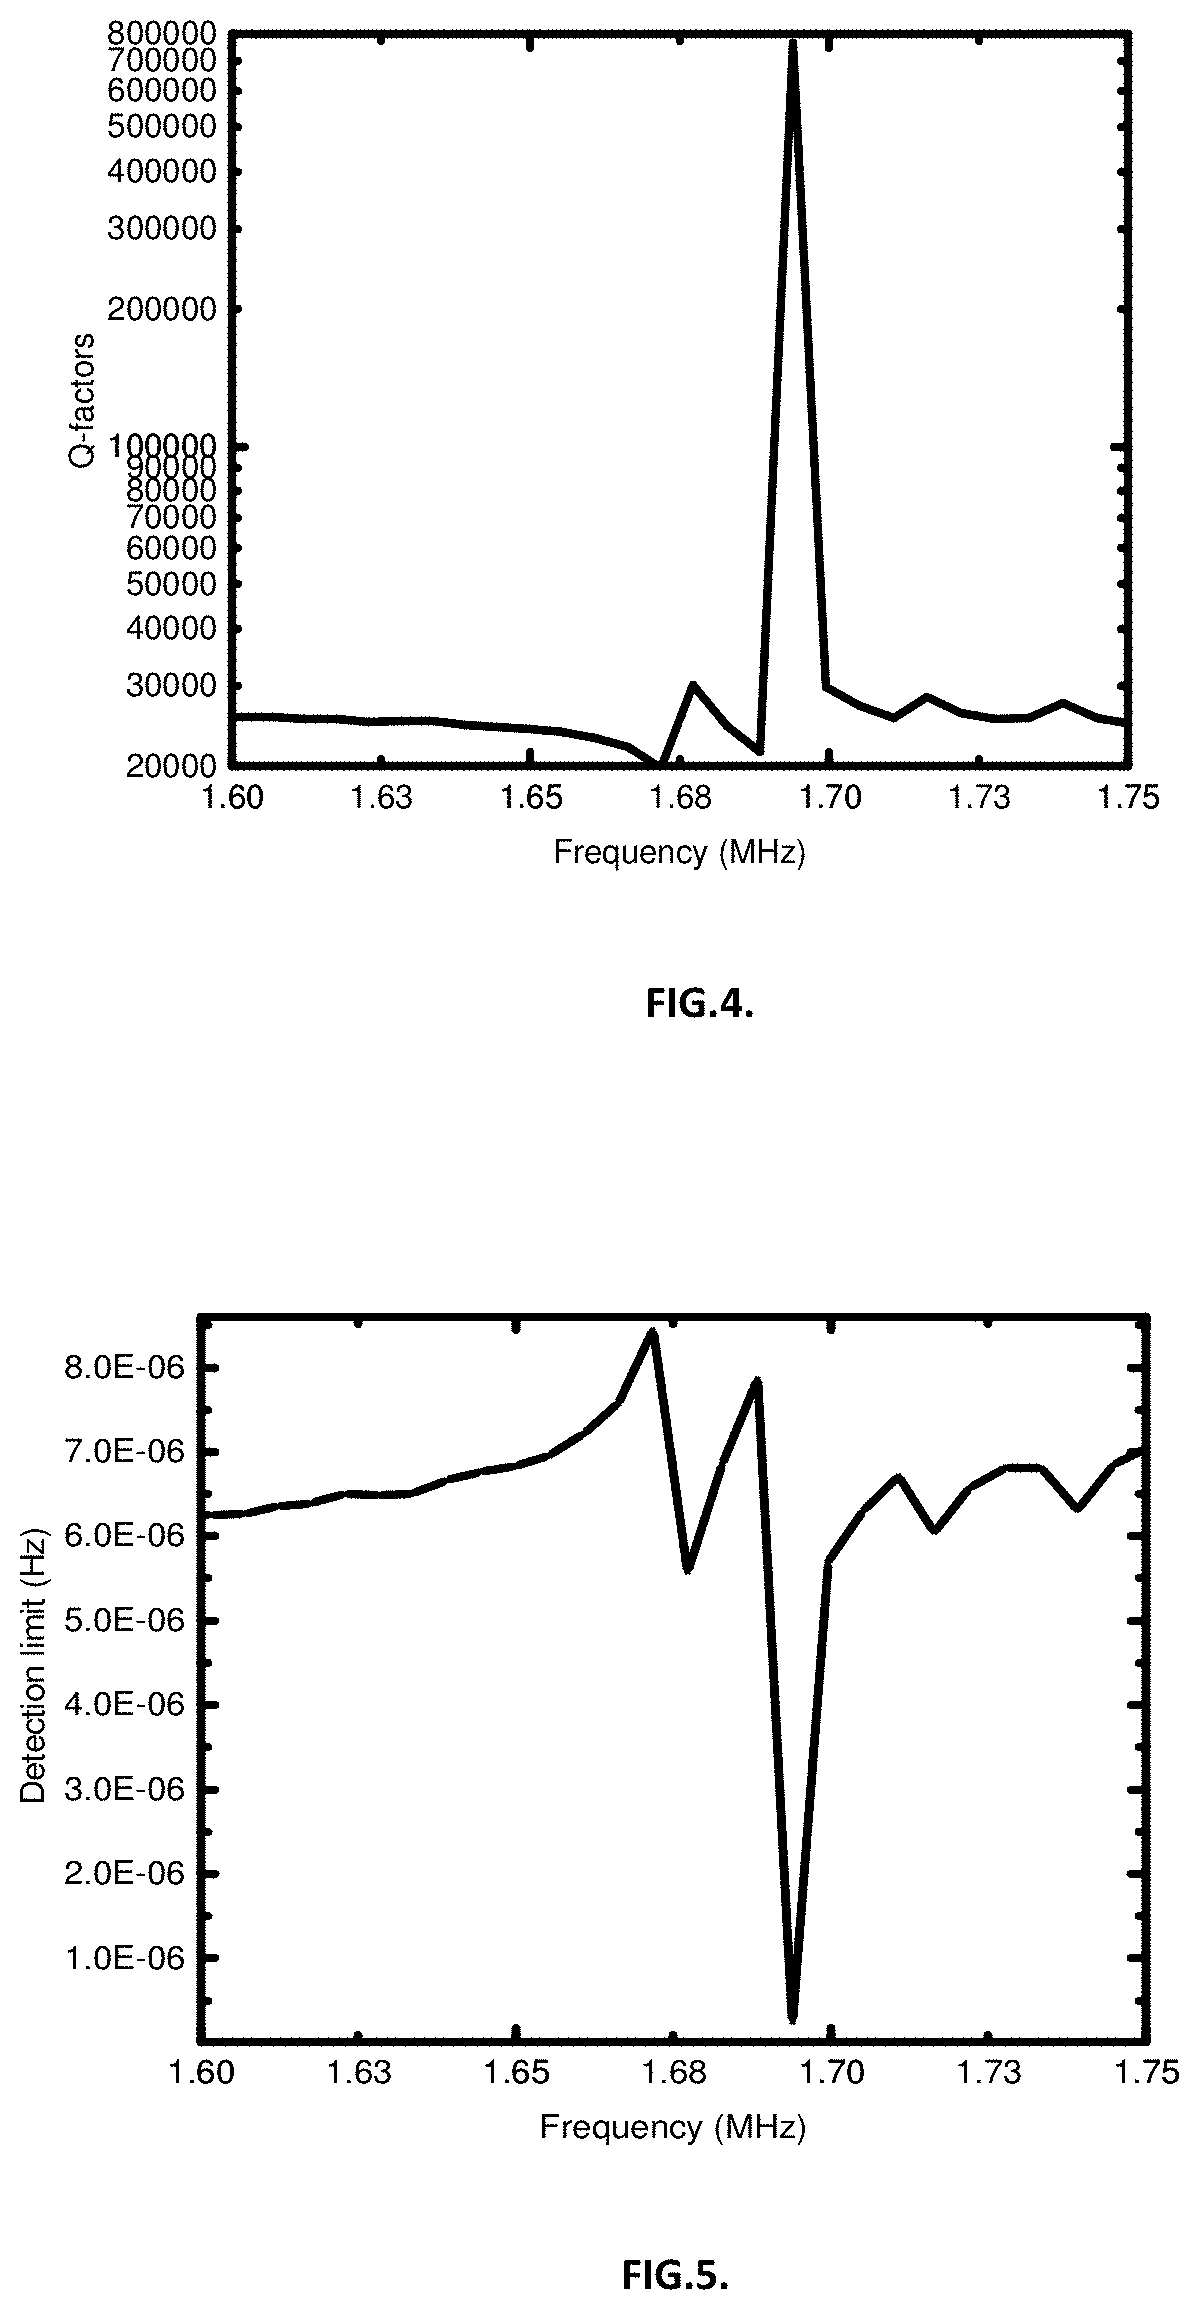
[0053]The Q-factors are then measured as a function of frequencies from 1.60 to 1.75 MHz at 10.0V. The highest Q-factor is 765682 at 1.697 MHz, and the lowest Q-factors are around 30,000 at both 1.68 MHz and 1.73 MHz, as shown in FIG. 4. The Q-factors and frequencies are t...
PUM
| Property | Measurement | Unit |
|---|---|---|
| frequency | aaaaa | aaaaa |
| mass | aaaaa | aaaaa |
| mass | aaaaa | aaaaa |
Abstract
Description
Claims
Application Information
 - R&D
- Intellectual Property
- Life Sciences
- Materials
- Tech Scout
- Unparalleled Data Quality
- Higher Quality Content
- 60% Fewer Hallucinations
Browse by: Latest US Patents, China's latest patents, Technical Efficacy Thesaurus, Application Domain, Technology Topic, Popular Technical Reports.
© 2025 PatSnap. All rights reserved.Legal|Privacy policy|Modern Slavery Act Transparency Statement|Sitemap|About US| Contact US: help@patsnap.com