
Method for anticipating tipping point of traffic resilience based on percolation analysis

a traffic resilience and percolation analysis technology, applied in knowledge based models, instruments, computing, etc., can solve the problems of system deviating significantly from its original performance level, unable to understand and improve system resilience, and unable to meet the needs of traffic resilience research

Active Publication Date: 2019-11-21
BEIHANG UNIV
View PDF0 Cites 14 Cited by
  • Summary
  • Abstract
  • Description
  • Claims
  • Application Information

AI Technical Summary

Benefits of technology

The present invention is a method for anticipating the tipping point of traffic resilience based on percolation analysis. This method can help urban transportation administrators to evaluate and predict system performance transitions of urban traffic functional network, and provide early warning signals for urban traffic congestion. The method provides a real-time prediction indicator for the closeness of the traffic resilience to its tipping point, which can offer theoretical and technical guidance for traffic control, and help resolve hot issues in current research interests such as mitigating traffic congestion and building smart cities. The method is straightforward to apply and can be generalized for other critical infrastructure including power grid and airline networks.

Problems solved by technology

Since systems in the real world are often exposed to a complex and ever-changing environment, how to understand and improve the system resilience has become a hot issue in recent years.
However, studies on the resilience of engineering systems especially critical infrastructures are still rare.
Thus, for these complex engineering systems, it remains unclear yet what their resilience patterns are and how their resilience tipping points can be identified.
This violent phase change is likely to cause the system to deviate significantly from its original performance level and therefore lose its original functionality.
Although these indicators are widely used, they have the following limitations: first, conventional indicators rely on high-quality and long-term time series data to obtain accurate results; second, although the conventional indicators can measure the temporal evolution of the system performance, it cannot reveal the topological features embedded in the system, making it difficult to unveil the structural factors for system resilience.

Method used


Image

  • Method for anticipating tipping point of traffic resilience based on percolation analysis
  • Method for anticipating tipping point of traffic resilience based on percolation analysis

Examples


Embodiment Construction

[0039]In order to make the technical problems and technical solutions to be solved in the present invention more apparent, further description of the preferred embodiment of present invention is illustrated in detail below, combining with the flow chart of the method in the FIG. 1 of the present invention.

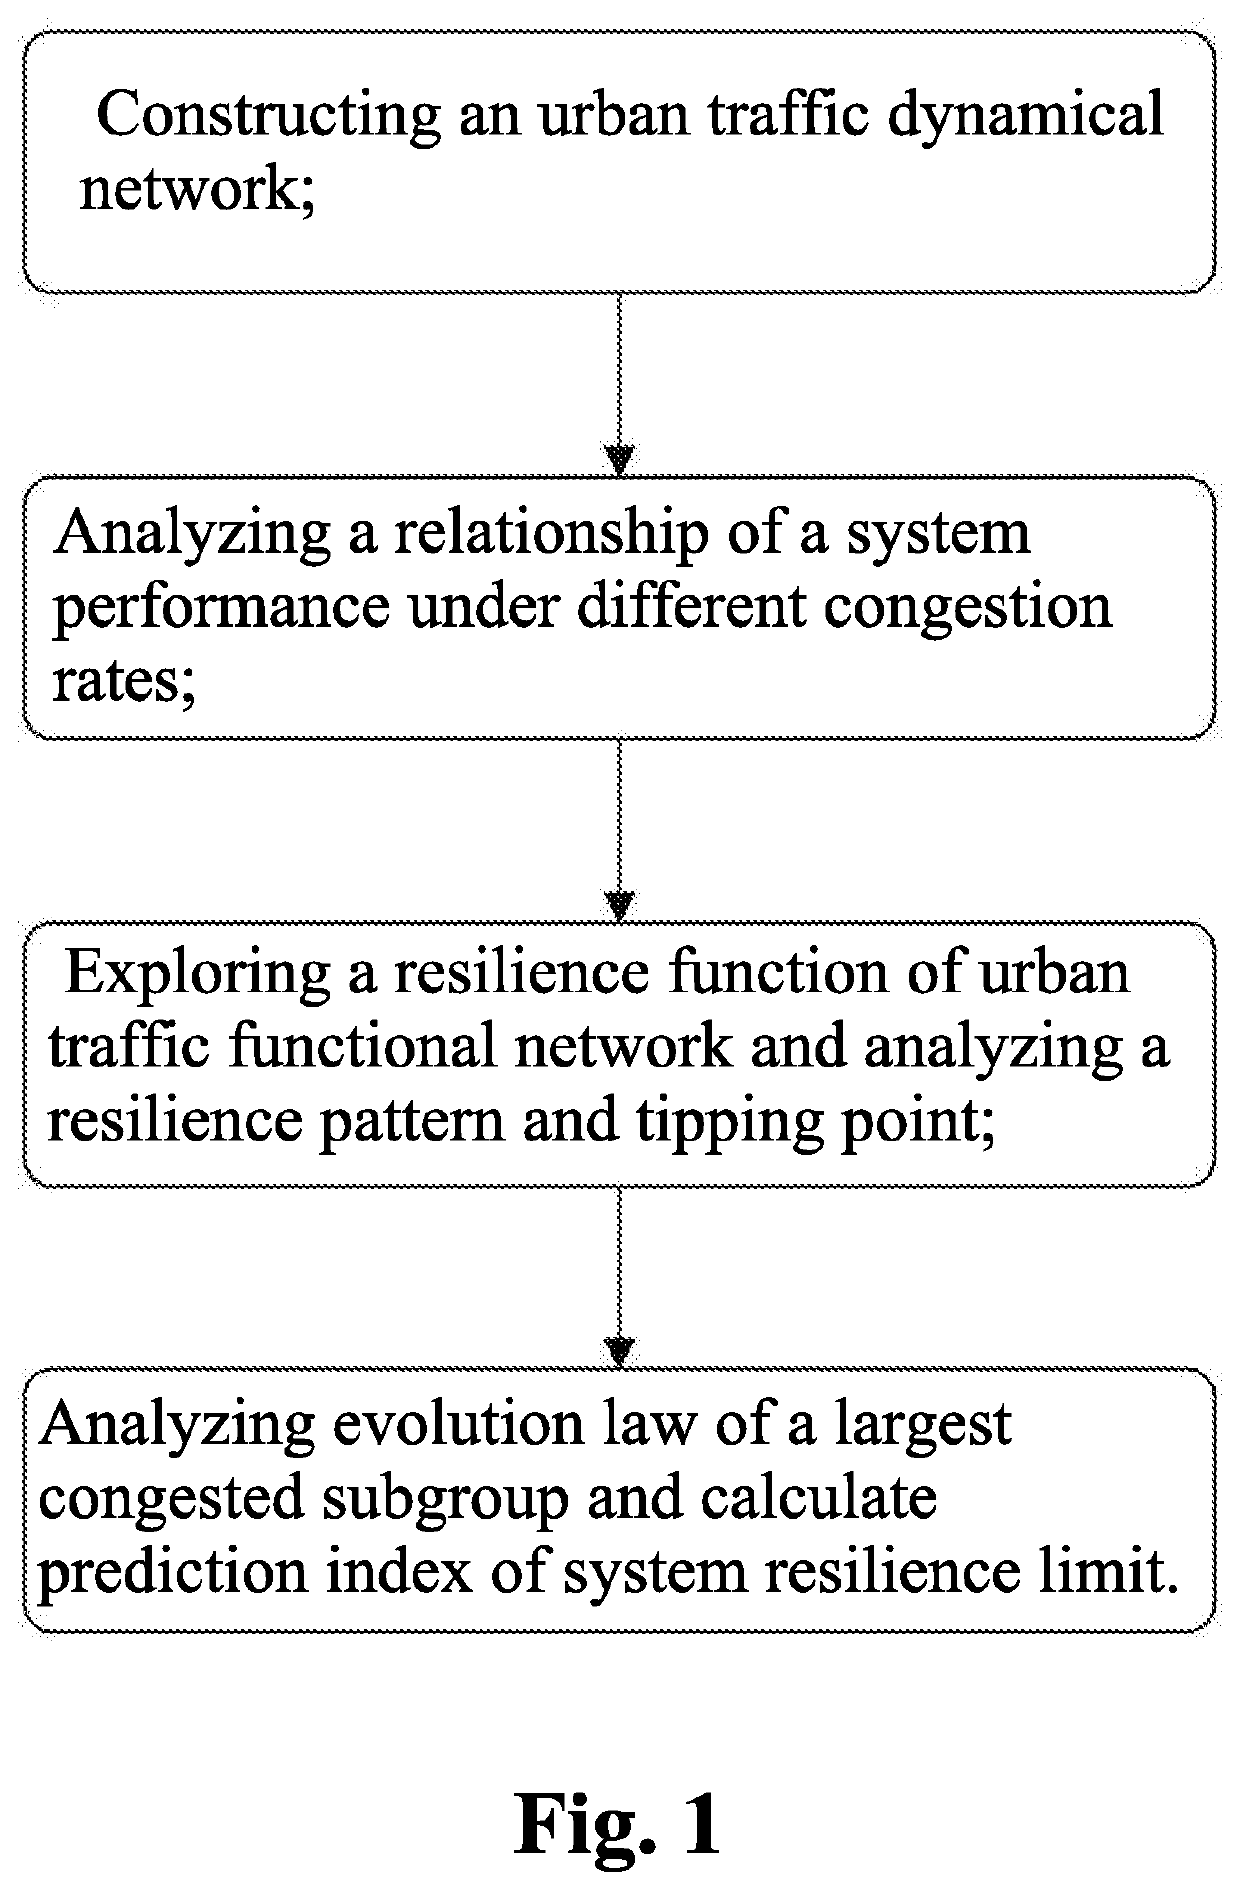
[0040]As shown in FIG. 1, the present invention provides a method for anticipating the tipping point of traffic resilience based on percolation analysis, which specifically comprises following steps of:

[0041]step (I): based on the topology structure of the urban road network and daily traffic operation data, constructing the urban traffic dynamical network;

[0042](1) in the present invention taking city A as an example and constructing a dynamical network with its daily velocity information; wherein the dynamical network contains over 50,000 edges and about 27,000 nodes, and covers a period of 17 working days in a month of a given year;

[0043](2) normalizing and registering the relat...


PUM


Abstract

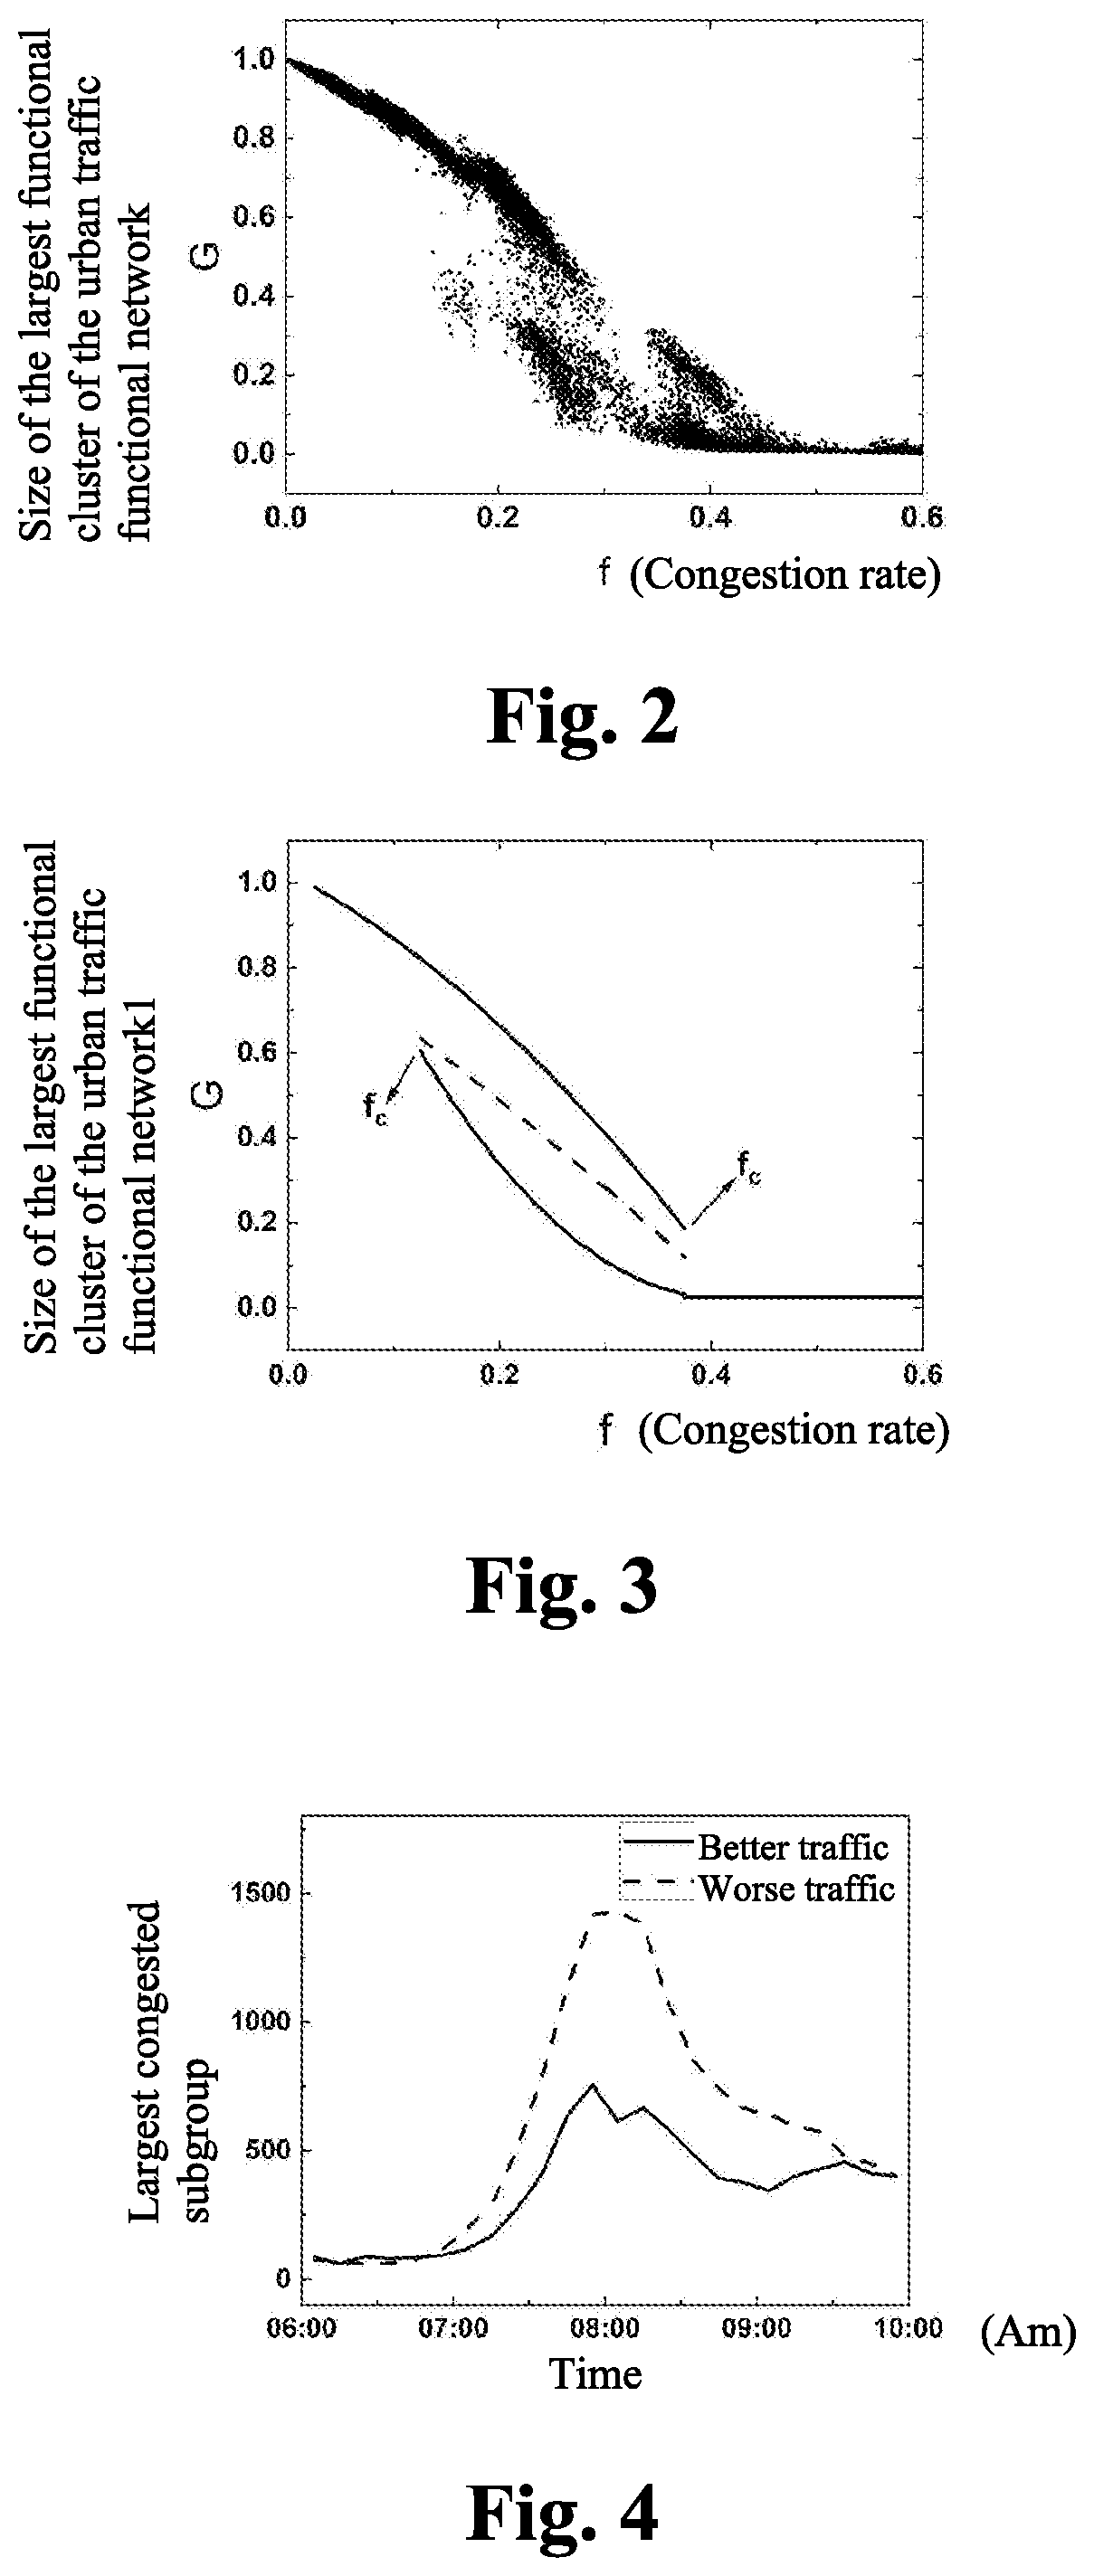
A method for anticipating the tipping point of traffic resilience based on percolation analysis, includes steps of: step (I) based on the topology structure of the urban road network and daily traffic operation data, constructing the urban traffic dynamical network; step (II): based on the urban traffic dynamical network constructed, analyzing the relationship between the system performance of urban traffic functional network and the congestion rate by percolation analysis; and step (III): based on the relationship between the system performance and the congestion rate, exploring the resilience function of the urban traffic functional network, and analyzing its resilience pattern and its resilience tipping point.

Description

CROSS REFERENCE OF RELATED APPLICATION[0001]The present application claims priority under 35 U.S.C. 119(a-d) to CN 201811084656.0, filed Sep. 18, 2018.BACKGROUND OF THE PRESENT INVENTIONField of Invention[0002]The present invention provides a method for anticipating the tipping point of traffic resilience based on percolation analysis, which relates to a method for anticipating the tipping point of traffic resilience and for simultaneously proposing a corresponding real-time prediction indicator based on percolation analysis, and belongs to the field of a multidiscipline of traffic reliability and network science.Description of Related Arts[0003]The operational reliability of urban transportation systems is an important branch newly emerged in the field of reliability, which mainly studies the ability of the transportation systems to meet certain traffic demands within specified time and under specified traffic conditions. With the introduction of the concept of “smart city”, many s...

Claims


Application Information

Patent Timeline
Patent Type & Authority Applications(United States)
IPC IPC(8): G08G1/01G06N5/02
CPCG06N5/02G08G1/0137G08G1/0125G06N5/01
Inventor LI, DAQINGZENG, GUANWEN
Owner BEIHANG UNIV
Learn More