
Detecting outlier prescription behavior using graphical models with latent variables

a graphical model and model technology, applied in the field of health care, can solve problems such as fraud and abuse in medical treatment activity, increase in healthcare expenses (and therefore health insurance costs), and association of health insurance cost with overall risk of healthcare expenses for the insured

Active Publication Date: 2016-09-15
IBM CORP
View PDF0 Cites 24 Cited by
  • Summary
  • Abstract
  • Description
  • Claims
  • Application Information

AI Technical Summary

Benefits of technology

The present invention describes a method, computer program product and system for analyzing healthcare data to predict the probability of prescription events. The system receives data on patient care events and presRIPTION events and uses a graphical model to estimate the relationships between these events. The system then uses a dynamic programming approach to compute a prescription score for a healthcare provider based on the predicted probability of prescription events. The technical effect of this invention is to provide a tool for healthcare providers to better predict the likelihood of presolin events and support them in making informed decisions.

Problems solved by technology

Typically, the cost (to the insured) of health insurance is associated with the overall risk of healthcare expenses for the insured.
An important factor known to lead to increases in healthcare expenses (and therefore health insurance costs) is fraud and abuse in medical treatment activity.
For example, fraudulent health insurance claims for medically unnecessary medical procedures and / or prescriptions increase the cost of covering healthcare expenses and therefore can lead to an increase in health insurance premiums (as well as significant health damages to those receiving the medically unnecessary medical procedures and / or prescriptions).

Method used


Image

  • Detecting outlier prescription behavior using graphical models with latent variables
  • Detecting outlier prescription behavior using graphical models with latent variables
  • Detecting outlier prescription behavior using graphical models with latent variables

Examples


example embodiment

II. EXAMPLE EMBODIMENT

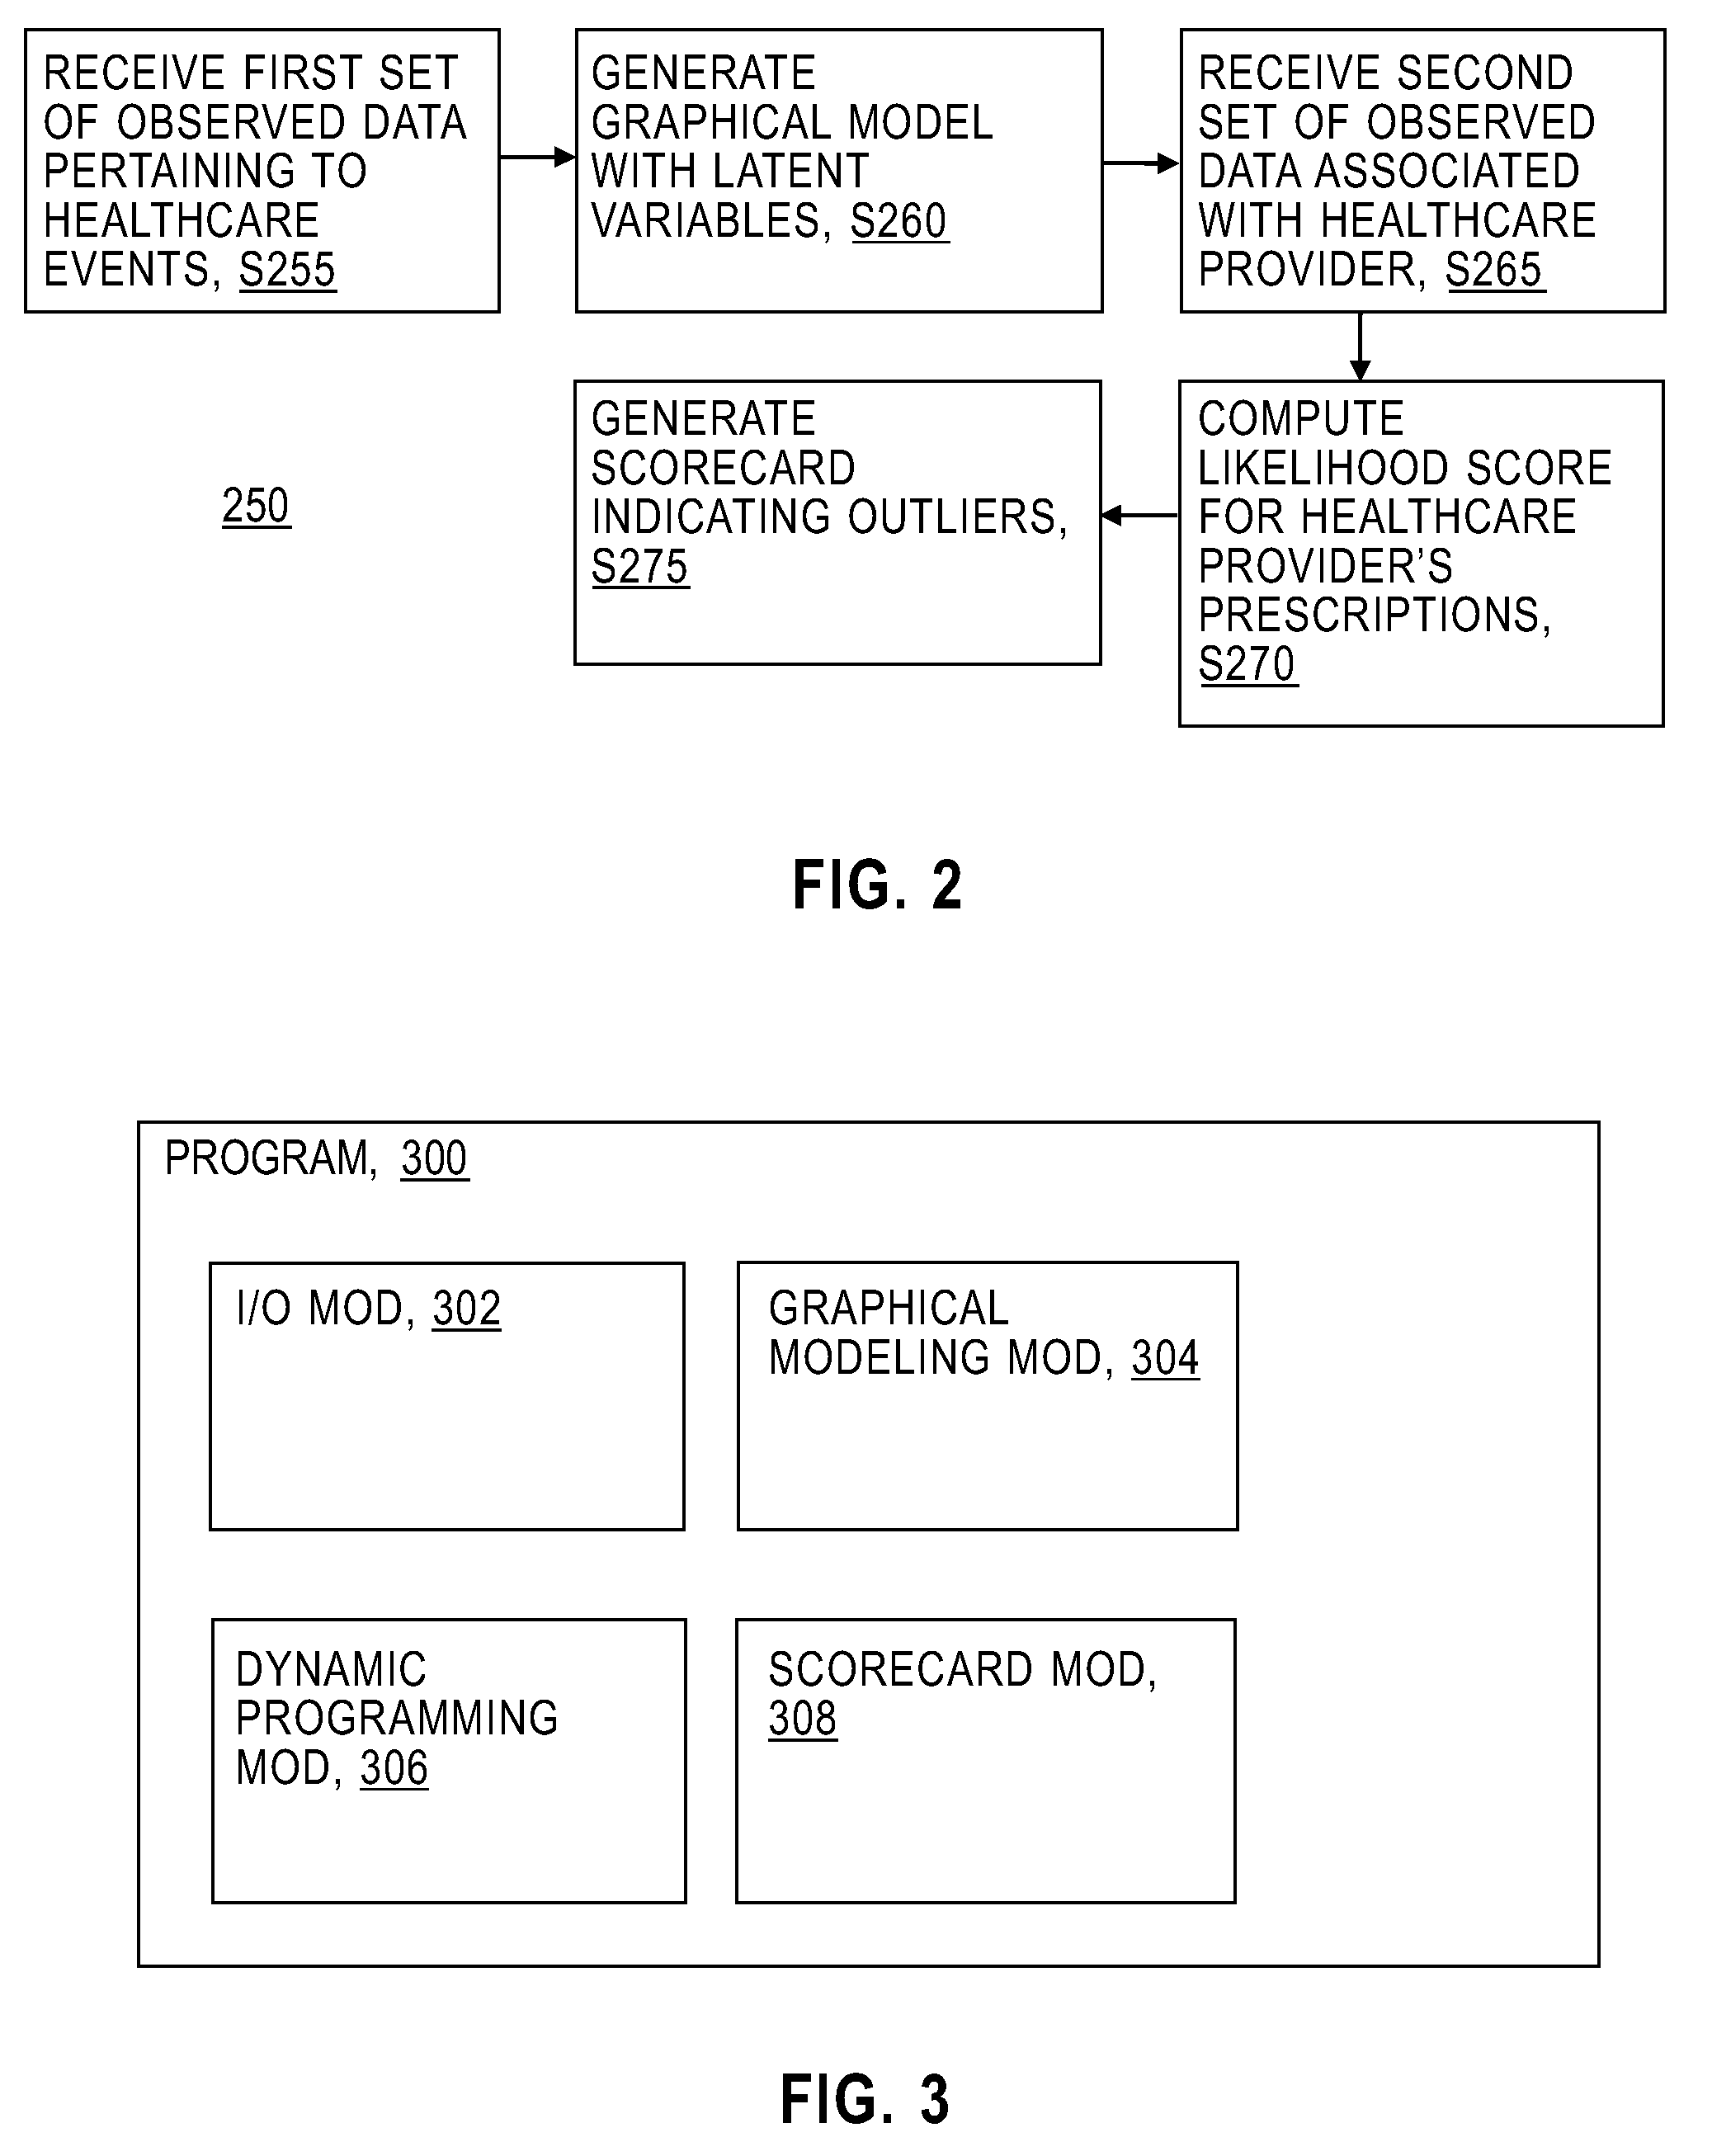
[0041]FIG. 2 shows flowchart 250 depicting a method according to the present invention. FIG. 3 shows program 300 for performing at least some of the method steps of flowchart 250. This method and associated software will now be discussed, over the course of the following paragraphs, with extensive reference to FIG. 2 (for the method step blocks) and FIG. 3 (for the software blocks).

[0042]The following paragraphs refer extensively to an example embodiment according to the present invention. As used herein in this sub-section, any discussion of the “present embodiment,” the “example embodiment,” the “present example,” or the like is meant to refer to this first example embodiment (as opposed to a second example embodiment discussed in the Further Comments and / or Embodiments sub-section of this Detailed Description). Generally speaking, a purpose of the method discussed below is to generate a model for prescription activity and use that model to detect outlier beh...


PUM


Abstract

Software that performs the following steps: (i) receiving a first set of observed data pertaining to healthcare events, the first set of observed data including a subset of patient care event data pertaining to patient care events and a subset of prescription data pertaining to prescription events; (ii) generating a graphical model representing a probabilistic relationship between the patient care event data and the prescription data, the graphical model including a set of latent variable(s) estimated from the first set of observed data using an expectation maximization method; (iii) receiving a second set of observed data pertaining to healthcare events associated with a healthcare provider; and (iv) computing, using a dynamic programming approach, a first prescription score for the healthcare provider relating to a computed probability under the generated graphical model of at least one prescription event of the second set of observed data.

Description

STATEMENT ON PRIOR DISCLOSURES BY AN INVENTOR[0001]The following disclosure(s) are submitted under 35 U.S.C. 102(b)(1)(A) as prior disclosures by, or on behalf of, a sole inventor of the present application or a joint inventor of the present application:[0002](i) “Graphical Models for Identifying Fraud and Waste in Healthcare Claims”, Peder A. Olsen, Ramesh Natarajan, and Sholom M. Weiss, SIAM International Conference on DATA MINING, Philadelphia, Pa., April 2014.BACKGROUND OF THE INVENTION[0003]The present invention relates generally to the field of healthcare, and more particularly to detecting fraud and / or abuse in medical treatment activity.[0004]Health care (or “healthcare”) is widely and generally known as the diagnosis, treatment, and prevention of physical and mental impairments in human beings. Likewise, health insurance (or “healthcare insurance”) is insurance against the risk of incurring healthcare expenses. Typically, the cost (to the insured) of health insurance is ass...

Claims


Application Information

Patent Timeline
Patent Type & Authority Applications(United States)
IPC IPC(8): G06F19/00G06N7/00G06Q10/06G06N20/00G16H20/10G16H50/50G16H70/40G16Z99/00
CPCG06F19/322G06Q50/22G06N7/005G06Q10/0635G16H10/60G06N20/00Y02A90/10G16H70/40G16H20/10G16H50/50G16Z99/00G06N7/01
Inventor NATARAJAN, RAMESHOLSEN, PEDER A.WEISS, SHOLOM M.
Owner IBM CORP
Learn More