
Methods and Workflows for Selecting Genetic Markers Utilizing Software Tool

a software tool and workflow technology, applied in the field of methods and workflows for selecting genetic markers utilizing software tools, can solve the problems of not all candidate polymorphisms are suitable for selection as markers in genetic studies and for the development of genotyping assays, and the genome may lack a sufficient number of validated snps, so as to facilitate the selection of snps and facilitate the tagging of snps

Inactive Publication Date: 2016-08-04
APPL BIOSYSTEMS INC
View PDF0 Cites 0 Cited by
  • Summary
  • Abstract
  • Description
  • Claims
  • Application Information

AI Technical Summary

Benefits of technology

[0006]The increased availability of validated SNPs whose allele frequency has been previously determined in reference samples from major populations helps alleviate some of these problems. More than two years ago, Applied Biosystems set out to validate more than 250,000 gene-centric SNPs, with the goal of creating a resource for candidate-gene, and candidate-region, genetic-association studies. The result was the release of TaqMan® Assays-on-Demand™ SNP Genotyping Products (now known as TaqMan® Validated SNP Genotyping Assays), comprising more than 150,000 assays with allele frequency information determined from African-American, Caucasian, Chinese, and Japanese individuals. These validated, ready-to-use-assays help ensure that studies using markers selected for genes or regions of interest will be successful.
[0007]More recently, the HapMap project has been funded to genotype more than one million SNPs distributed across the entire genome in four reference populations. Together these resources provide researchers with a large selection of validated SNPs for association mapping studies. For SNPs not included in the Applied Biosystems collection of validated assays, custom assays can be ordered through the Applied Biosystems Custom TaqMan® SNP Genotyping Service (previously TaqMan® Assay-by-Design® Service). Furthermore, researchers can select from a growing list of TaqMan Pre-Designed SNP Genotyping Assays, which have been computationally pre-screened for repeats and assembly artifacts, adjacent SNPs, and for the uniqueness of their amplicons (and in the case of Human SNPs, are functionally tested at manufacturing), to improve the probability of assay success. The latter set of assays is particularly useful for regions or genes not fully covered by the validated assay collection, or when higher density of markers is desirable.
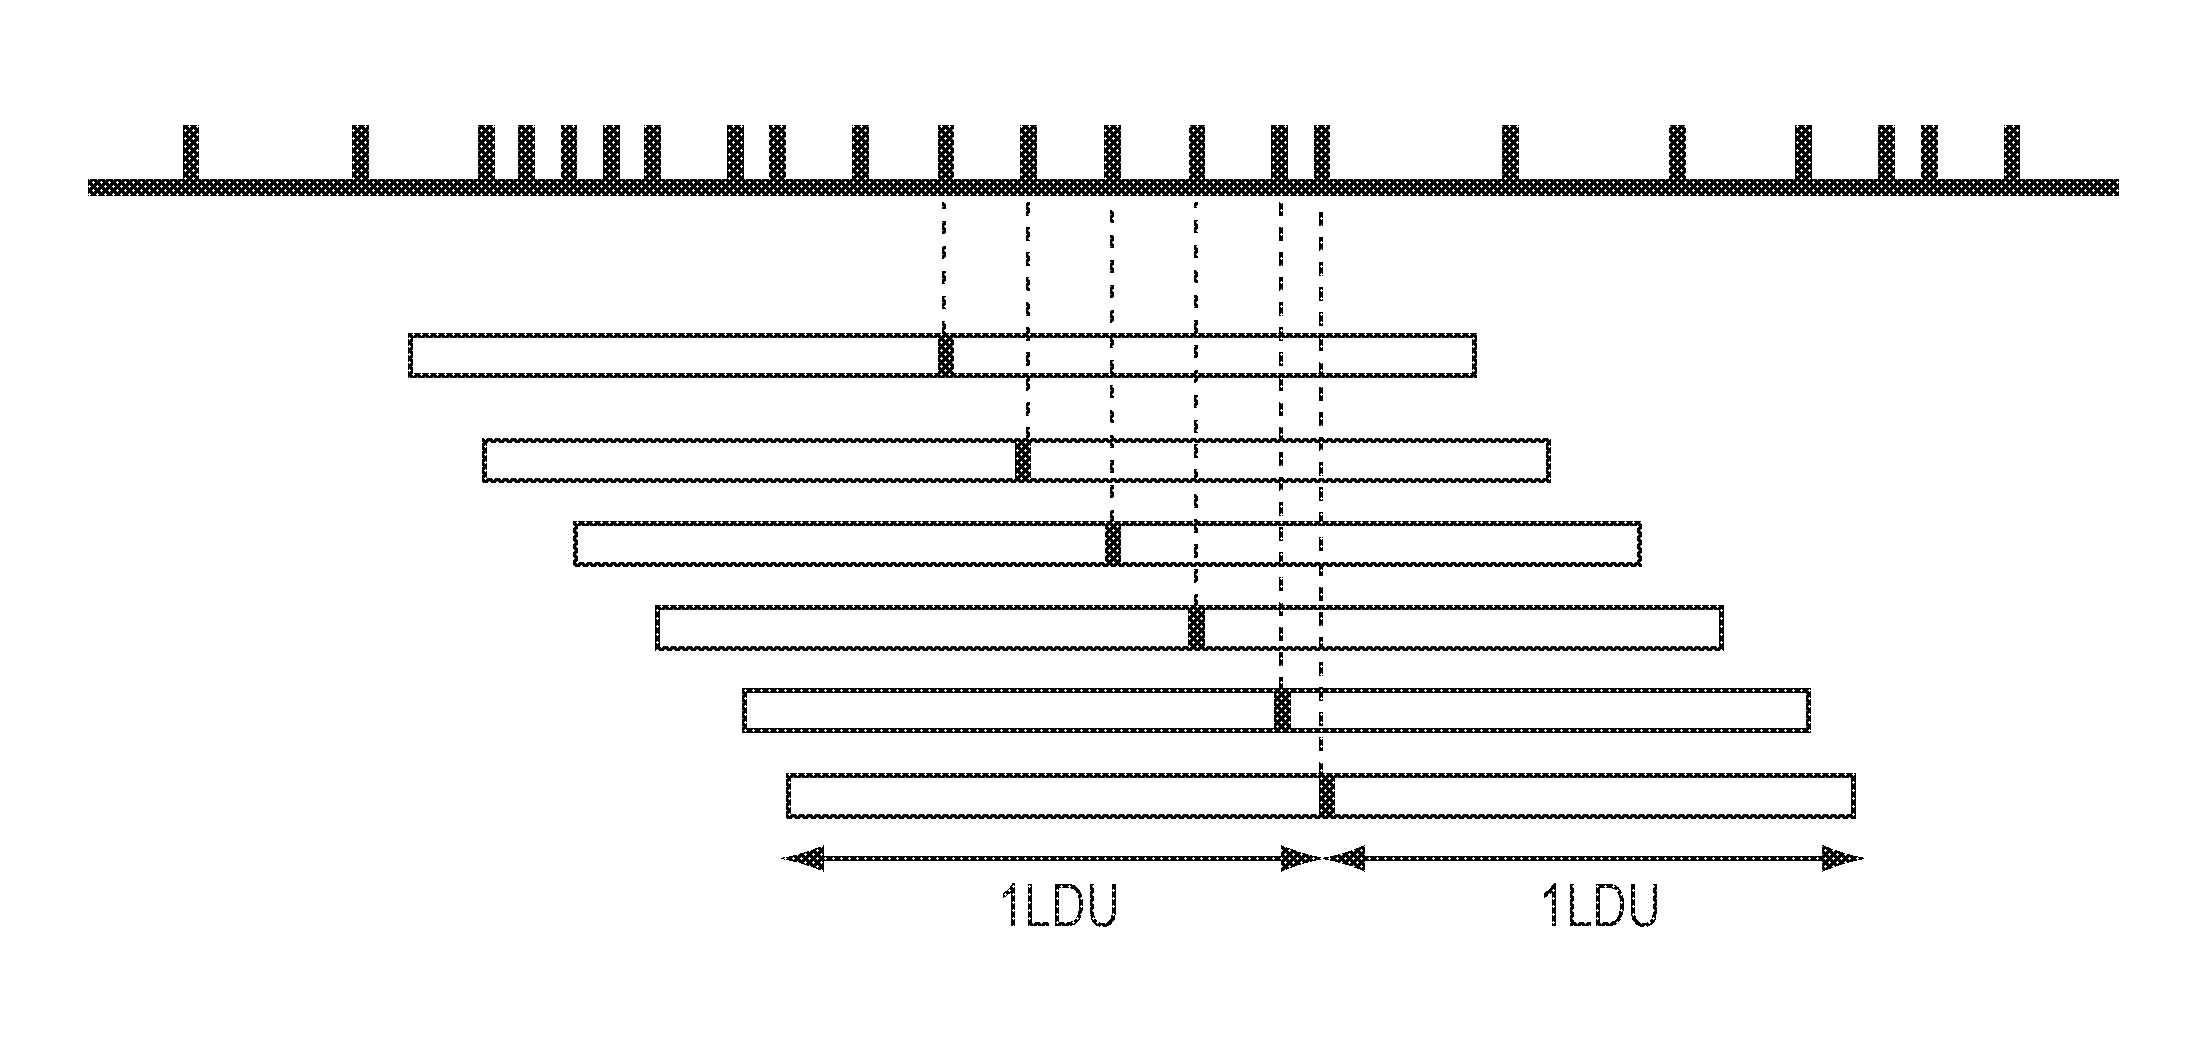
[0010]As a result, another method of marker selection based on the observed empirical patterns of LD and analogous to the genetic recombination maps used for marker selection in linkage studies has been proposed. This method consists in a metric LD map that places SNPs in locations proportional to the extent of LD between adjacent markers and provides an intuitive means of spacing markers evenly across regions of interest. It also enables the detection of regions where, because of recombination, LD breaks down faster requiring additional markers. Furthermore, reports of blocks of high LD with limited haplotype diversity suggest that selecting a subset of SNPs with the ability to “tag” common haplotypes in a region (so-called “tagging” SNPs) could be a suitable strategy for selecting markers in these regions. A number of metrics to evaluate the correlation of the SNPs in a region of high LD aimed to select tagging SNPs have been suggested and an efficient, scalable algorithm framework to perform optimal selection of tagging SNPs with large datasets is now available.
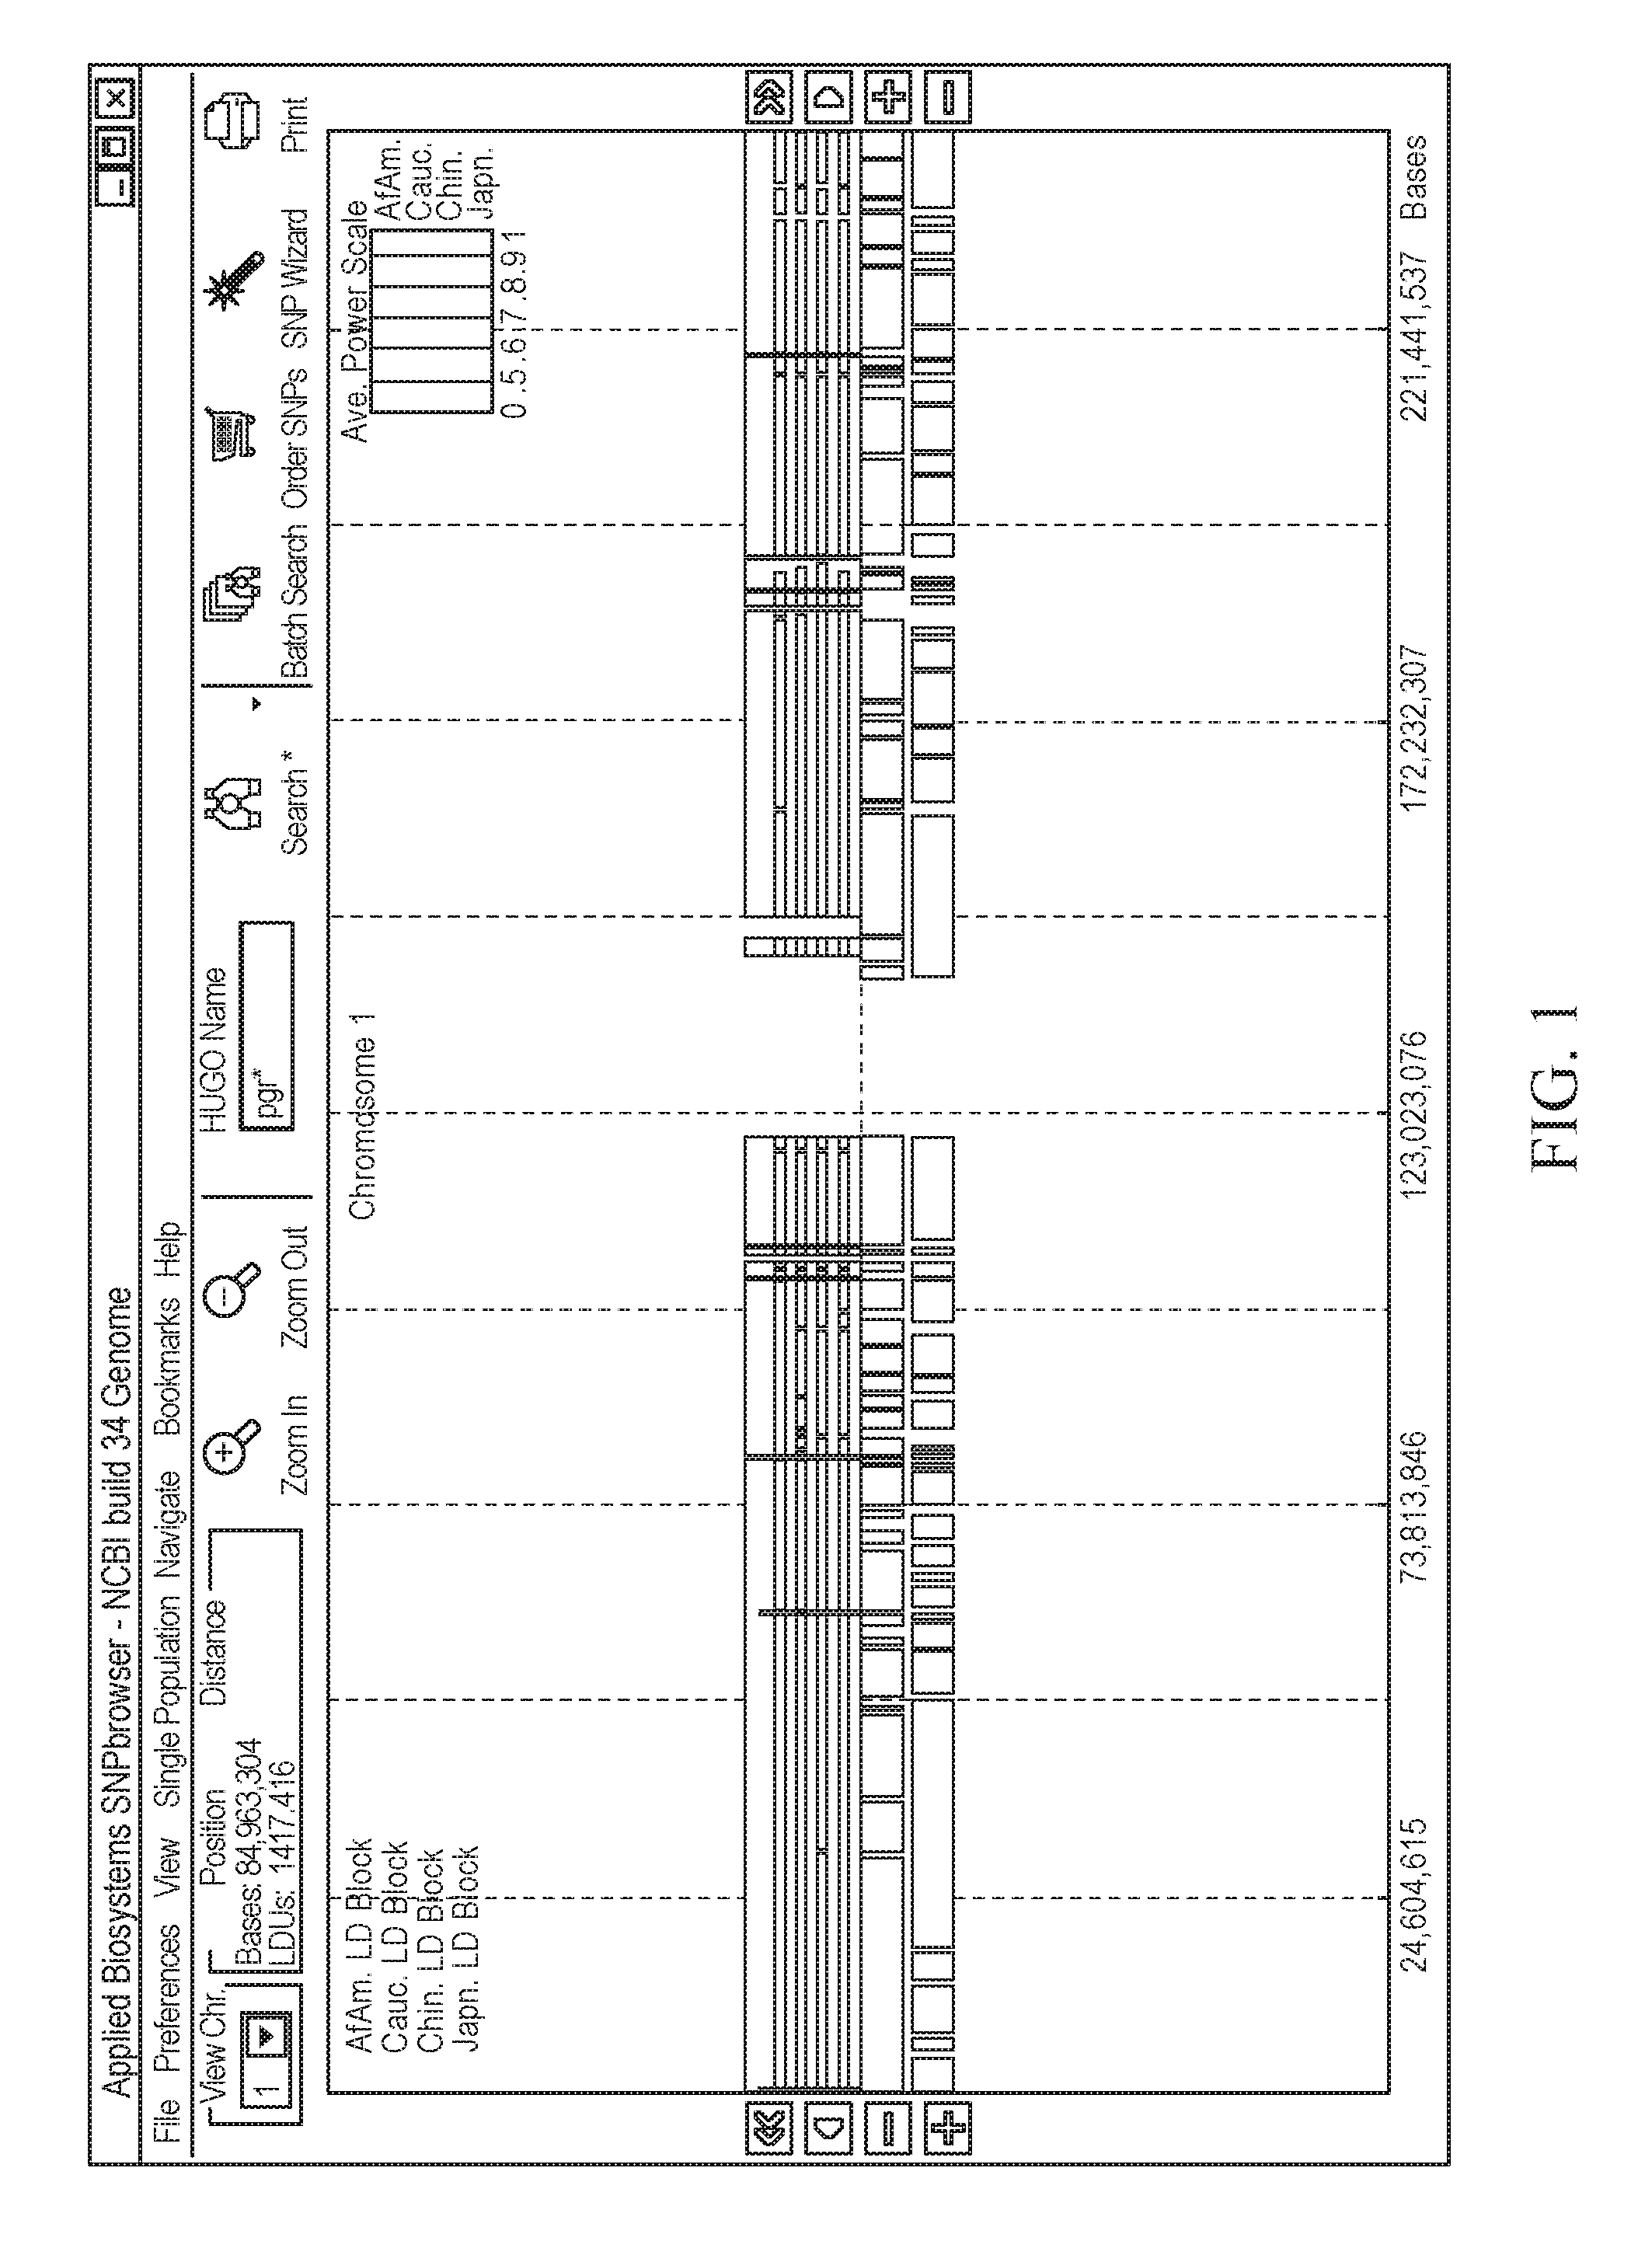
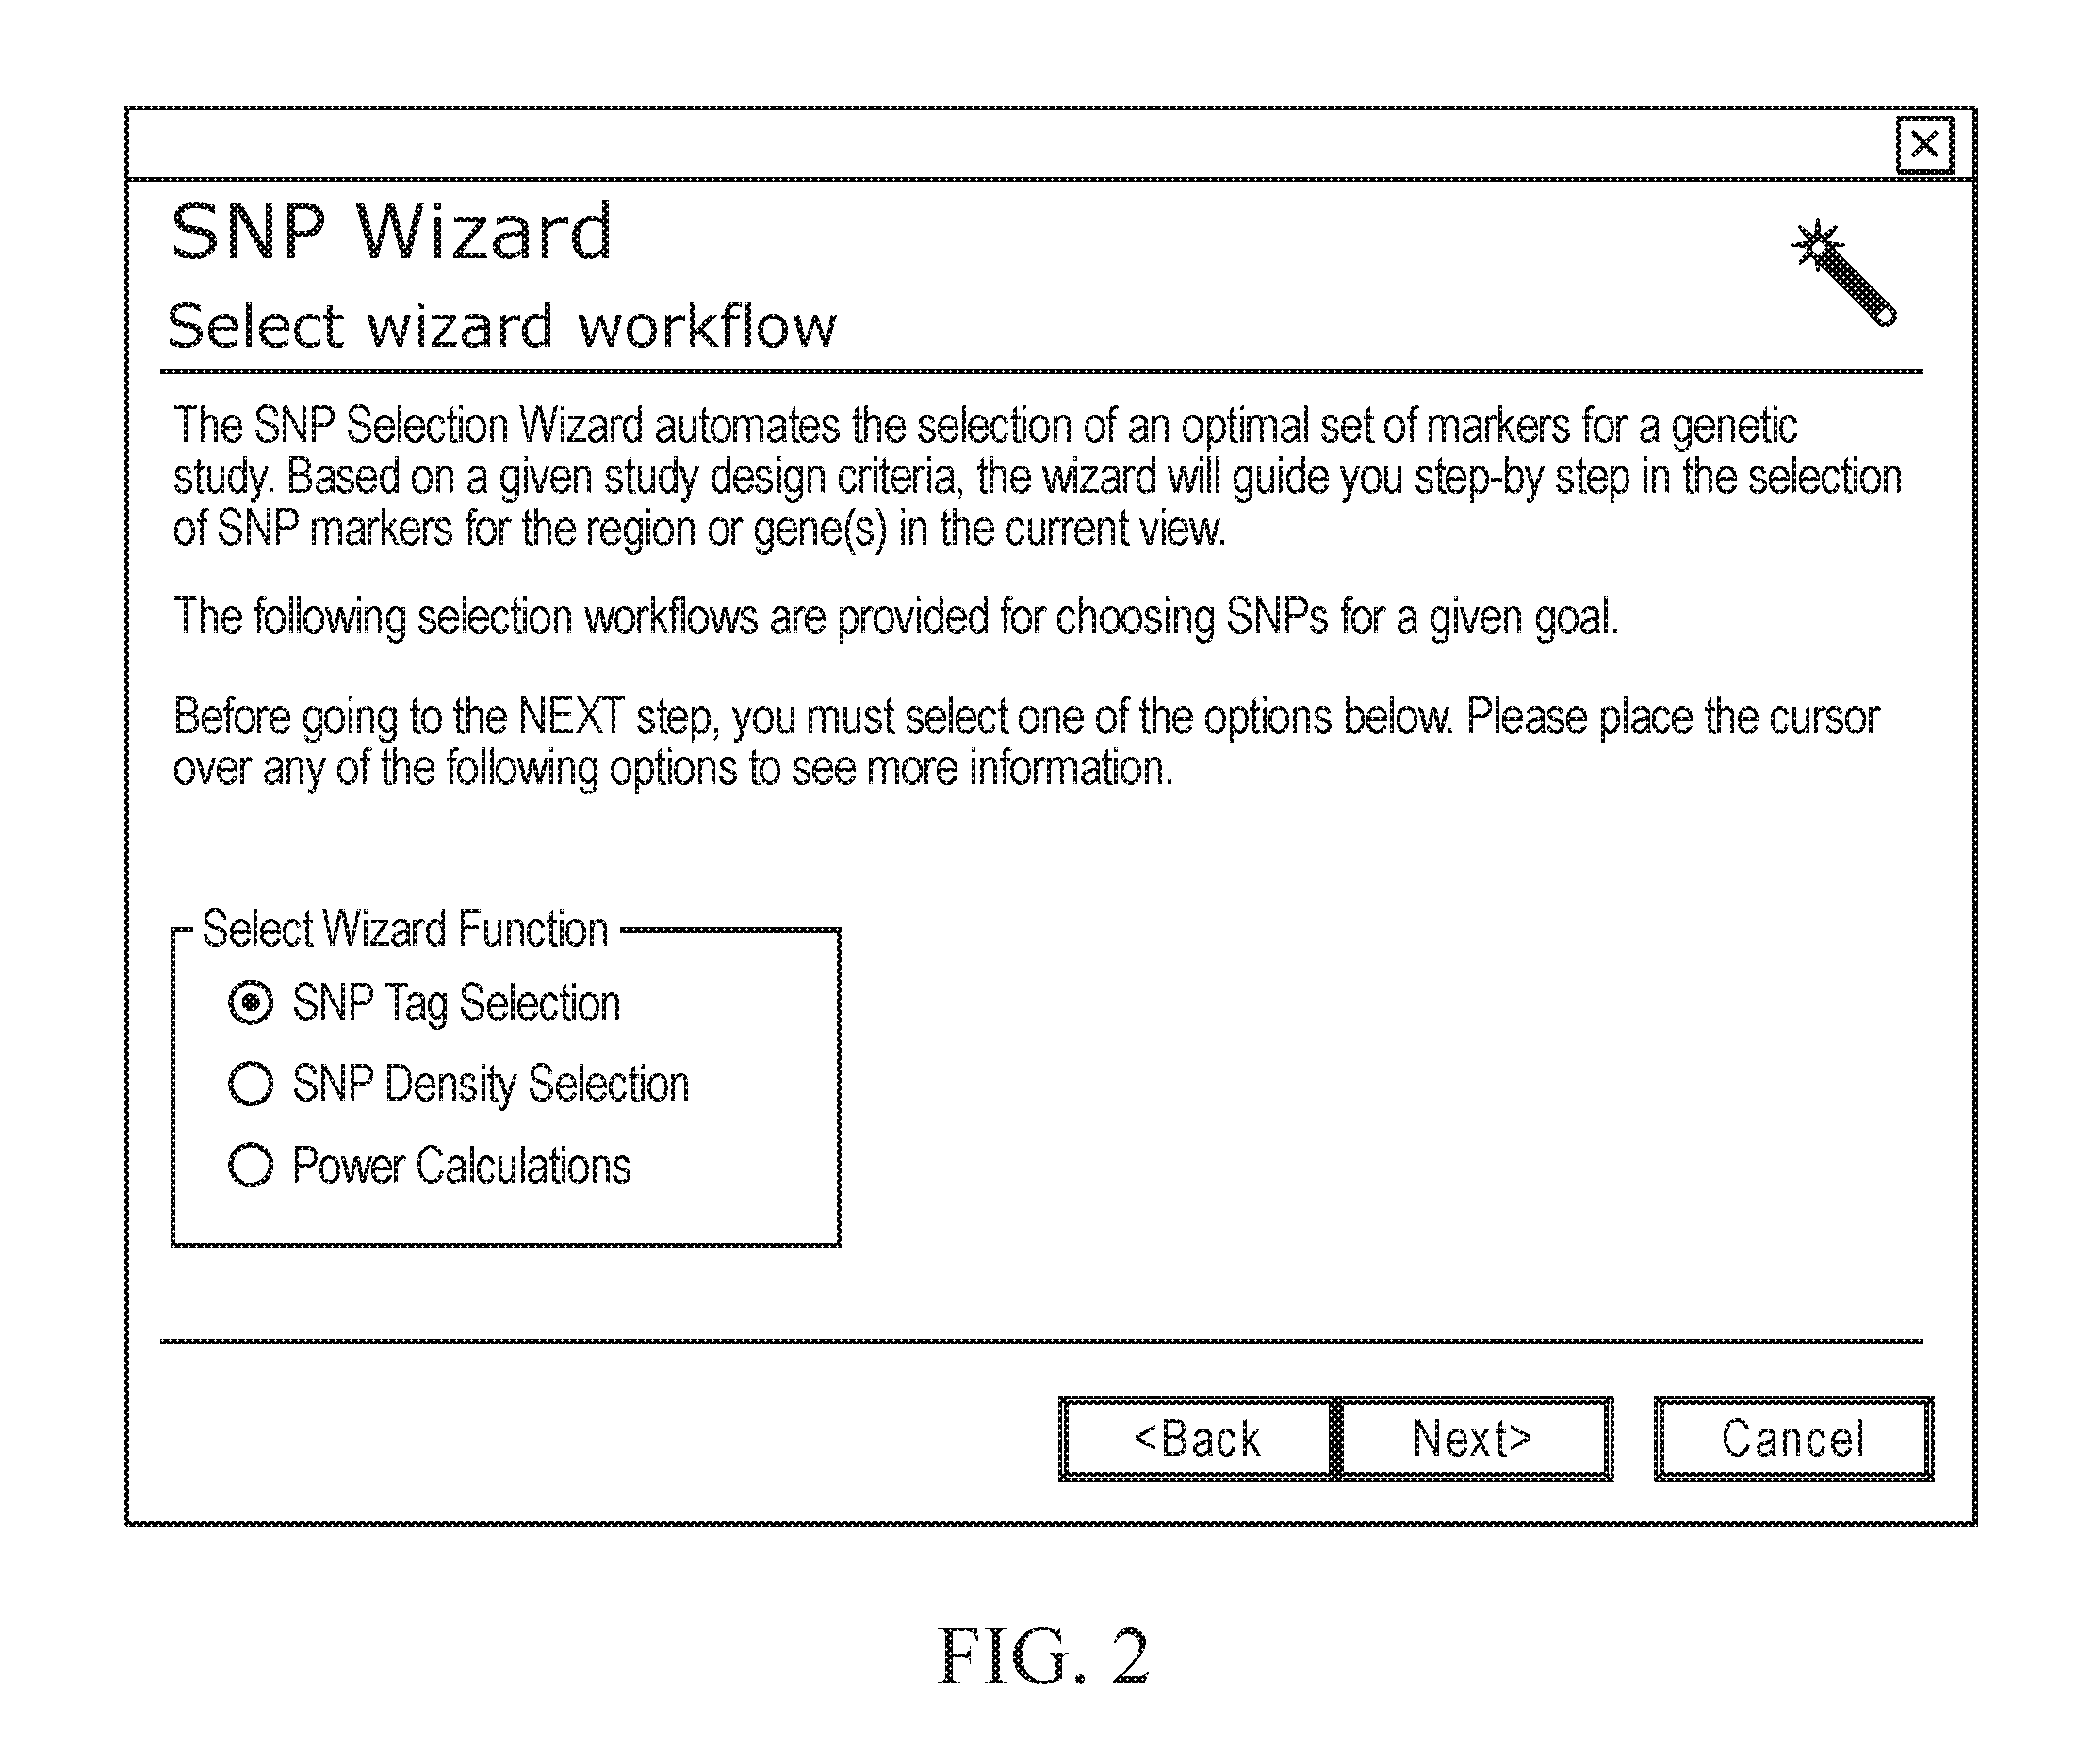
[0013]To address these and other practical concerns in selecting SNPs for genotyping experiments, we have developed a set of methods and workflows for selecting genetic markers using a visual tool. In one embodiment, the visual tool to facilitate selecting SNPs for genotyping experiments comprises a first memory containing a datastore of pre-calculated linkage disequilibrium map information; a second memory containing a datastore of haplotype block information; and a third memory containing at least one set of tagging SNPs. A graphical user interface provides visualization of SNPs, integrated with a physical genome map. A stepwise selection tool associated with the graphical user interface facilitates selection of tagging SNPs by selectively using the information in at least one of the first, second and third memories. These and other features of the present teachings are set forth herein.

Problems solved by technology

Although SNPs are abundant in the human genome, and large databases of candidate SNPs are available for selecting markers across the genome, not all candidate polymorphisms are suitable for selection as markers in genetic studies and for the development of genotyping assays.
It has been reported several times in the literature that typically only 50% of SNPs selected at random from dbSNP yield working assays, which results in significant delays and expense.
However, some areas of the genome may lack a sufficient number of validated SNPs for which the allele frequency in a reference sample has been established.
Analysis of the 40 million genotypes collected during the validation process, however, as well as reports by others, has shown that LD between SNPs varies tremendously across the genome, suggesting that a SNP selection process based exclusively on physical distance between the markers is not optimal.
When selecting SNPs for a study, integrating all the criteria described above can be challenging, even with the current availability of larger number of validated SNPs and empirical LD data.
Thus, from a practical standpoint, selecting the most suitable set of SNPs to allow genetic research to proceed in an efficient, cost-effective manner can be overwhelming.
Once a set of SNPs is selected, researchers have heretofore lacked a rapid way to obtain reliable, predictable assays for multiple SNPs that work together under the same experimental conditions.

Method used


Image

  • Methods and Workflows for Selecting Genetic Markers Utilizing Software Tool
  • Methods and Workflows for Selecting Genetic Markers Utilizing Software Tool
  • Methods and Workflows for Selecting Genetic Markers Utilizing Software Tool

Examples


an example

[0211]The process for selecting the minimal number of SNPs for an association study is described in FIGS. 25-25, and the results can be found in Table 2. The study involves the LIM gene from the Caucasian population sample region in FIG. 25 (chromosome 4; 95,582,389-96-96,059,640 bp). The work-flow demonstrates how SNPbrowser Software and the tSNP wizard (FIG. 26) combine the density selection process with tSNP selection to determine the best method. Table 2 shows the number of SNPs required to tag the LIM gene, as defined by the haplotype R2 and pairwise r2 methods, at a variety of thresholds (85%, 95% and 99%).

TABLE 2Results for Six Possible ChoicesHaplotype R2Pairwise r2TotalGenotypes / 1,000TotalGenotypes / 1,000SNPsSamples*SNPssamplesNo selection 30**30,000100%  30**30,000100% 0.99 r21414,10047%2323,23077%0.95 r21313,65045%1919,95067%0.85 r2 910,62035%1314,34048%**Although 32 SNPs are present, two have no measured minor allele frequency in Caucasians; therefore, they are not consid...


PUM


Abstract

A visual tool facilitates selecting SNPs for genotyping experiments comprises a first memory containing a datastore of pre-calculated linkage disequilibrium map information; a second memory containing a datastore of haplotype block information; and a third memory containing at least one set of tagging SNPs. A graphical user interface provides visualization of SNPs, integrated with a physical genome map. A stepwise selection tool associated with the graphical user interface facilitates selection of tagging SNPs by selectively using the information in at least one of the first, second and third memories.

Description

CROSS REFERENCE TO RELATED APPLICATIONS[0001]This application is a continuation of patent application Ser. No. 12 / 547,122 filed Aug. 25, 2009, which is a continuation of patent application Ser. No. 11 / 181,591 filed Jul. 14, 2005, Abandoned, which is a continuation-in-part of patent application Ser. No. 10 / 833,000 filed Apr. 28, 2004, Abandoned, which claims the benefit of U.S. Provisional Application No. 60 / 466,310 filed Apr. 28, 2003.[0002]Patent application Ser. No. 11 / 181,591 filed Jul. 14, 2005 claims the benefit of U.S. Provisional Patent application Ser. No. 60 / 588,274, entitled “Tagging SNP Methods and LD-Guided Selection of Markers for Association Studies, filed Jul. 14, 2004. Patent application Ser. No. 11 / 181,591 further claims the benefit of U.S. Provisional Patent application Ser. No. 60 / 619,145, entitled “Methods and Workflows for Selecting Genetic Markers,” filed Oct. 15, 2004.[0003]The disclosures of all aforesaid related applications and provisional applications are ...

Claims


Application Information

Patent Timeline
Patent Type & Authority Applications(United States)
IPC IPC(8): G06F3/0484G06F19/22G06F3/0482G06F19/26G16B20/20G16B20/40G16B45/00
CPCG06F19/18G06F19/26G06F19/22G06F3/04842G06F3/0482G16B20/00G16B30/00G16B45/00G16B20/20G16B20/40
Inventor DE LA VEGA, FRANCISCOISAAC, HADAR
Owner APPL BIOSYSTEMS INC
Learn More