
Measurement of particle charge

a particle charge and charge technology, applied in the direction of measuring devices, material analysis through electric/magnetic means, instruments, etc., can solve the problems of complex algorithms applied to calculate particle size and charge, inability to separate similarly sized populations based on surface charge, and significant erroneous answers, etc., to achieve accurate measurement of the surface charge of objects

Active Publication Date: 2016-08-04
IZON SCIENCE
View PDF0 Cites 3 Cited by
  • Summary
  • Abstract
  • Description
  • Claims
  • Application Information

AI Technical Summary

Benefits of technology

[0002]The surface charge of objects in the nanometre and micron range is a key factor in their stability and general reactivity. Surface charge and changes in surface charge can also be used to detect and quantify the presence of specific targets in a sample. The ability to accurate

Problems solved by technology

However, the present inventors have appreciated that there are limitations to this approach.
Separating similarly sized populations based on surface charge is therefore not possible; neither is identification of a subtle shift in surface charge of a group of particles, which could be used as a diagnostic measurement.
A further limitation of DLS analysis, as appreciated by the present inventors, is that the average size distribution of a mixed population of particles is artificially skewed towards the larger particles, which scatter so much light that they can obscure smaller particles.
The present inventors have appreciated that limitations of NTA include the fact that a relatively small number of particles are analysed, and that it is possible to measure the same particle several times. Further, complex algorithms are applied to calculate the particle size and charge, and if the input settings are incorrect or not known the answer can be significantly erroneous.
As appreciated by the present inventors, the main limitations of these methods are that they are ensemble methods (not particle by particle), and that they are time-consuming as they require the adjusting of many parameters and many measurements.
Additionally, with the pressure-sweep method in particular, the, duration of the measurement and the reversal of the fluid flow greatly increase the chance of a particle partially blocking the sensing zone.
The present inventors have appreciated that this method has the disadvantage that the geometry and zeta potential of the sensing pore must be precisely known, must be invariant during analysis, and able to be modelled.
This is commercially impractical.
Simple application of the conical model described by Kozak et al. as an approximation is also impractical as this requires that the actual size in nanometres of the pore entry and exit must be

Method used


Image

  • Measurement of particle charge
  • Measurement of particle charge
  • Measurement of particle charge

Examples


example 1

[0116]This example shows the use of calibration particles to establish vxP and vxe Measurements of the calibration particles were made at three different applied voltages; 0.4V, 0.5V, and 0.6V. The results are displayed in FIG. 3 and FIG. 4. The measurement details are:

Nanopore—Izon NP200

[0117]Carboxylated polystyrene calibration particles CPC200[0118]—Izon Tris Buffer 0.1 M KCl[0119]Applied Voltages (V): 0.4 V, 0.5 V and 0.6 V[0120]Applied Pressure (Pap): 0 mm H2O[0121]Inherent Pressure (Pin): 4.7 mm H2O[0122]Particle Count—369 at V=0.4 V, 619 at V=0.5 V, 596 at V=0.6 V

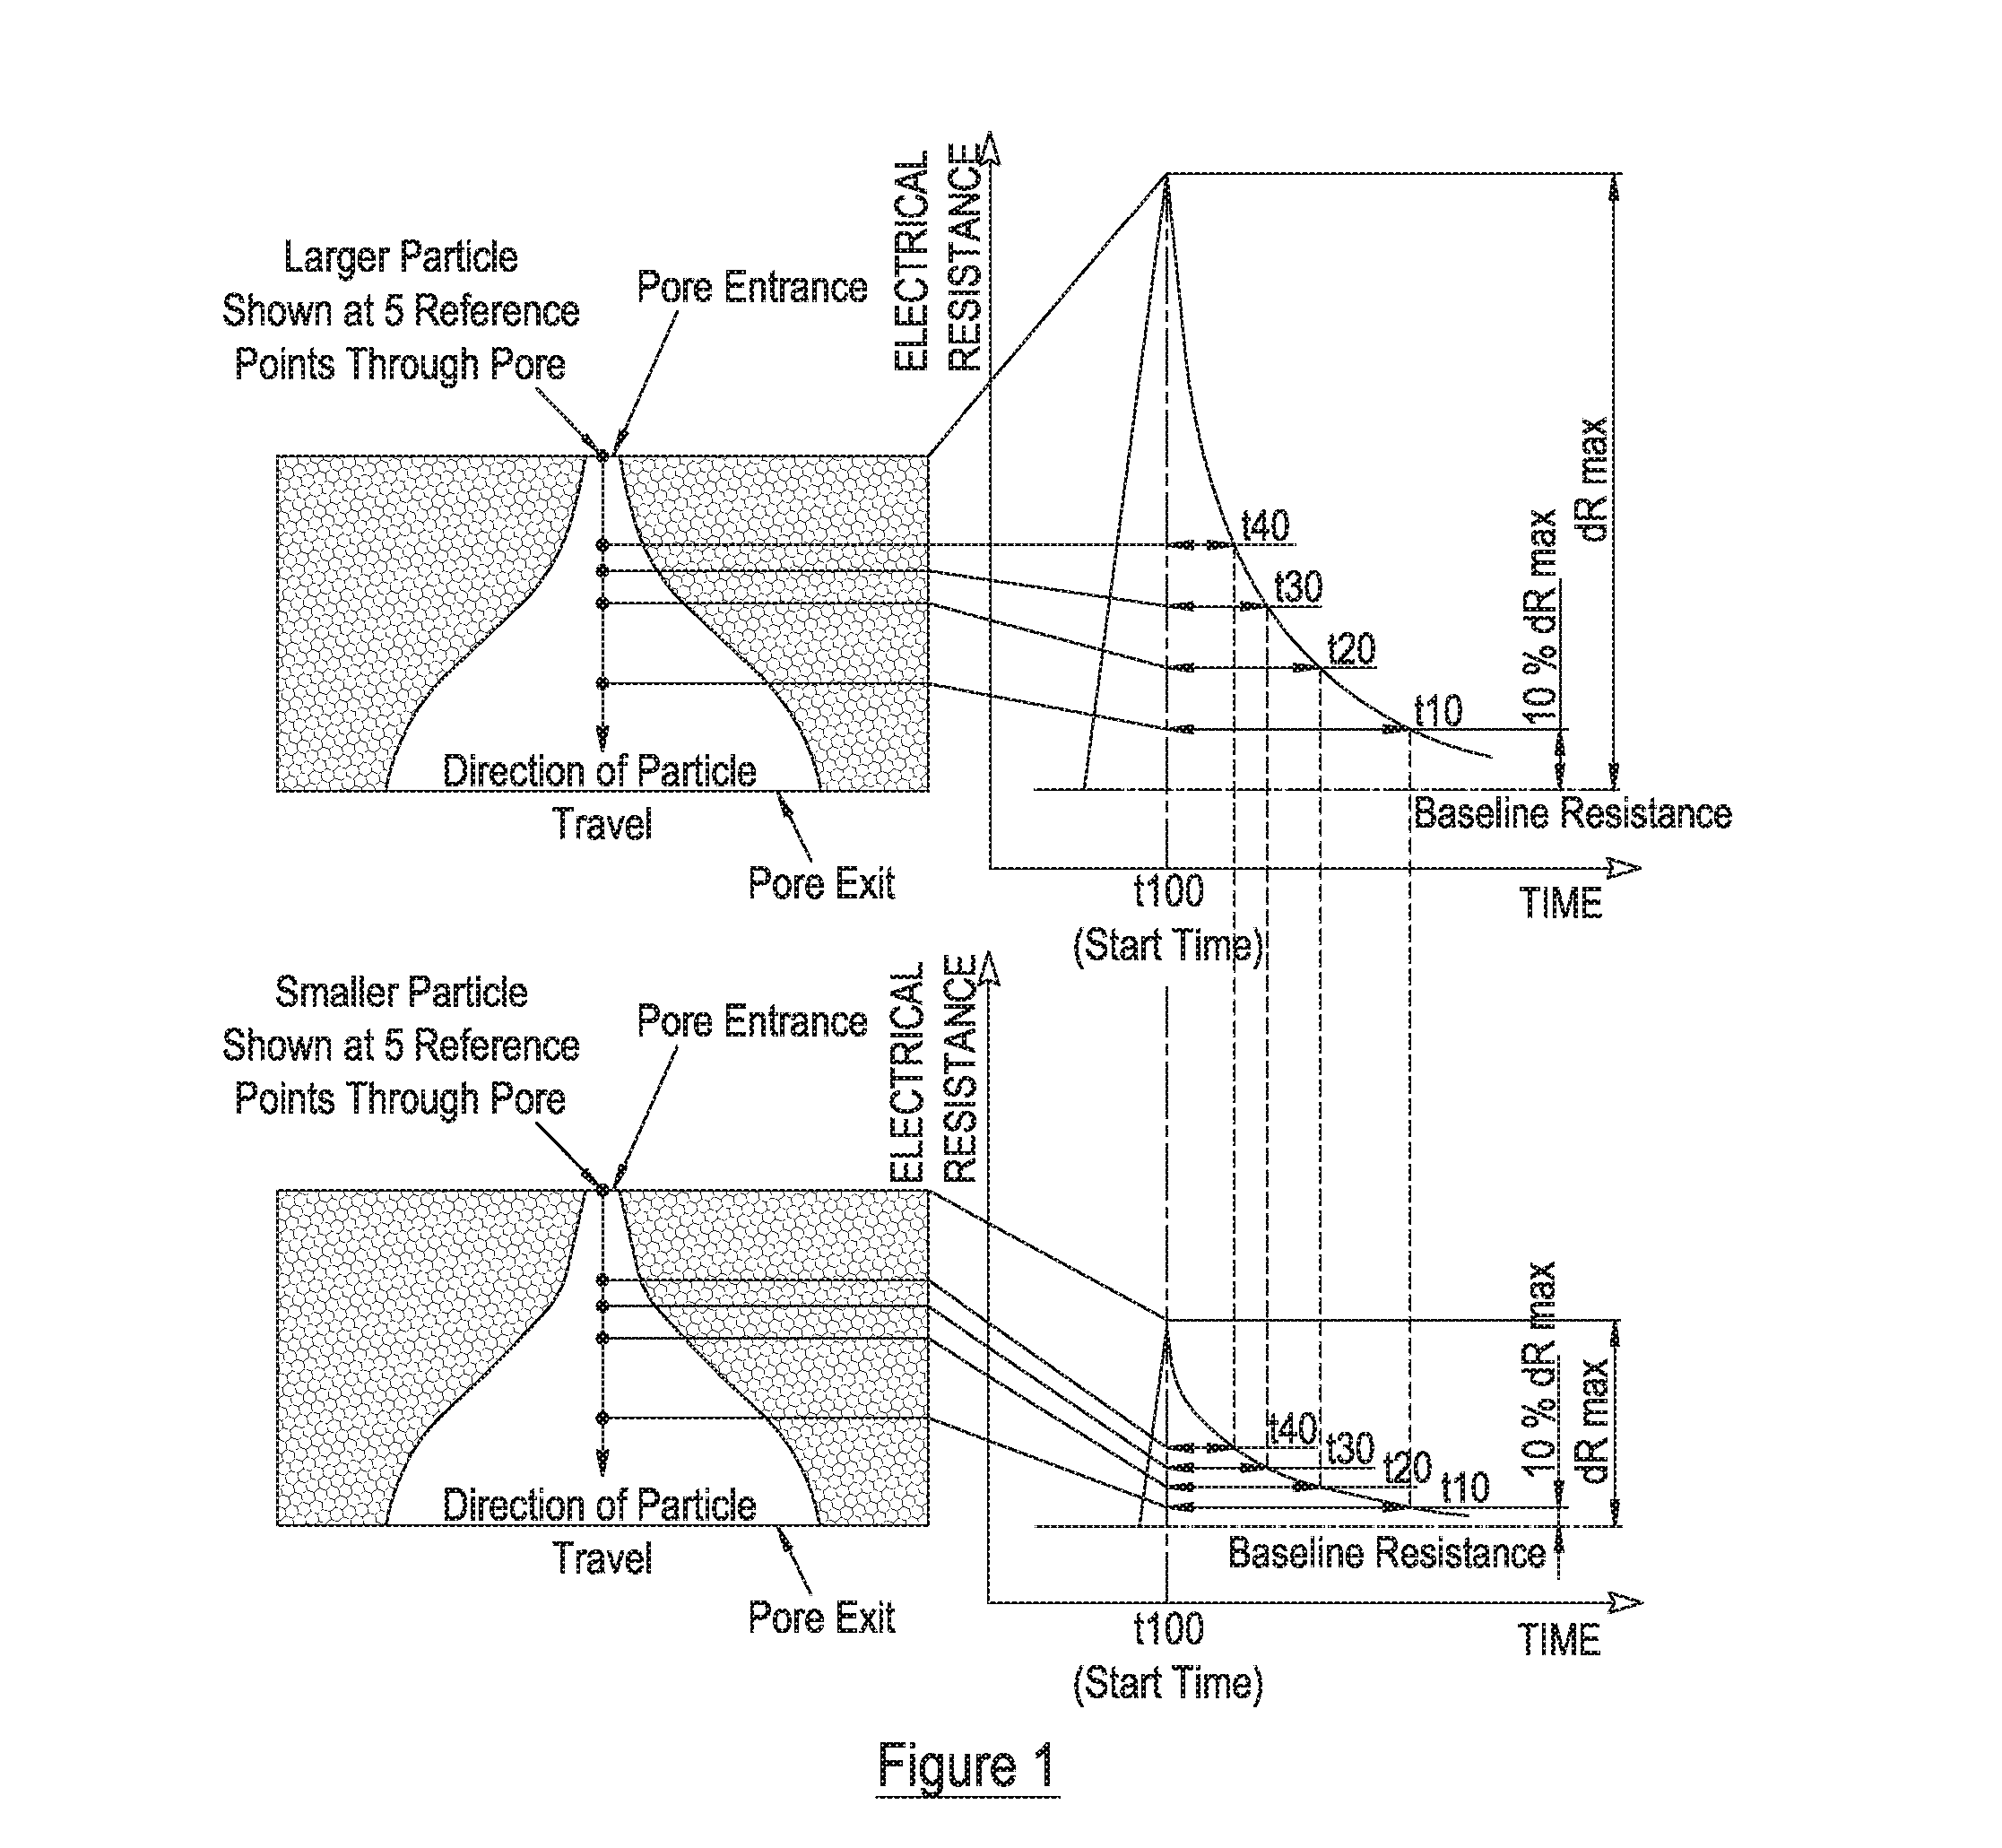
[0123]At V=0 V there are no electrical forces so (vx)tot=(vx)c:[0124](vx)c 40=2806 s−1 and vxP40=(2806 / 4.7)=597 s−1 [0125](vx)c 30=1672 s−1 and vxP30=(1672 / 4.7)=356 s−1 [0126](vx)c 20=1131 s−1 add vxP20=(1131 / 4.7)=241 s−1 [0127](vx)c 10=626 s−1 and vxP10=(626 / 4.7)=84 s−1

(vx)c for the calibration particles can be calculated at any of the applied voltages, for example (vx)c 40 is calculated below at all three voltages...

example 2

[0128]This example demonstrates measuring the sample at multiple pressures. This illustrates the fact that system pressure can be varied without having any material effect on the analysis result as can be seen in FIG. 5. The Measurement details are:[0129]Calibration (and Sample) Particles—carboxylated polystyrene “CPC200”[0130]Nanopore—Izon NP200[0131]Electrolyte Izon Tris Buffer 0.1 M KCl[0132]Applied Voltage (V): 0.8 V[0133]Applied Pressure (Pap): 0 mm H2O to 8 mm H2O in steps of 2 mm (“P0” to “P8”)[0134]Inherent Pressure (Pin): 4.7 mm H2O[0135]System calibrated with ZERO applied pressure

[0136]It can be seen from FIG. 5 that the measured mean Zeta potential does not change significantly with applied pressure. This result is obtained using vxP against calibration particles measured at zero applied pressure. Pulse height is slightly truncated as applied pressure increases, leading to a reduced mean diameter value.

example 3

[0137]This example demonstrates measuring the sample at multiple bias voltages. This illustrates the fact that applied bias can be varied without having any material effect on the analysis result as can be seen in FIG. 6. The Measurement details are:[0138]Calibration (and Sample) Particles—carboxylated polystyrene “CPC200”[0139]Nanopore—Izon “NP200”[0140]Electrolyte—Izon Tris Buffer 0.1 M KCl[0141]Applied Pressure (Pap): 0 mm H2O[0142]Inherent Pressure (Pin): 4.7 mm H2O[0143]Applied Voltage (V): 0.8 V for calibration[0144]System calibrated with ZERO applied pressure

[0145]It can be seen from FIG. 6 that the measured mean Zeta potential does not change significantly with applied voltage. This result is obtained using vxe against calibration particles measured at 0.8 V and zero applied pressure.


PUM


Abstract

A method of determining a charge of at least one test particle (as herein defined), comprising: applying one of an electric current or a voltage across an aperture connecting two chambers, whereby the chambers are at least partially filled with electrolyte and whereby the at least one test particle is suspended in the electrolyte of at least one of the chambers; measuring a value indicative of the other of the electric current or voltage across the aperture; determining a time interval between a first and a second point in time, the second point in time corresponding to a point in time when the measured current or voltage has reached a specific proportion of the measured current or voltage at the first point in time; and determining the charge of the at least one test particle by: determining a value indicative of an electrical velocity component of a total velocity of at least one calibration particle having a known charge, taking into account that the total velocity of the at least one calibration particle comprises a non zero convective velocity component and the electrical velocity component; determining a value indicative of an electrical velocity component of a total velocity of the at least one test particle, taking into account that the total velocity of the at least one test particle comprises a non-zero convective velocity component and the electrical velocity component; and using the determined values indicative of the electrical velocity components of the test particle and the calibration particle to calibrate the quantitative relationship between the charge of the at least one test particle and the determined time interval.

Description

FIELD OF THE INVENTION[0001]The invention relates to a method for measuring the charge of particles, in particular the surface charge of nanometre to micron sized particles suspended in a fluid. The invention extends to apparatus for use in the above method, and to a computer program for use with such apparatus, for carrying out the above method.BACKGROUND AND SUMMARY OF THE INVENTION[0002]The surface charge of objects in the nanometre and micron range is a key factor in their stability and general reactivity. Surface charge and changes in surface charge can also be used to detect and quantify the presence of specific targets in a sample. The ability to accurately measure the surface charge of objects is therefore important for a range of users from industrial (e.g. paint, ink and coating manufacture) through to pharmaceutical (e.g. vaccine QA) and scientific research (e.g. developing nanomedicines and specific molecular diagnostic tests).[0003]Current practice for measuring the sur...

Claims


Application Information

Patent Timeline
IPC IPC(8): G01N27/447G01R29/24G01N27/416G01N15/12
CPCG01N15/12G01N15/1218G01N2015/1075G01N27/44704G01R29/24G01N27/4163G01N27/44791G01N2015/0003G01N15/1209
Inventor GLOSSOP, BENJAMIN MARKVOGEL, ROBERTWEATHERALL, EVAJONES, MARTIN DAVID
Owner IZON SCIENCE
Learn More