Sparse distributed representation of spatial-temporal data

Inactive Publication Date: 2016-07-28
NUMENTA INC
View PDF3 Cites 28 Cited by
  • Summary
  • Abstract
  • Description
  • Claims
  • Application Information

AI Technical Summary

Benefits of technology

The patent relates to encoding coordinate data as a sparse distributed representation. This involves determining input coordinates in a coordinate space and selecting a corresponding region around each input coordinate. A subset of coordinates is selected for each input coordinate, and a sparse distributed representation is generated that includes more inactive elements than active elements. The coordinates may change over time, and the corresponding region may be determined based on a measure of change or a threshold distance. The result is a more efficient representation of the coordinate data that reduces memory requirements and processing power. Additionally, temporal sequences of spatial patterns can be determined in the sparse distributed representations. Overall, the patent describes a way to efficiently encode coordinate data for use in various applications.

Problems solved by technology

The training process of the HTM system is largely a form of unsupervised machine learning.
Input data to the HTM system may be in a format incompatible for processing by HTM system.

Method used


Image

  • Sparse distributed representation of spatial-temporal data
  • Sparse distributed representation of spatial-temporal data
  • Sparse distributed representation of spatial-temporal data

Examples


example stms

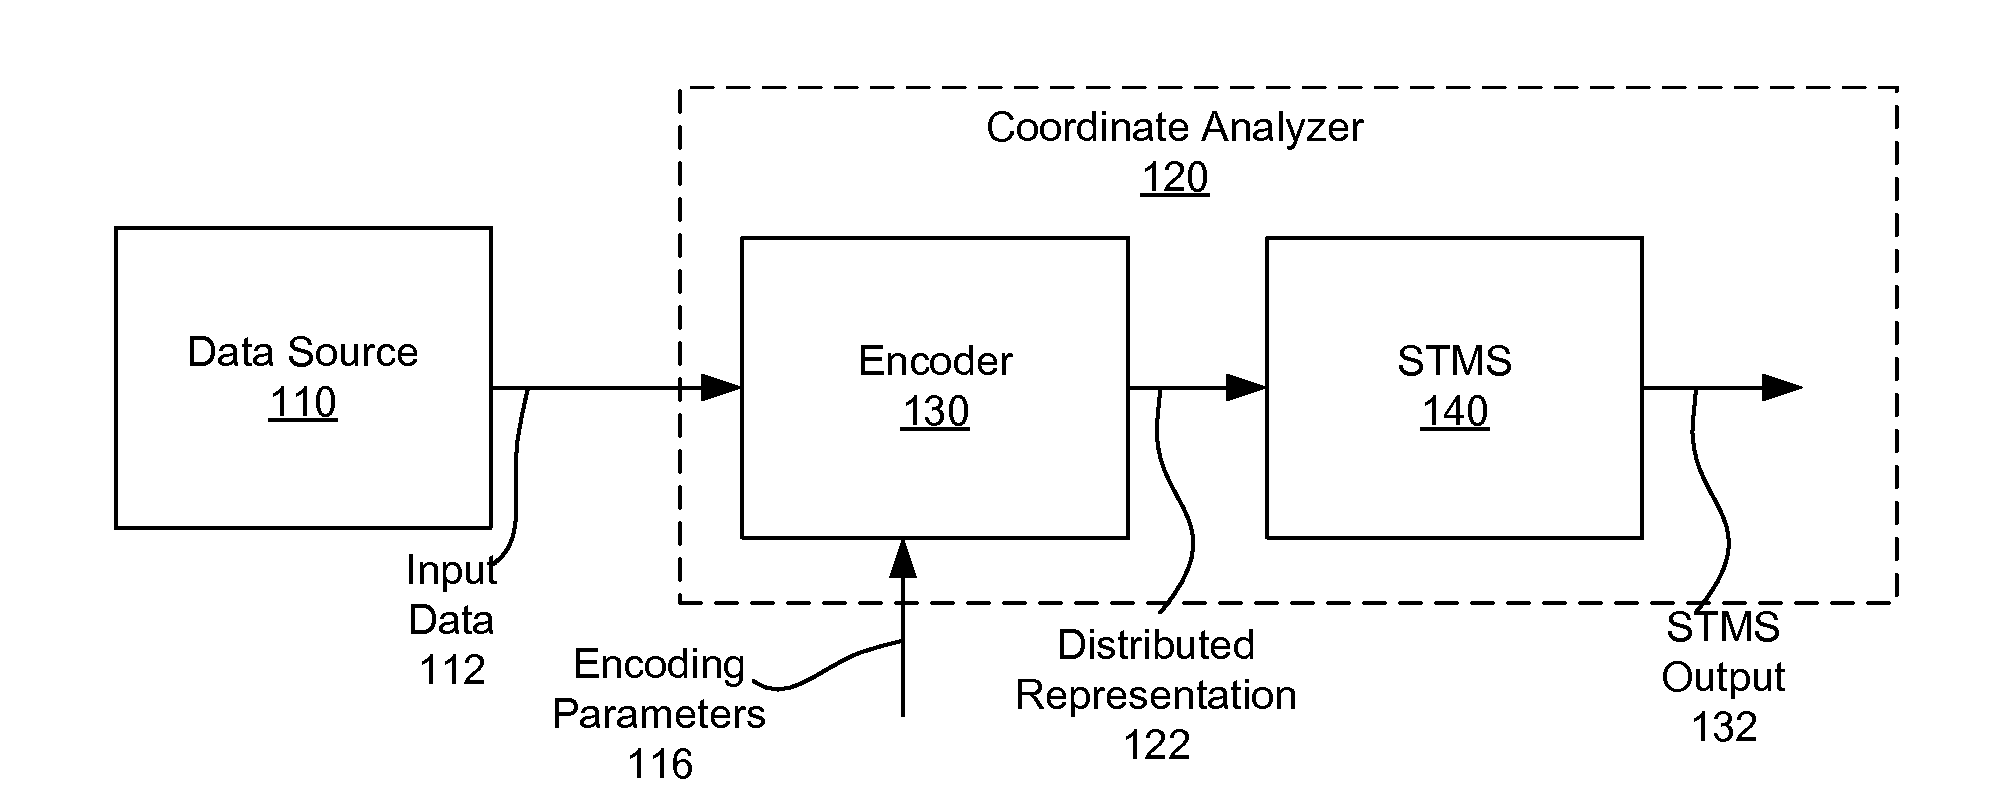
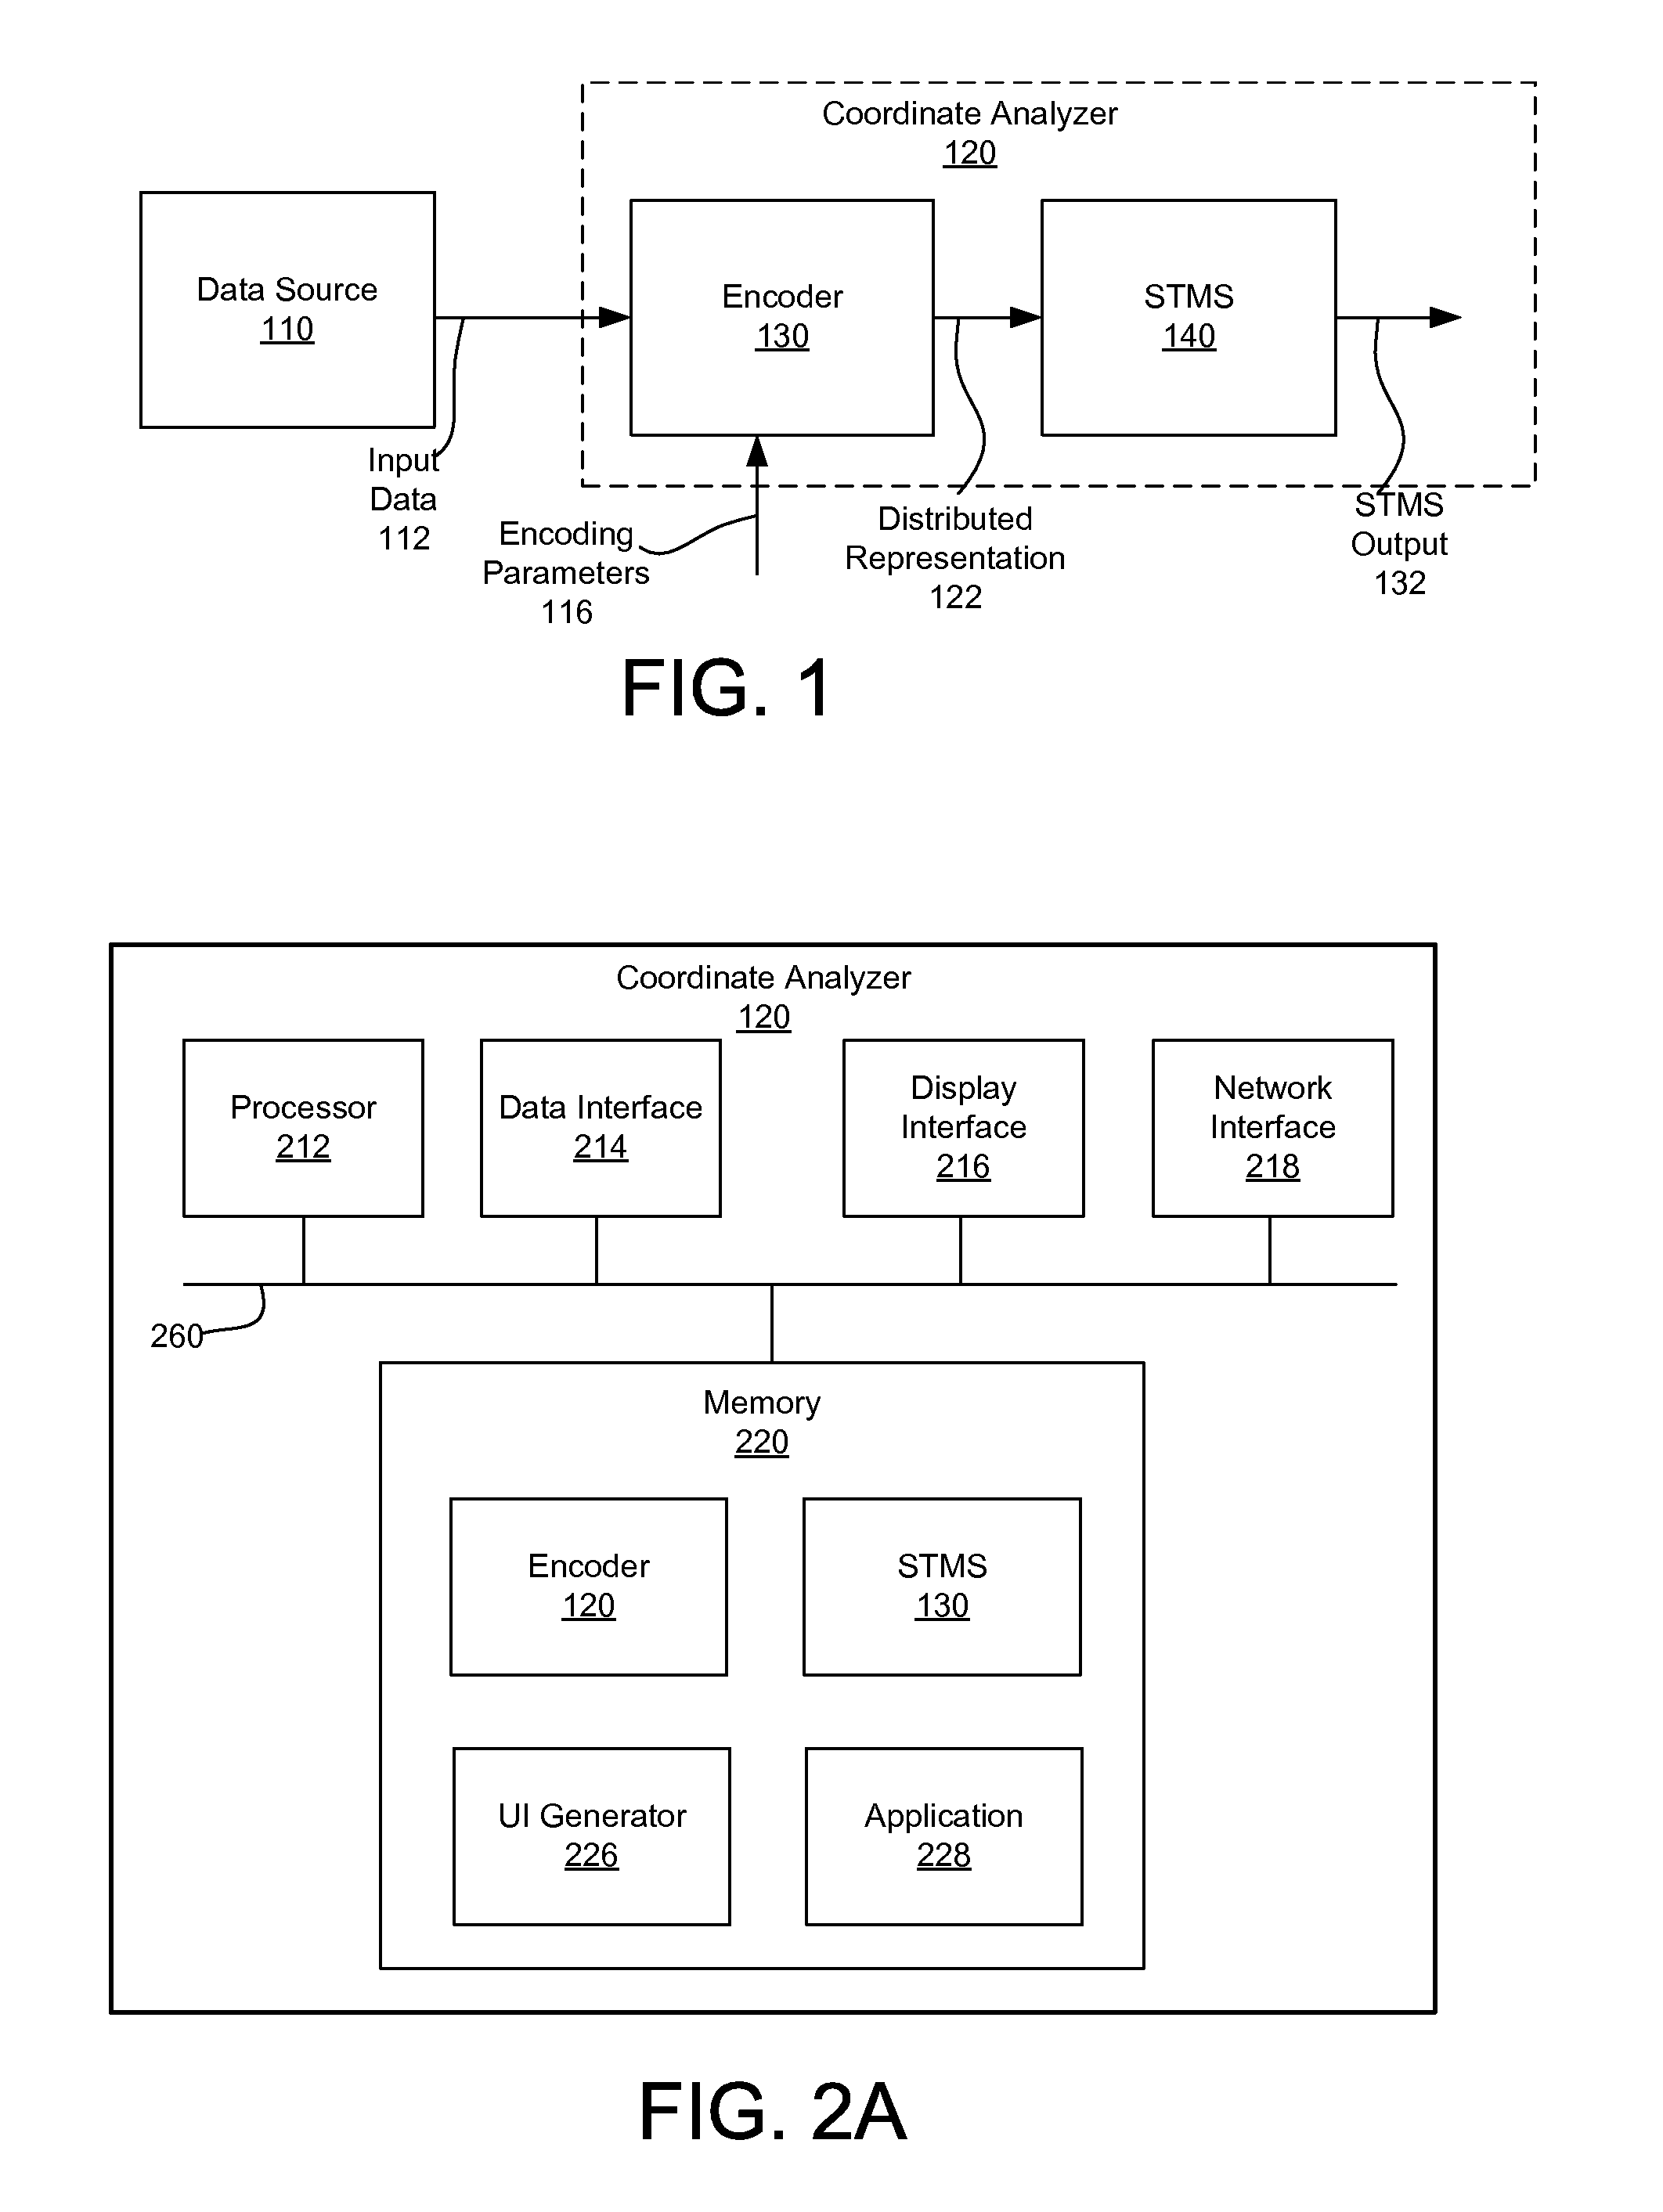
[0031]FIG. 1 is a conceptual diagram illustrating relationships between a data source 110, an encoder 130, and a STMS module 140, according to one embodiment. The encoder 130 and STMS module 140 are included in a coordinate analyzer 120 that evaluates input data 112 from the data source 110. Although one of each component is illustrated, various embodiments may include multiple instances of components (e.g., multiple data sources 110, multiple STMS modules 140).

[0032]The data source 110 may be any source outputting input data 112 that may be encoded for processing by an STMS. Typically, data sources 110 output one or more dimensions of input data 112, which vary with time. The one or more dimensions of input data 112 may be converted to a coordinate encoded as a distributed representation. Example data sources 110 include (i) a usage monitor of a webserver (e.g., physical, cloud, virtual) outputting input data 112 such as page loads, downloads, uploads, purchases, or clicks; (ii) a ...

example regions

Around an Input Coordinate

[0065]FIGS. 4A through 4D are conceptual diagrams of example regions 406 around an input coordinate 402, according to various embodiments. The input coordinate is illustrated in an array 400 of discrete coordinates. A region includes an input coordinate 402 and neighbor coordinates. A subset of neighbor coordinates 410 are selected and hashed to determine which elements of the distributed representation are active. Although illustrated with respect to two-dimensional input data, other input data having three or more dimensions may have corresponding regions encompassing three or more dimensions, and other input data having one dimension may have corresponding one-dimensional ranges, as described further with respect to FIG. 6.

[0066]FIG. 4A illustrates a square region 406. FIG. 4B illustrates a circular region 416. The side length of the square region 406 and the radius of the circular region 416 may be determined by an aggregate measure of change (e.g., spe...

example detection

of Anomalies from Input Coordinates

[0070]FIGS. 5A through 5D are conceptual diagrams illustrating detection of anomalies from input coordinates, according to one embodiment. Although described with respect to an application 228 monitoring movement of a delivery truck for anomalies, other input data 112 may be used or may be analyzed differently.

[0071]FIG. 5A illustrates a habitual path 506 across geographic locations traveled by a truck on a delivery route. As the truck travels, a location sensor reports input coordinates 502. The encoder 120 converts the input coordinates 502 to distributed representations provided to the STMS module 130. Repeated exposures to the input coordinates trains the STMS module 130 to recognize the temporal sequence of input coordinates 502 and to predict a next coordinate in the temporal sequence. To detect anomalies, the application 228 compares distributed representations encoding predicted coordinates output by the STMS module 130 to distributed repre...


PUM


Abstract

Coordinate data is encoded as a distributed representation for processing and analysis by a machine-intelligence system such as a hierarchical temporal memory system. Input coordinates represented in coordinate space having at least one dimension are obtained. The input coordinates change over time. A corresponding region around each of the input coordinates in the coordinate space is determined. A subset of coordinates within the corresponding region for each of the input coordinates is selected. A distributed representation for each of the input coordinates reflecting the selected subset of coordinates for each of the input coordinates is generated. The distributed representation may be provided to one or more processing nodes for detection of temporal sequences and spatial patterns. Based on discrepancies between predicted coordinate data and actual coordinate data, anomalies may be detected.

Description

BACKGROUND[0001]1. Field of the Disclosure[0002]The disclosure relates to encoding data for input to a machine-intelligence system, and more particularly to representing a multi-dimensional coordinate space as sparse distributed representations for input to a machine-intelligence system.[0003]2. Description of the Related Arts[0004]Hierarchical Temporal Memory (HTM) systems represent a new approach to machine intelligence. In an HTM system, training data comprising temporal sequences and / or spatial patterns are presented to a network of nodes. The HTM network then builds a model of the statistical structure inherent in the spatial patterns and temporal sequences in the training data, which may be used to predict or recognize the temporal sequences of patterns and sequences in the training data. The hierarchical structure of the HTM system enables implementation of models of very high dimensional input spaces using reasonable amounts of memory and processing capacity.[0005]The traini...

Claims


Application Information

Patent Timeline
Patent Type & Authority Applications(United States)
IPC IPC(8): G06F17/30G06N99/00G06N20/00
CPCG06N99/005G06F17/30312G06N20/00
Inventor HAWKINS, JEFFREY C.SURPUR, CHETANPURDY, SCOTT M.
Owner NUMENTA INC
Why Eureka
Try Eureka