
Using Linear and Log-Linear Model Combinations for Estimating Probabilities of Events

a probabilistic probability and log-linear model technology, applied in the field of statistics, can solve the problems of biased statistical models and inability to fairly characterize all predictive sources, and achieve the effect of flexible receiving slice specifications

Active Publication Date: 2012-01-26
TWITTER INC
View PDF1 Cites 58 Cited by
  • Summary
  • Abstract
  • Description
  • Claims
  • Application Information

AI Technical Summary

Benefits of technology

[0005]A method for combining multiple probability of click models in an online advertising system into a combined predictive model, the method commencing by receiving a feature set slice (e.g. corresponding to demographics or taxonomies or clusters), and using the sliced data for training multiple slice-wise predictive models. The trained slice-wise predictive models are combined by overlaying a weighted distribution model over the trained slice-wise predictive models. The combined predictive model then is used in predicting (for example) probability of a click given a query-advertisement pair. The method can flexibly receive slice specifications, and can overlay any one or more of a variety of distribution models, such as a linear combination or a log-linear combination. Using an appropriate weighted distribution model, the combined predictive model reliably yields predictive estimates of occurrence of click events that are at least as good as the best predictive model in the slice-wise predictive model set.

Problems solved by technology

However, such a single model may not be able to fairly characterize all predictive sources observable in the data.
Similarly, some statistical models are biased, if merely because of the selection of predictive sources (i.e. features) used in a particular model.

Method used


Image

  • Using Linear and Log-Linear Model Combinations for Estimating Probabilities of Events
  • Using Linear and Log-Linear Model Combinations for Estimating Probabilities of Events
  • Using Linear and Log-Linear Model Combinations for Estimating Probabilities of Events

Examples


Embodiment Construction

[0016]In the following description, numerous details are set forth for purpose of explanation. However, one of ordinary skill in the art will realize that the invention may be practiced without the use of these specific details. In other instances, well-known structures and devices are shown in block diagram form in order to not obscure the description of the invention with unnecessary detail.

[0017]This application hereby expressly incorporates by reference U.S. patent application Ser. No. 12 / 840,598, filed Jul. 21, 2010.

Overview of Networked Systems for Online Advertising

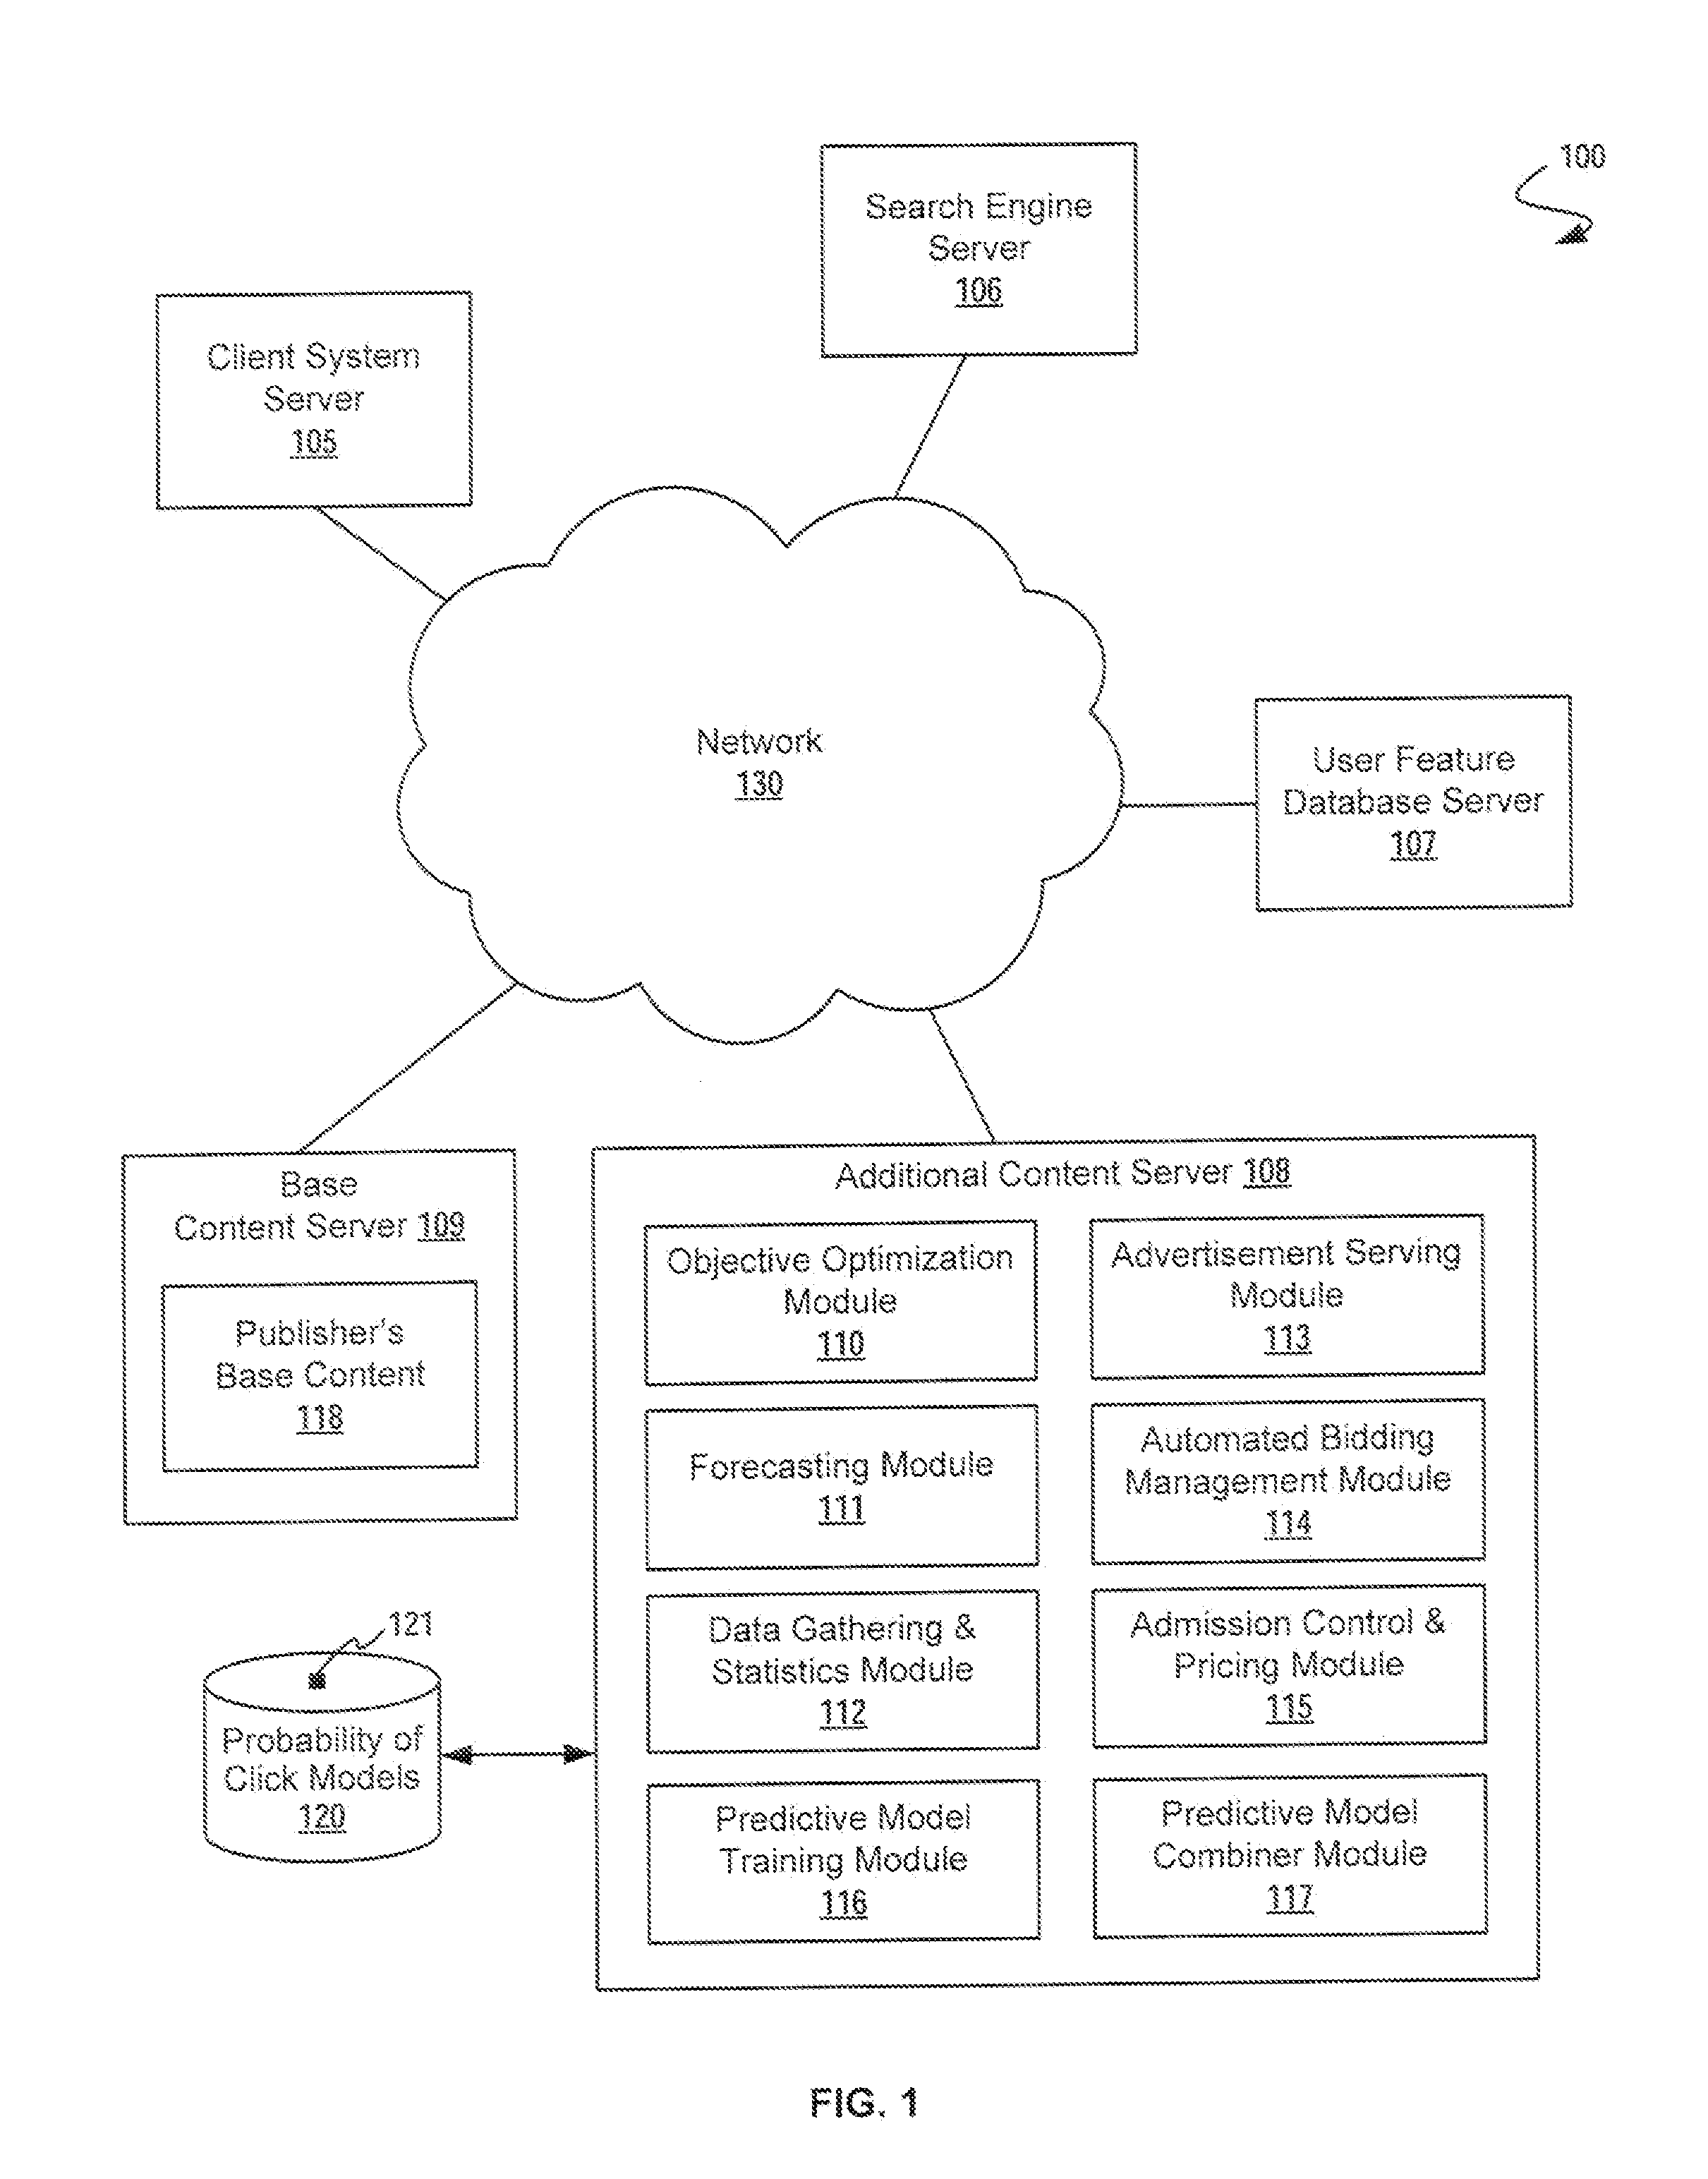
[0018]FIG. 1 depicts an advertising server network environment including modules for using linear and log-linear model combinations for estimating probabilities of events. In the context of internet advertising, placement of advertisements within an internet environment (e.g. online advertising system 100 of FIG. 1) has become common. By way of a simplified description, an internet advertiser may select a particula...


PUM


Abstract

A method for combining multiple probability of click models in an online advertising system into a combined predictive model, the method commencing by receiving a feature set slice (e.g. corresponding to demographics or taxonomies or clusters), and using the sliced data for training multiple slice-wise predictive models. The trained slice-wise predictive models are combined by overlaying a weighted distribution model over the trained slice-wise predictive models. The combined predictive model then is used in predicting the probability of a click given a query-advertisement pair in online advertising. The method can flexibly receive slice specifications, and can overlay any one or more of a variety of distribution models, such as a linear combination or a log-linear combination. Using an appropriate weighted distribution model, the combined predictive model reliably yields predictive estimates of occurrence of click events that are at least as good as the best predictive model in the slice-wise predictive model set.

Description

FIELD OF THE INVENTION[0001]The present invention is related to the field of statistical modeling for making event predictions using linear and log-linear model combinations.BACKGROUND OF THE INVENTION[0002]In some approaches to statistical modeling, a single model is used to predict the probability of a given event based on previous events. When such single model approaches are applied to online advertising, the single statistical model is used to predict the probability of click based on a user, a query, and an advertiser. However, such a single model may not be able to fairly characterize all predictive sources observable in the data. The click-through rates (CTRs) vary among queries depending upon, for example, the commercial nature of the query. Similarly, some statistical models are biased, if merely because of the selection of predictive sources (i.e. features) used in a particular model. In the context of online advertising, one goal of user response modeling is to predict t...

Claims


Application Information

Patent Timeline
Patent Type & Authority Applications(United States)
IPC IPC(8): G06Q30/00
CPCG06Q10/04G06Q30/0277G06Q30/0241
Inventor CETIN, OZGURMANAVOGLU, ERENACHAN, KANNANCANTU-PAZ, ERICKIYER, RUKMINI
Owner TWITTER INC
Learn More