
System and method for identifying implicit events in a supply chain

Inactive Publication Date: 2008-02-28
VISION CHAIN
View PDF2 Cites 38 Cited by
  • Summary
  • Abstract
  • Description
  • Claims
  • Application Information

AI Technical Summary

Problems solved by technology

This increased event granularity enables product to be tracked at numerous points through the supply chain, resulting in large volumes of data.
It is especially difficult to identify implicit events in a supply chain based on tag reads.
This data is also voluminous, often incorrect, and hard to interpret.
Limitations in technology maturity cause ubiquitous problems, even in the most advanced businesses.
This makes straightforward methods of monitoring and acting on this data incorrect or even disastrous.
That lack of inventory is a specific actual fact indicating a problem with the process the metric is defined to measure.
While this may seem simple from a technical perspective, today's measuring systems are too often wrong or do not account for all possible outcomes or product locations, and as such it leaves the retailer, manufacturer, or supply chain user open to a myriad of problems.
These include, first, that the data may be wrong.
In the example here, if inventory is actually more than zero, although the simple explicit event indicates zero inventory, then product will be ordered to replenish the shelf, when none is needed, leading to an overstock situation.
Alternately, the explicit data may show a positive inventory, and be incorrect, leading to no orders for more products when more products are actually needed resulting in an out-of-stock.
Secondly, there are a number of problematic business scenarios that today can only be identified with a visual inspection of the retail store shelf itself in the supply chain.
This approach is so expensive to be unrealistic to be applied to all stores; and it also can lead to incorrect data and actions.
Third, using RFID technology, users are still limited to explicit facts.
This does not help a user to define where that product should have been, should be now, what amount this is costing the item owner, nor where it is when no reads have occurred.
Fourth, measuring approaches often do not account for products that go missing at or between the nodes of the supply chain; theft, loss, damage, and other outcomes lead to incorrect data.
Since measuring systems and concomitant actions downstream from the problematic node are based on the assumption of data correctness, many wrong actions can occur from a single data error.
Finally, today no approaches are commonly used to tie disparate explicit event data points together to imply a business scenario.
However, there are implicit business scenarios detrimental to consumers and business owners occurring that are not identified.
However, this approach is still problematic.
Unfortunately, every data system in the family is problematic.
There are many errors in a point-of-sale system; retailers often will change their sales figures post hoc due to errors they find.
RFID readers are not and will never consistently read a movement of every case or item.
Further, by relying on absolute amounts of believed inventory, an incorrect value early on or higher up in the supply chain will taint and make incorrect all future absolute values.

Method used


Image

  • System and method for identifying implicit events in a supply chain
  • System and method for identifying implicit events in a supply chain
  • System and method for identifying implicit events in a supply chain

Examples


Embodiment Construction

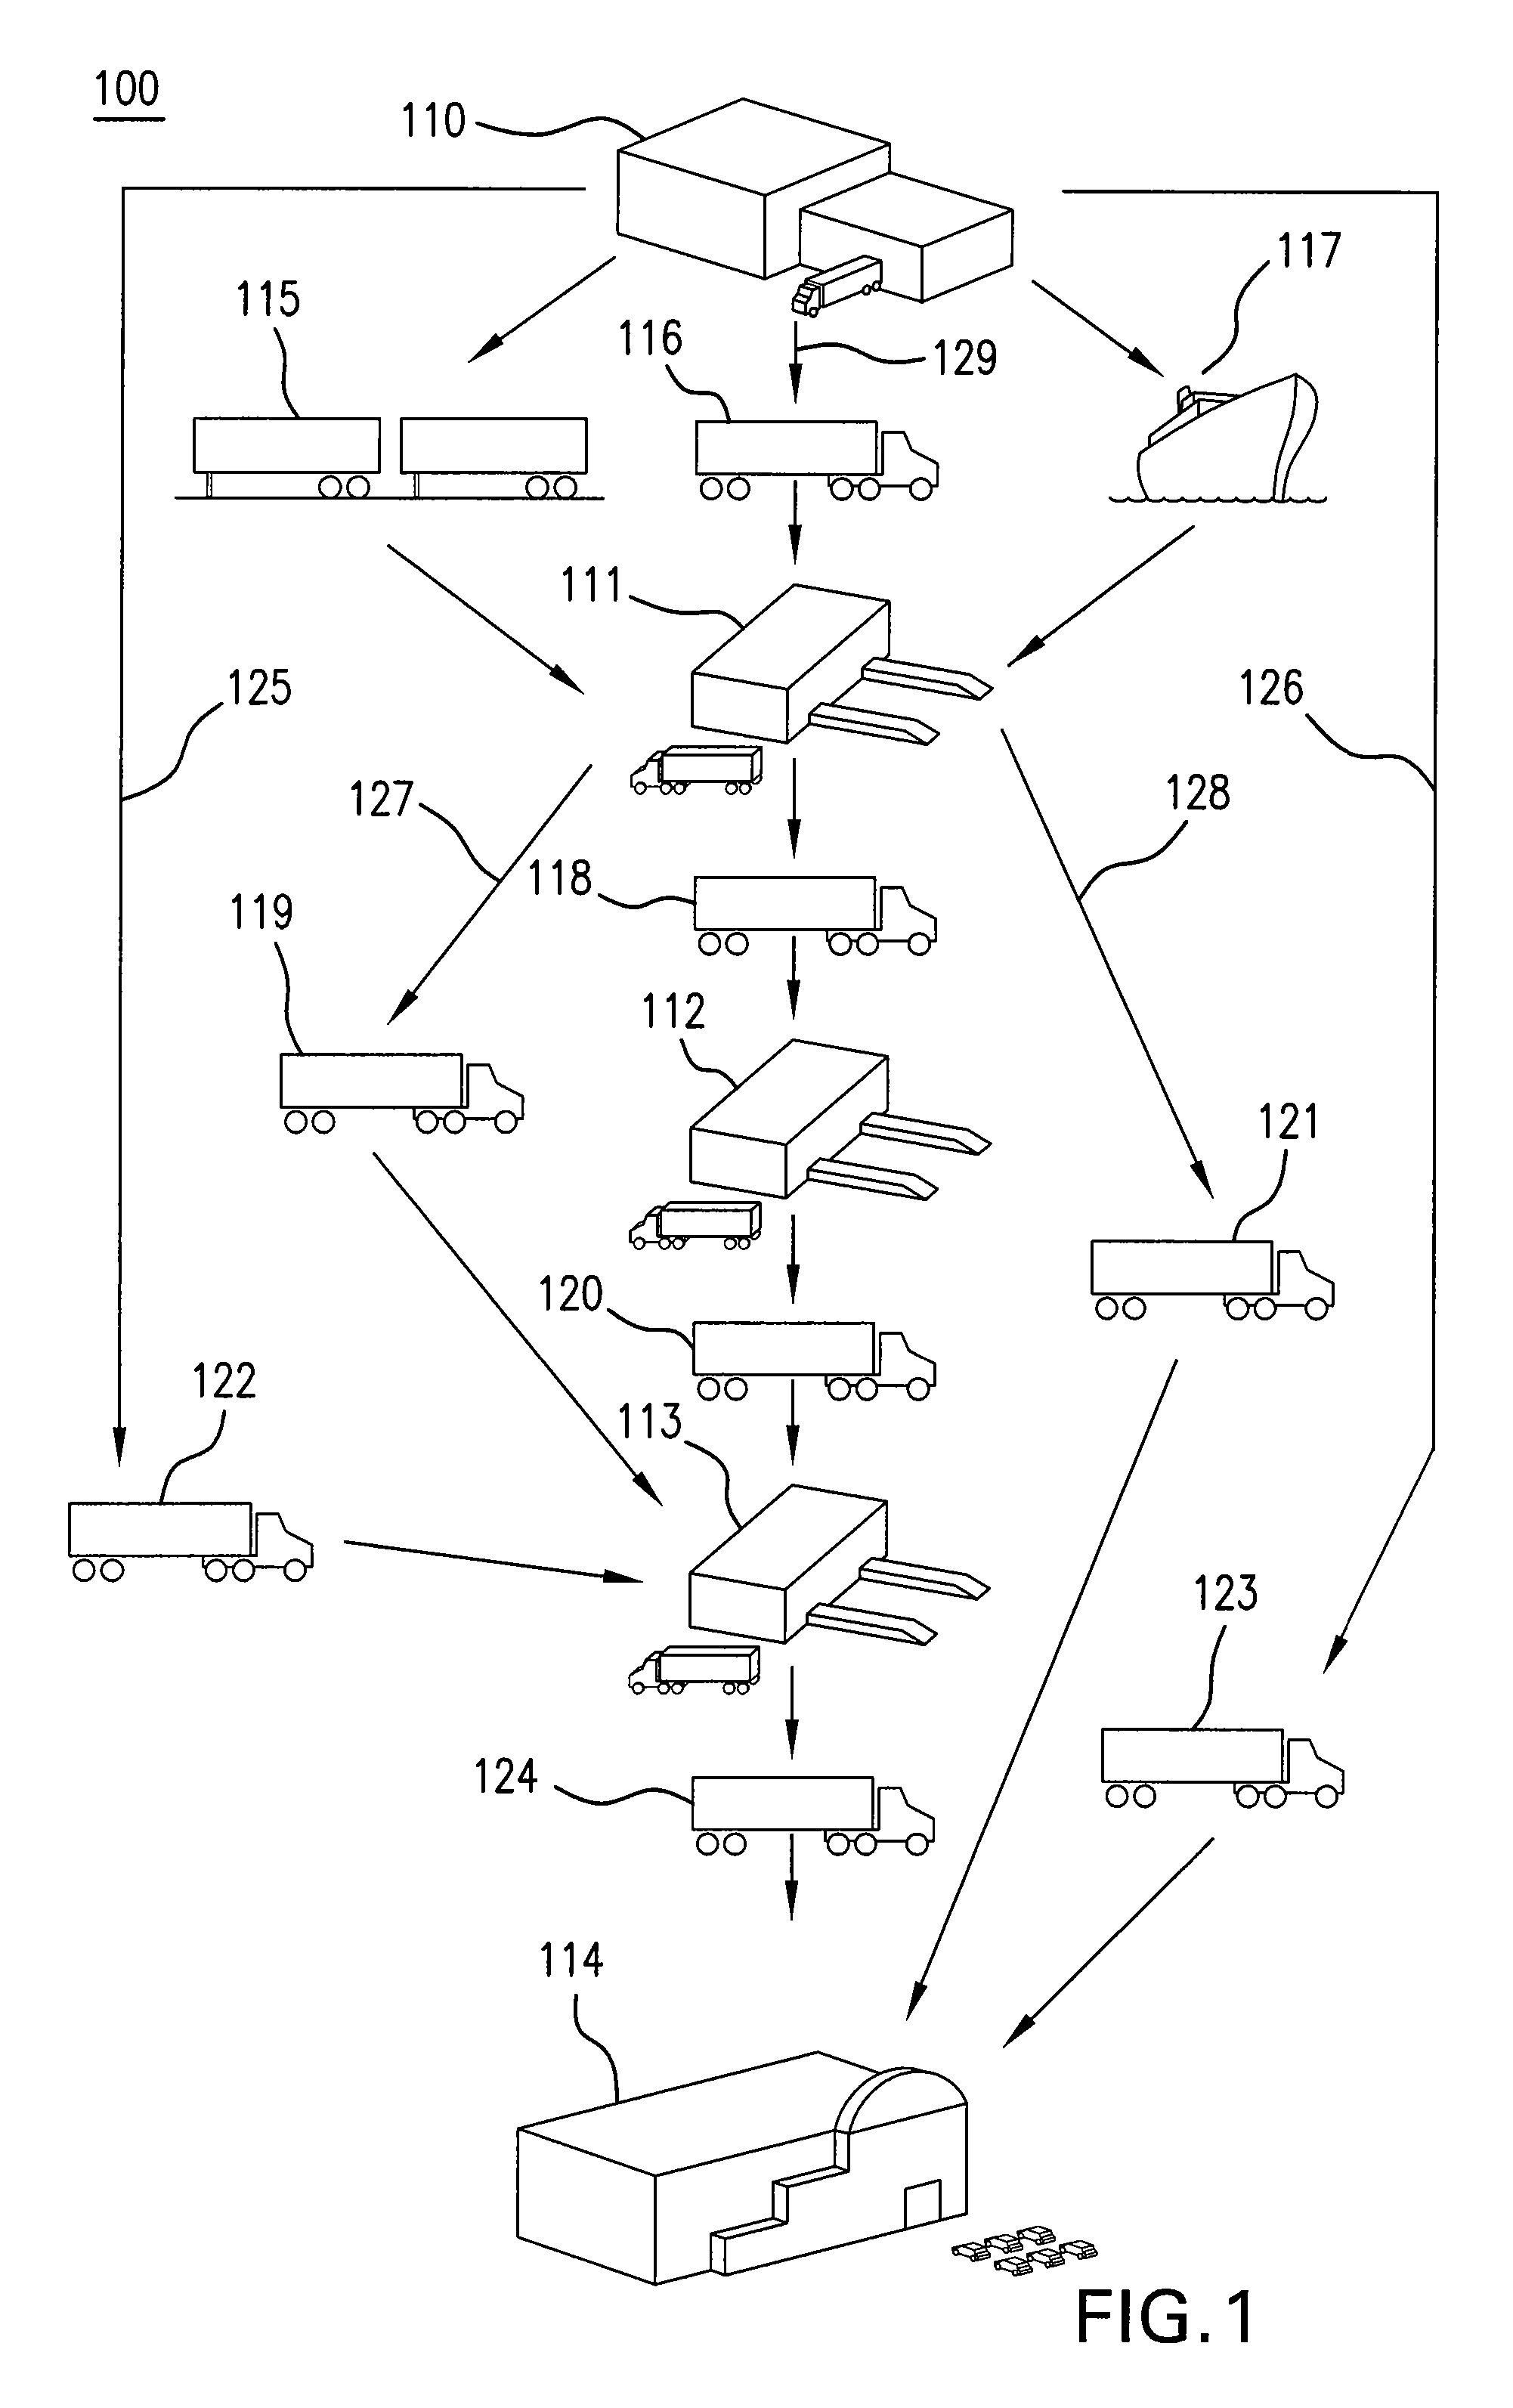
[0024]FIG. 1 illustrates a contemporary product supply chain. A supply chain as from the perspective of a retailer would start at their manufacturers' (also known as suppliers or vendors) manufacturing facilities (‘plants’) (110), Typically, the items made in plants 110 would go to one or more distribution centers (DC) (111, 112) owned by the manufacturer, then on to a DC owned by the retailer (113), then on to a retail store (114). Some manufacturers may own just a single DC tier or layer (110), although FIG. 1 illustrates a more advanced supply chain where Tier 1, where more centralized DC's (110) are accompanied by another more remote series of Tier 2 DC's (111, 112). In this configuration, the most common product flow is shown (129) going via rail (115), freighter ship (117), or truck (116) to the Tier 1 DC (111). In some cases, product can flow directly from a plant 110 to a store (114) via a single carrier (123). Alternately, some other downstream flow to the retailer's DC (11...


PUM


Abstract

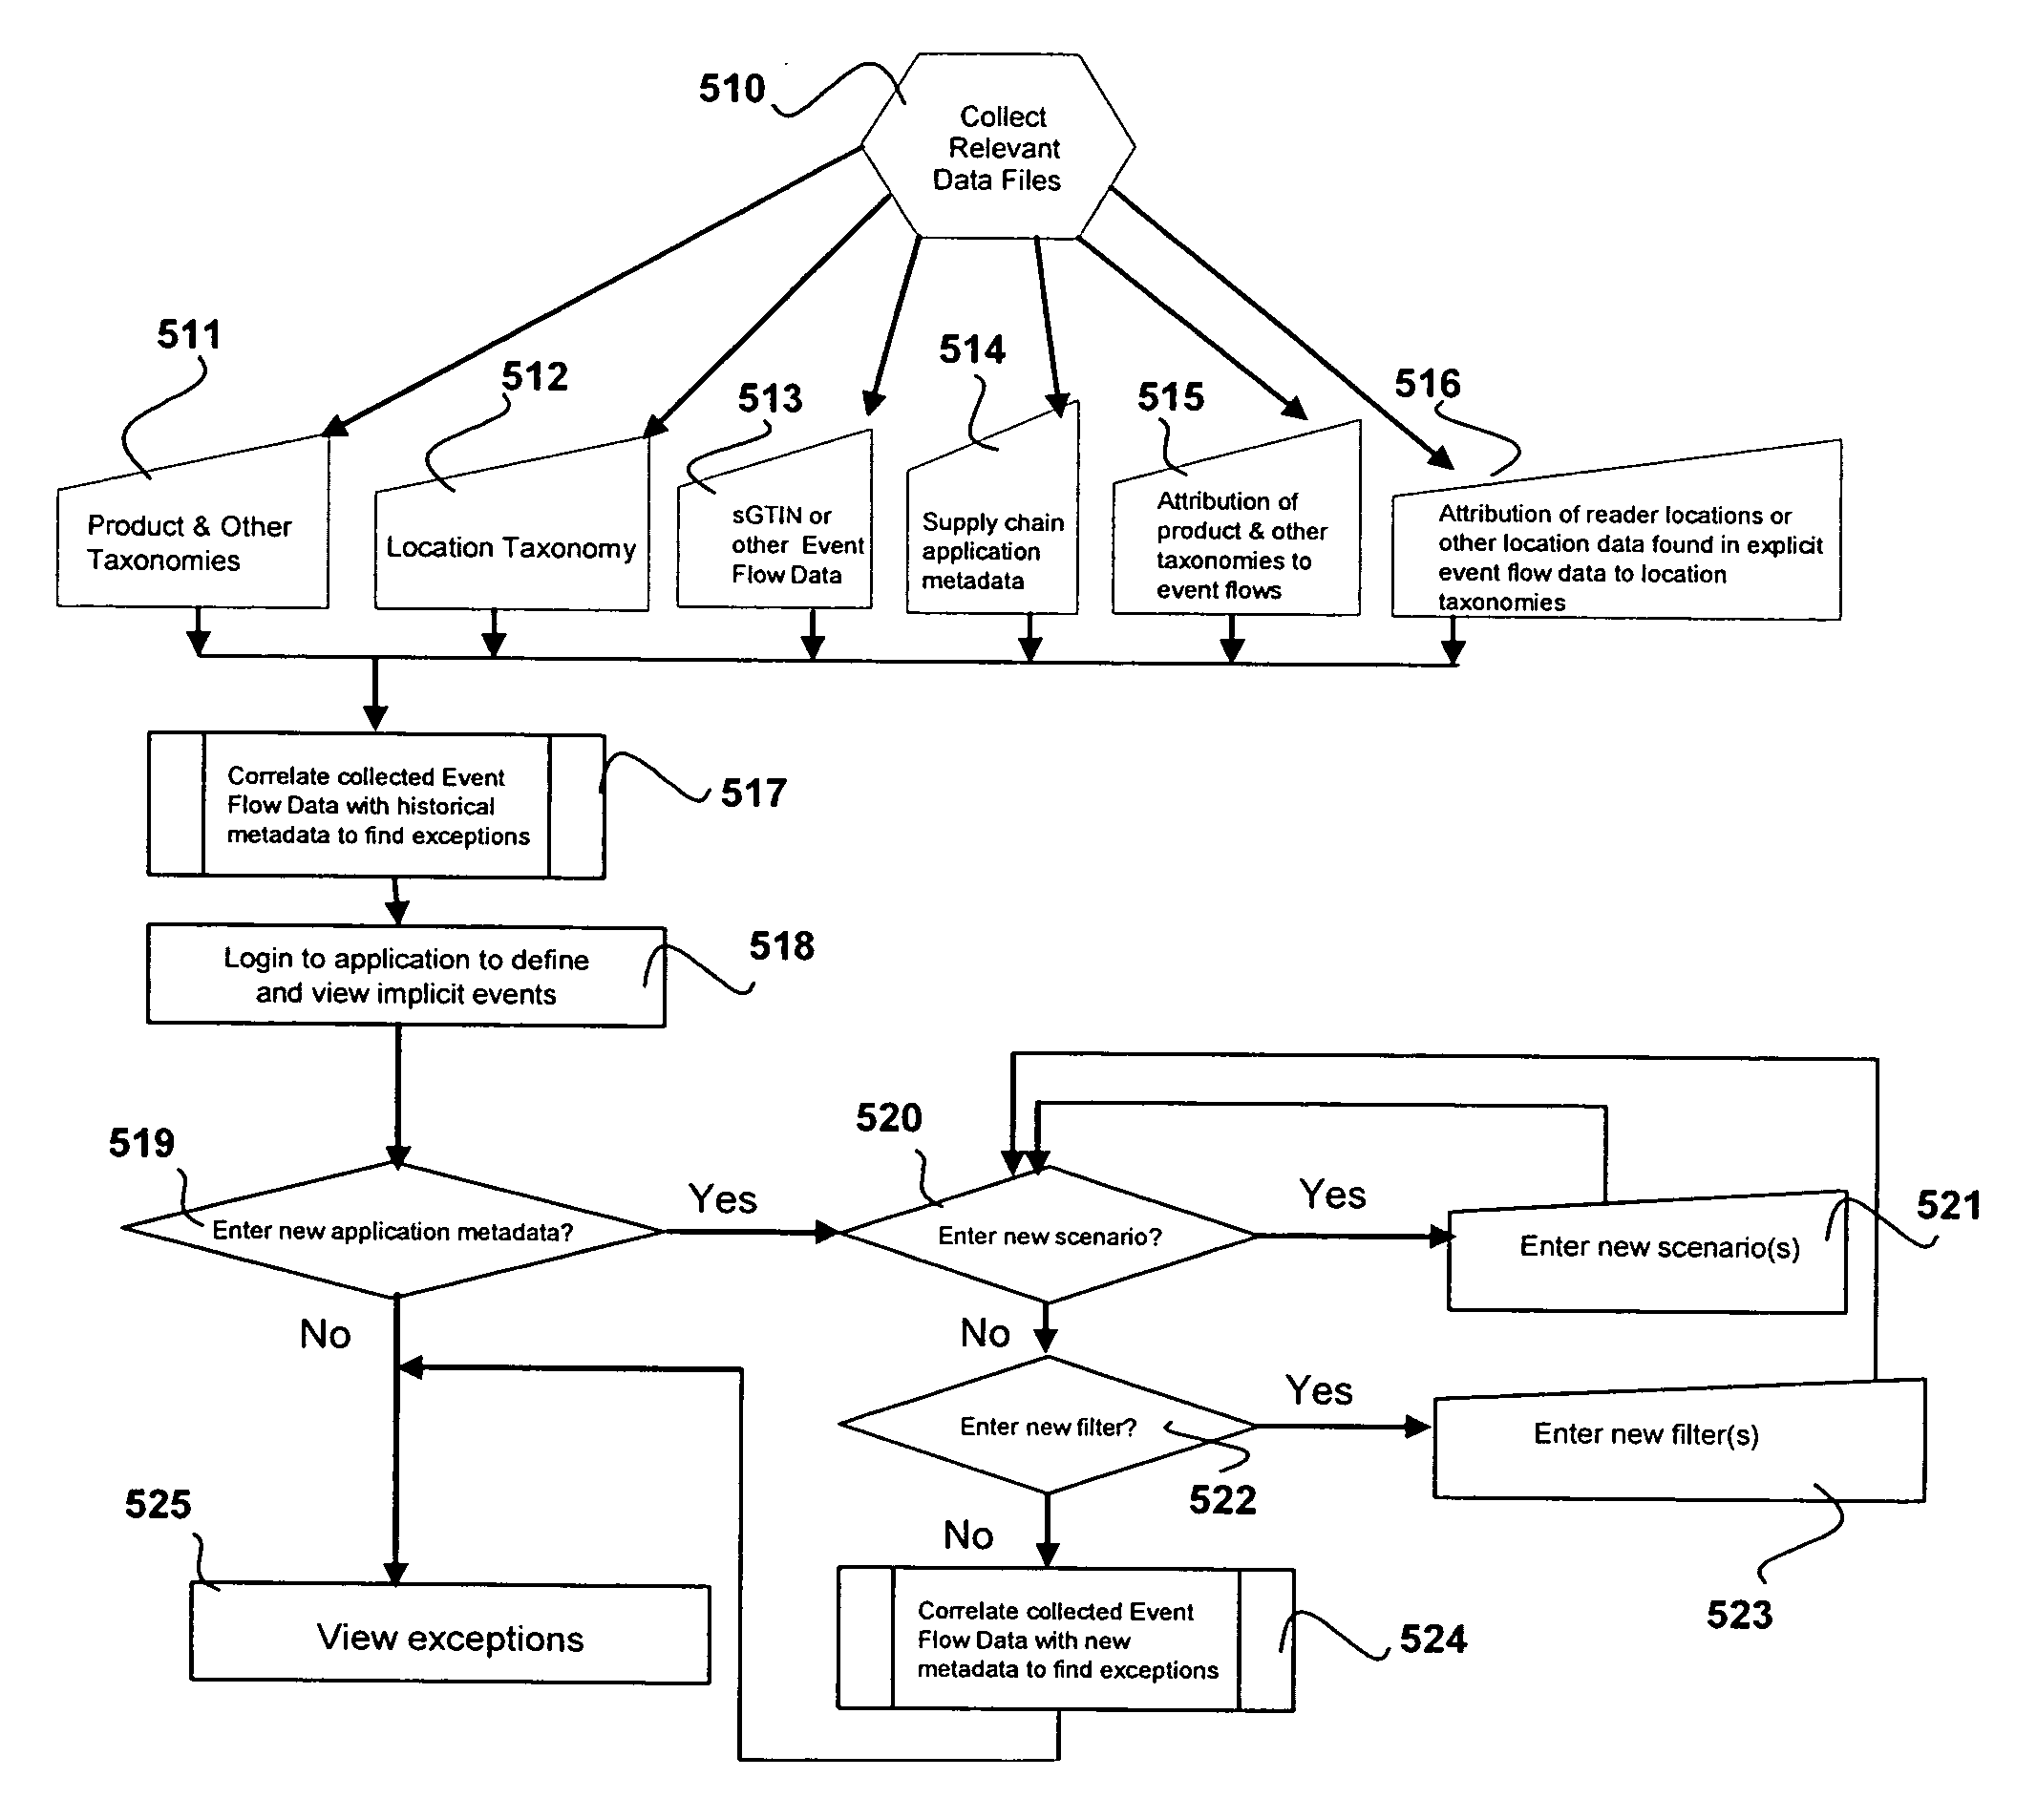
The present invention is a method and system of identifying supply chain business scenarios using data from one or more Serialized Global Trade Identification Number (sGTIN) tag reads or other explicit supply chain data. Scenarios are asserted by calculating changes in data and comparing those with user definitions of scenario event combinations. A processor acquires the scenario definitions from a user defined metadata of products, locations, and measure variance criteria and correlates the sGTIN event reads and other events with this metadata to identify defined events that are not observed in the sGTIN event reads or other explicit data, or not observable by the tag readers. The system has a method for communicating these implicit events back to users.

Description

CROSS REFERENCE TO RELATED APPLICATIONS [0001] This application claims benefit to the provisional application 60 / 839,689 filed on Aug. 24, 2006, which is incorporated by reference in its entirety herein.BACKGROUND OF THE INVENTION [0002] 1. Field of the Invention [0003] The present invention relates generally to supply chain management. [0004] 2. Related Art [0005] Radio Frequency Identification (RFID) technology is in wide use in the retail supply chain industry. RFID tag reads are typically filtered and associated with supply chain location and operational activities. Event reads within the supply chain are common at the palletizer, manufacturer shipping door, retailer receiving conveyor, the shipping conveyor, the receiving door, the backroom, between the backroom and sales floor, and the box crusher. This increased event granularity enables product to be tracked at numerous points through the supply chain, resulting in large volumes of data. Business users are now faced with a t...

Claims


Application Information

Patent Timeline
IPC IPC(8): G06Q10/00
CPCG06Q10/087G06Q10/06
Inventor DOLLEY, SHAWNSHUMAN, DAVID GEORGE
Owner VISION CHAIN
Learn More