
Sorting points into neighborhoods (spin)

Inactive Publication Date: 2007-12-13
YEDA RES & DEV CO LTD
View PDF2 Cites 2 Cited by
  • Summary
  • Abstract
  • Description
  • Claims
  • Application Information

AI Technical Summary

Benefits of technology

[0007] Among the many advantages of the present invention is that the method provides an efficient and intuitive way to read the properties and relationships of the data from the reordered distance matrix. Contact maps of proteins have been used to discover secondary structure, but they posses an inherent ordering (according to the primary sequence). Therefore, the present invention represents the first method to be able to discover such properties and relationships without any inherent ordering (that is to say, pre-ordering) of the data.

Problems solved by technology

The background art does not teach or suggest an efficient, intuitive tool for automated analysis and visualization, which may optionally be performed with little or no manual intervention.
The background art also does not teach or suggest reorganization of distance matrices using the characteristics of the distances themselves.
The background art does not teach how to read the properties and relationships of the data from the reordered distance matrix.
However, when the objects are characterized by continuous variables, e.g. survival intervals of patients or expression levels of genes, any sharp separation into distinct clusters will be rather arbitrary.

Method used


Image

  • Sorting points into neighborhoods (spin)
  • Sorting points into neighborhoods (spin)
  • Sorting points into neighborhoods (spin)

Examples


example 1

Pedagogical Examples

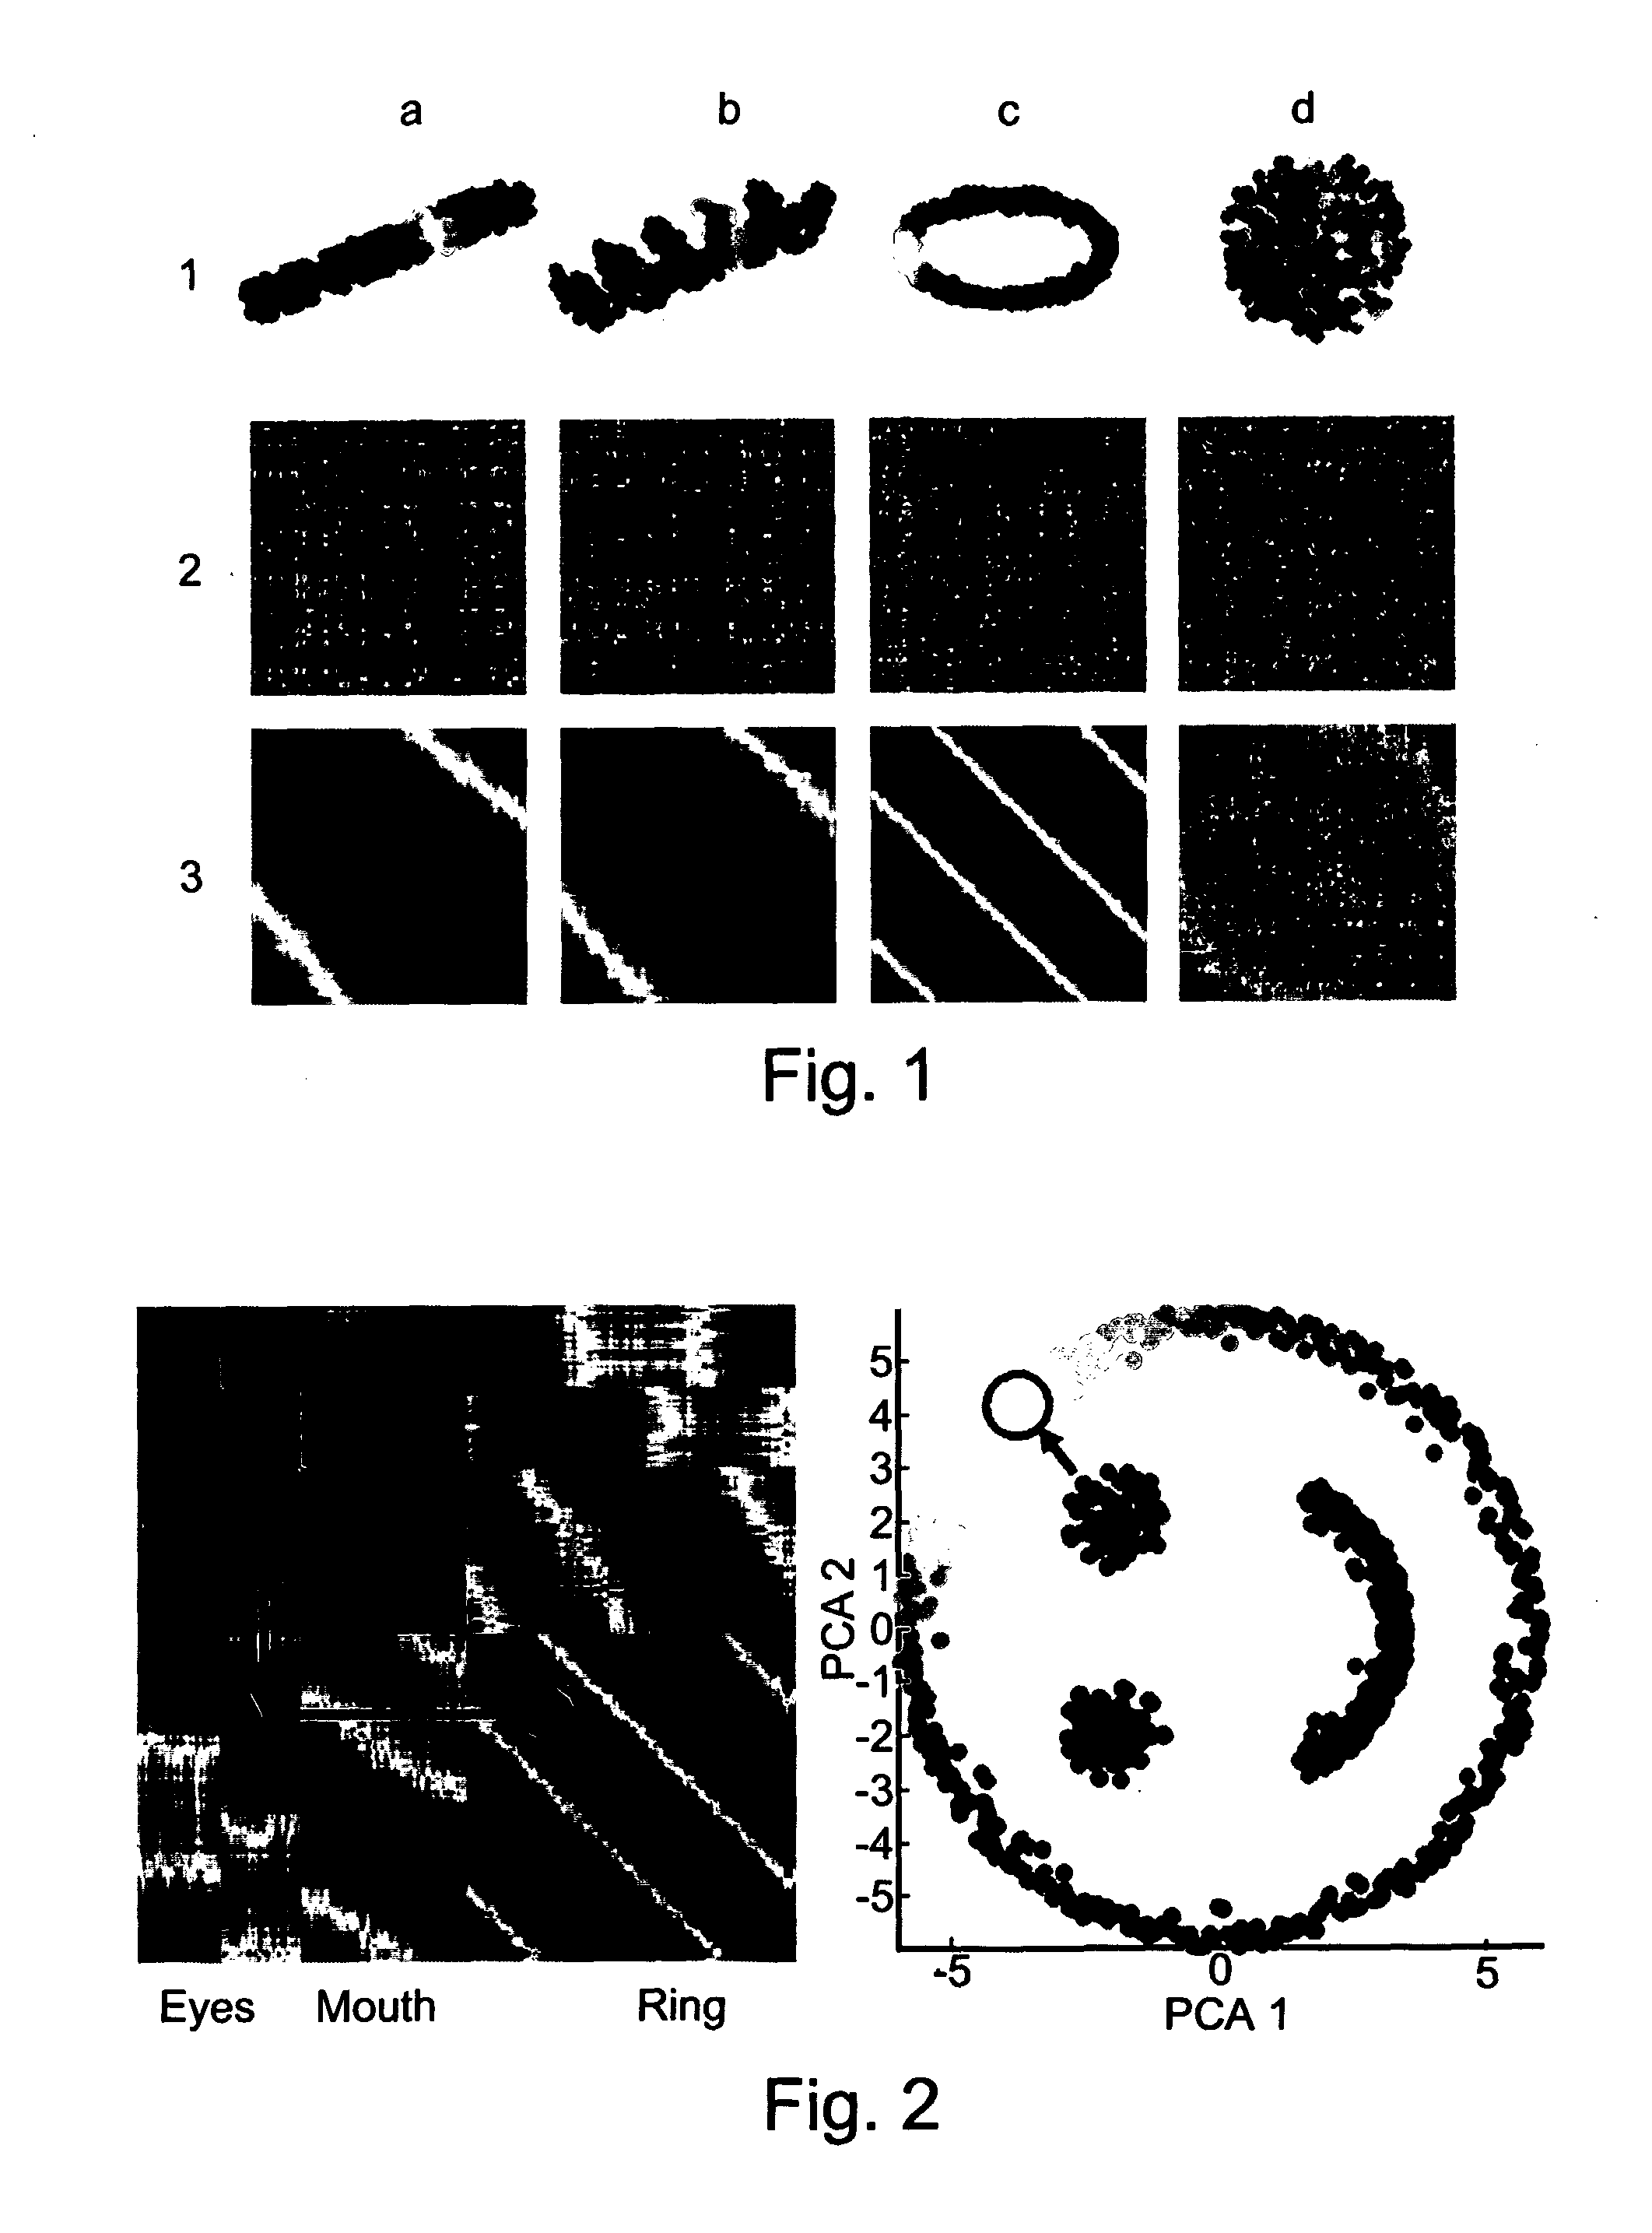
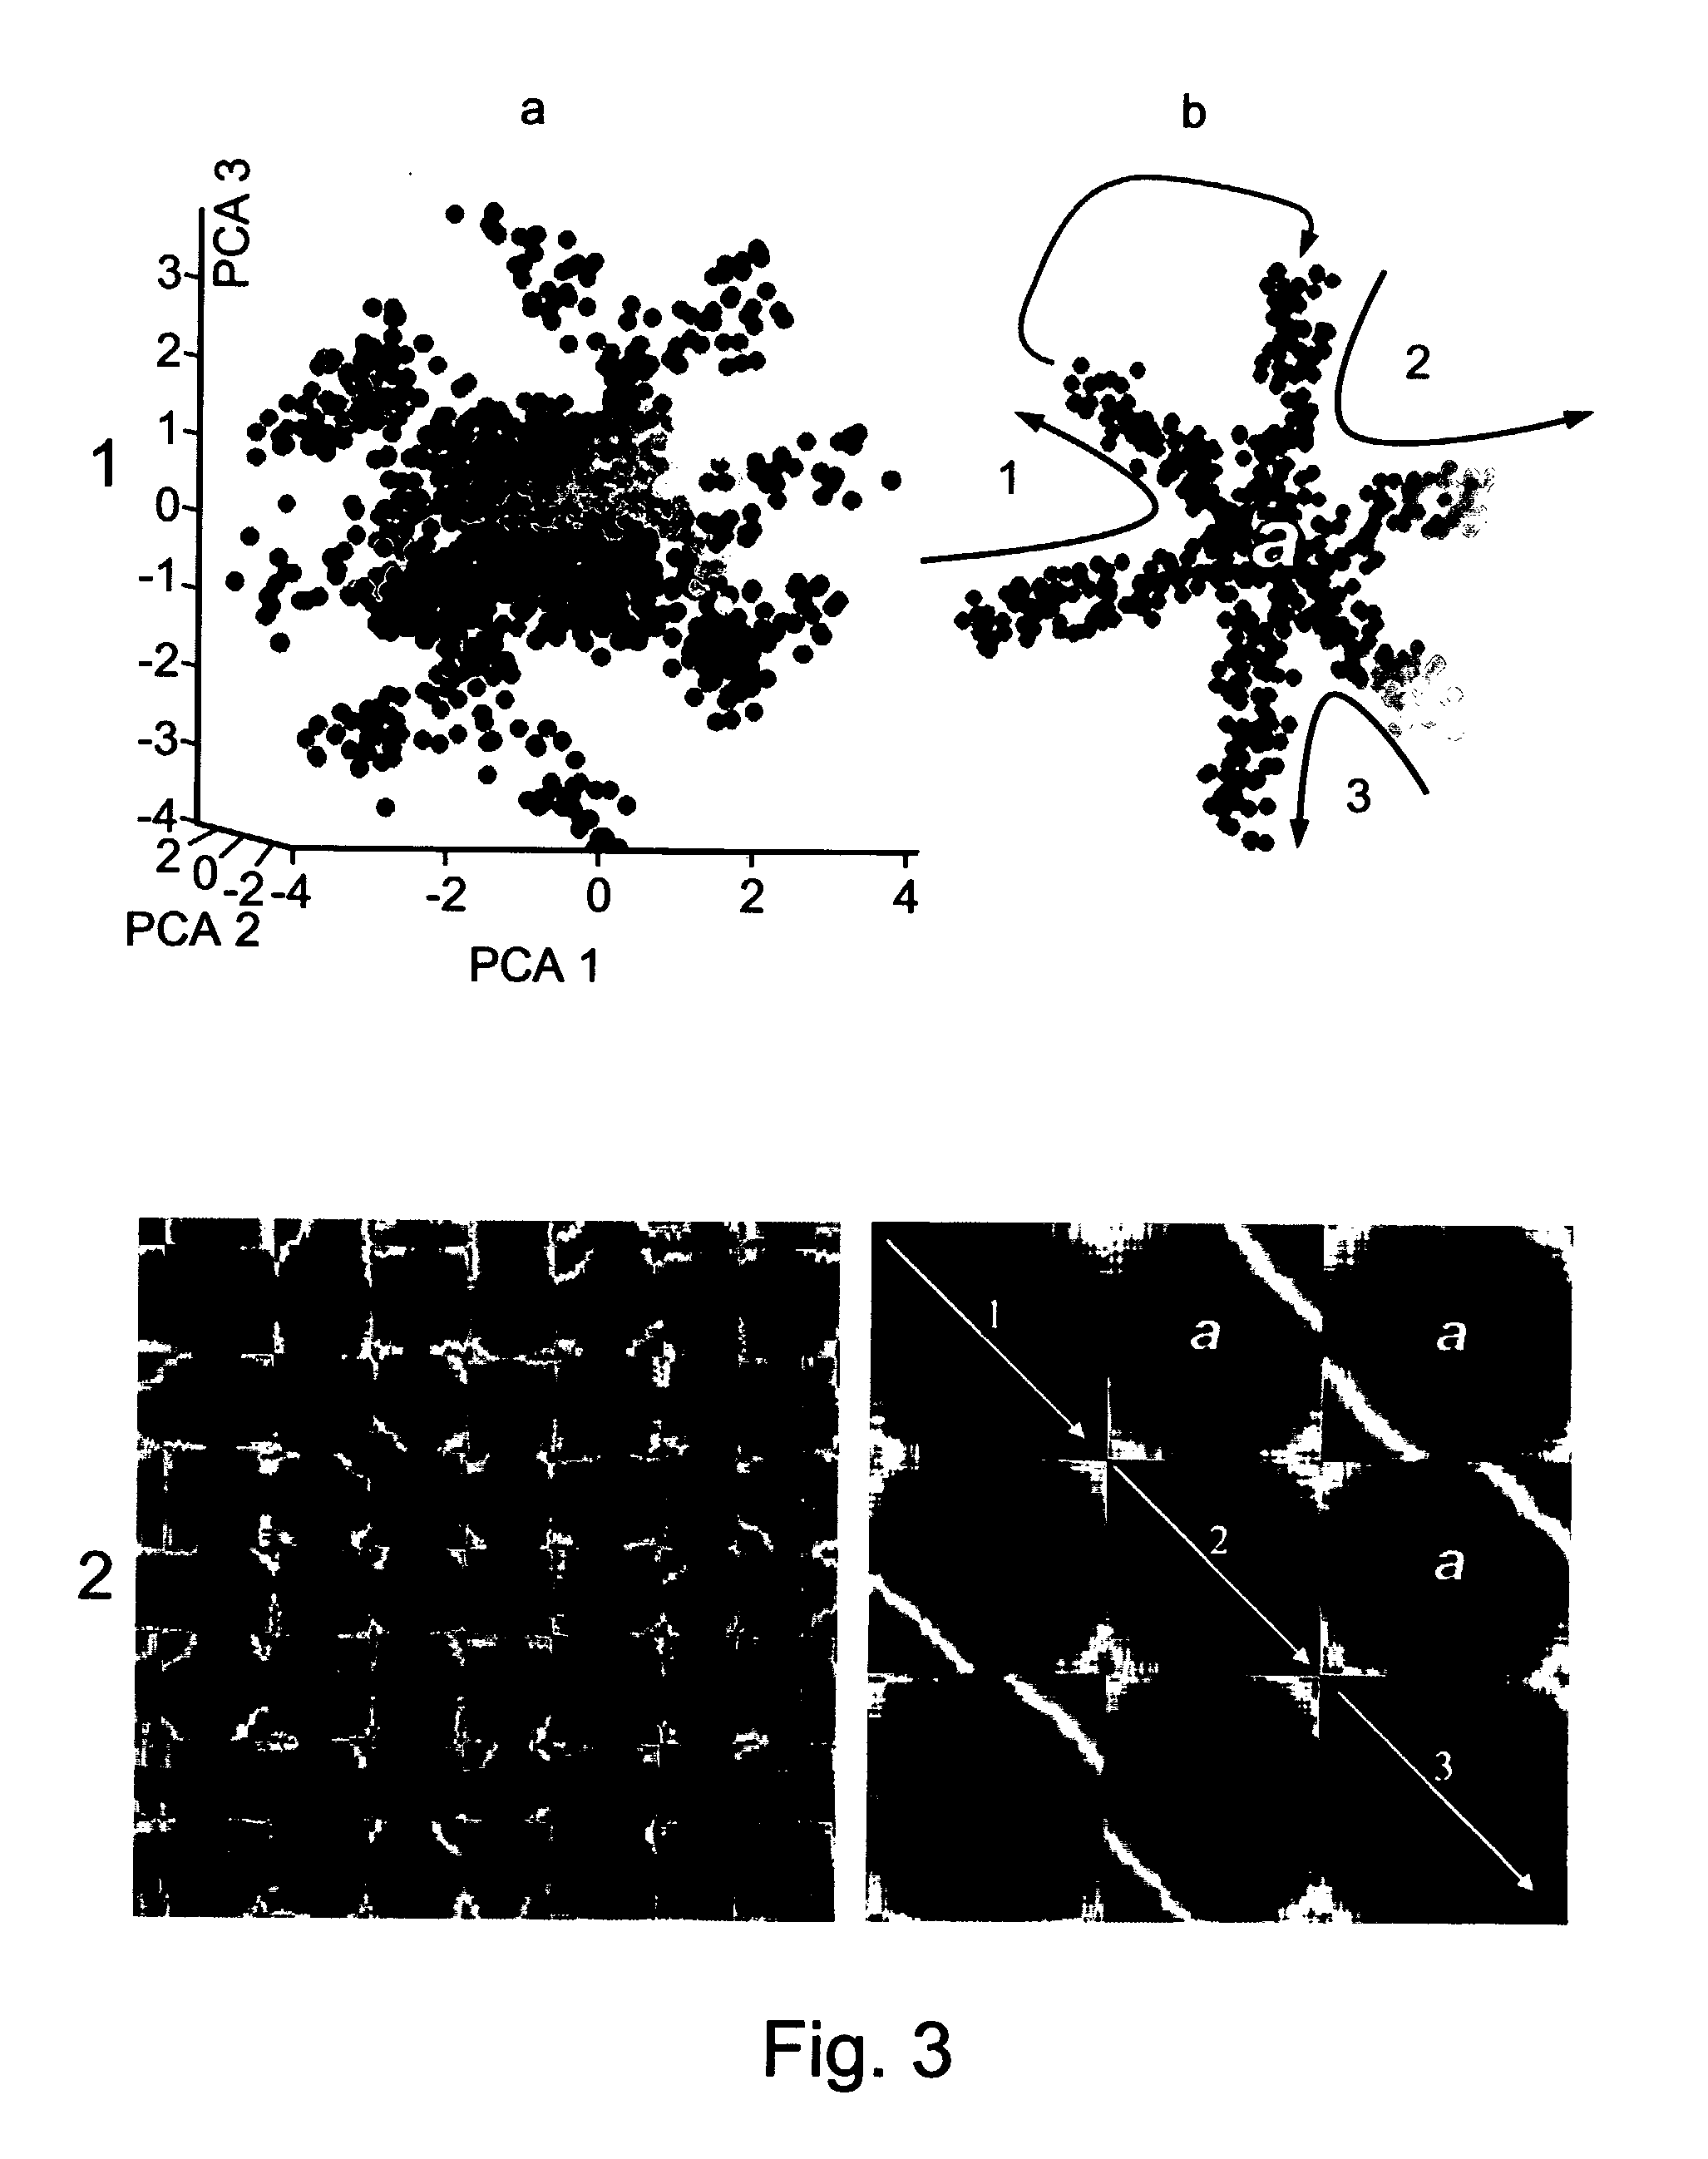
[0028] A properly ordered distance matrix is indicative of the shape of a set of points. All the data sets presented in this article were ordered using SPIN, starting from a random initial permutation. The distance matrices were generated using the Euclidean distance measure, though our methodology can be applied to many dissimilarity metrics. The color of element Dij reflects the relative distance between points i and j, where blue (red) denotes small (large) distances, respectively.

[0029] For explaining the SPIN method, we first address a set of points that form a single object in multidimensional space. The top row (1) of FIG. 1 depicts the placement of n=500 points in d=3 dimensions, for a few toy data sets; below each object (row 2) we show the initial, unordered, distance matrix, while in the bottom row we present the corresponding sorted distance matrix. Although both the ordered and unordered matrices contain exactly the same elements, the sorted distan...

example 2

Illustrative Method

[0036] This Example provides an illustrative method according to the present invention, as a description of a preferred embodiment thereof, the SPIN method.

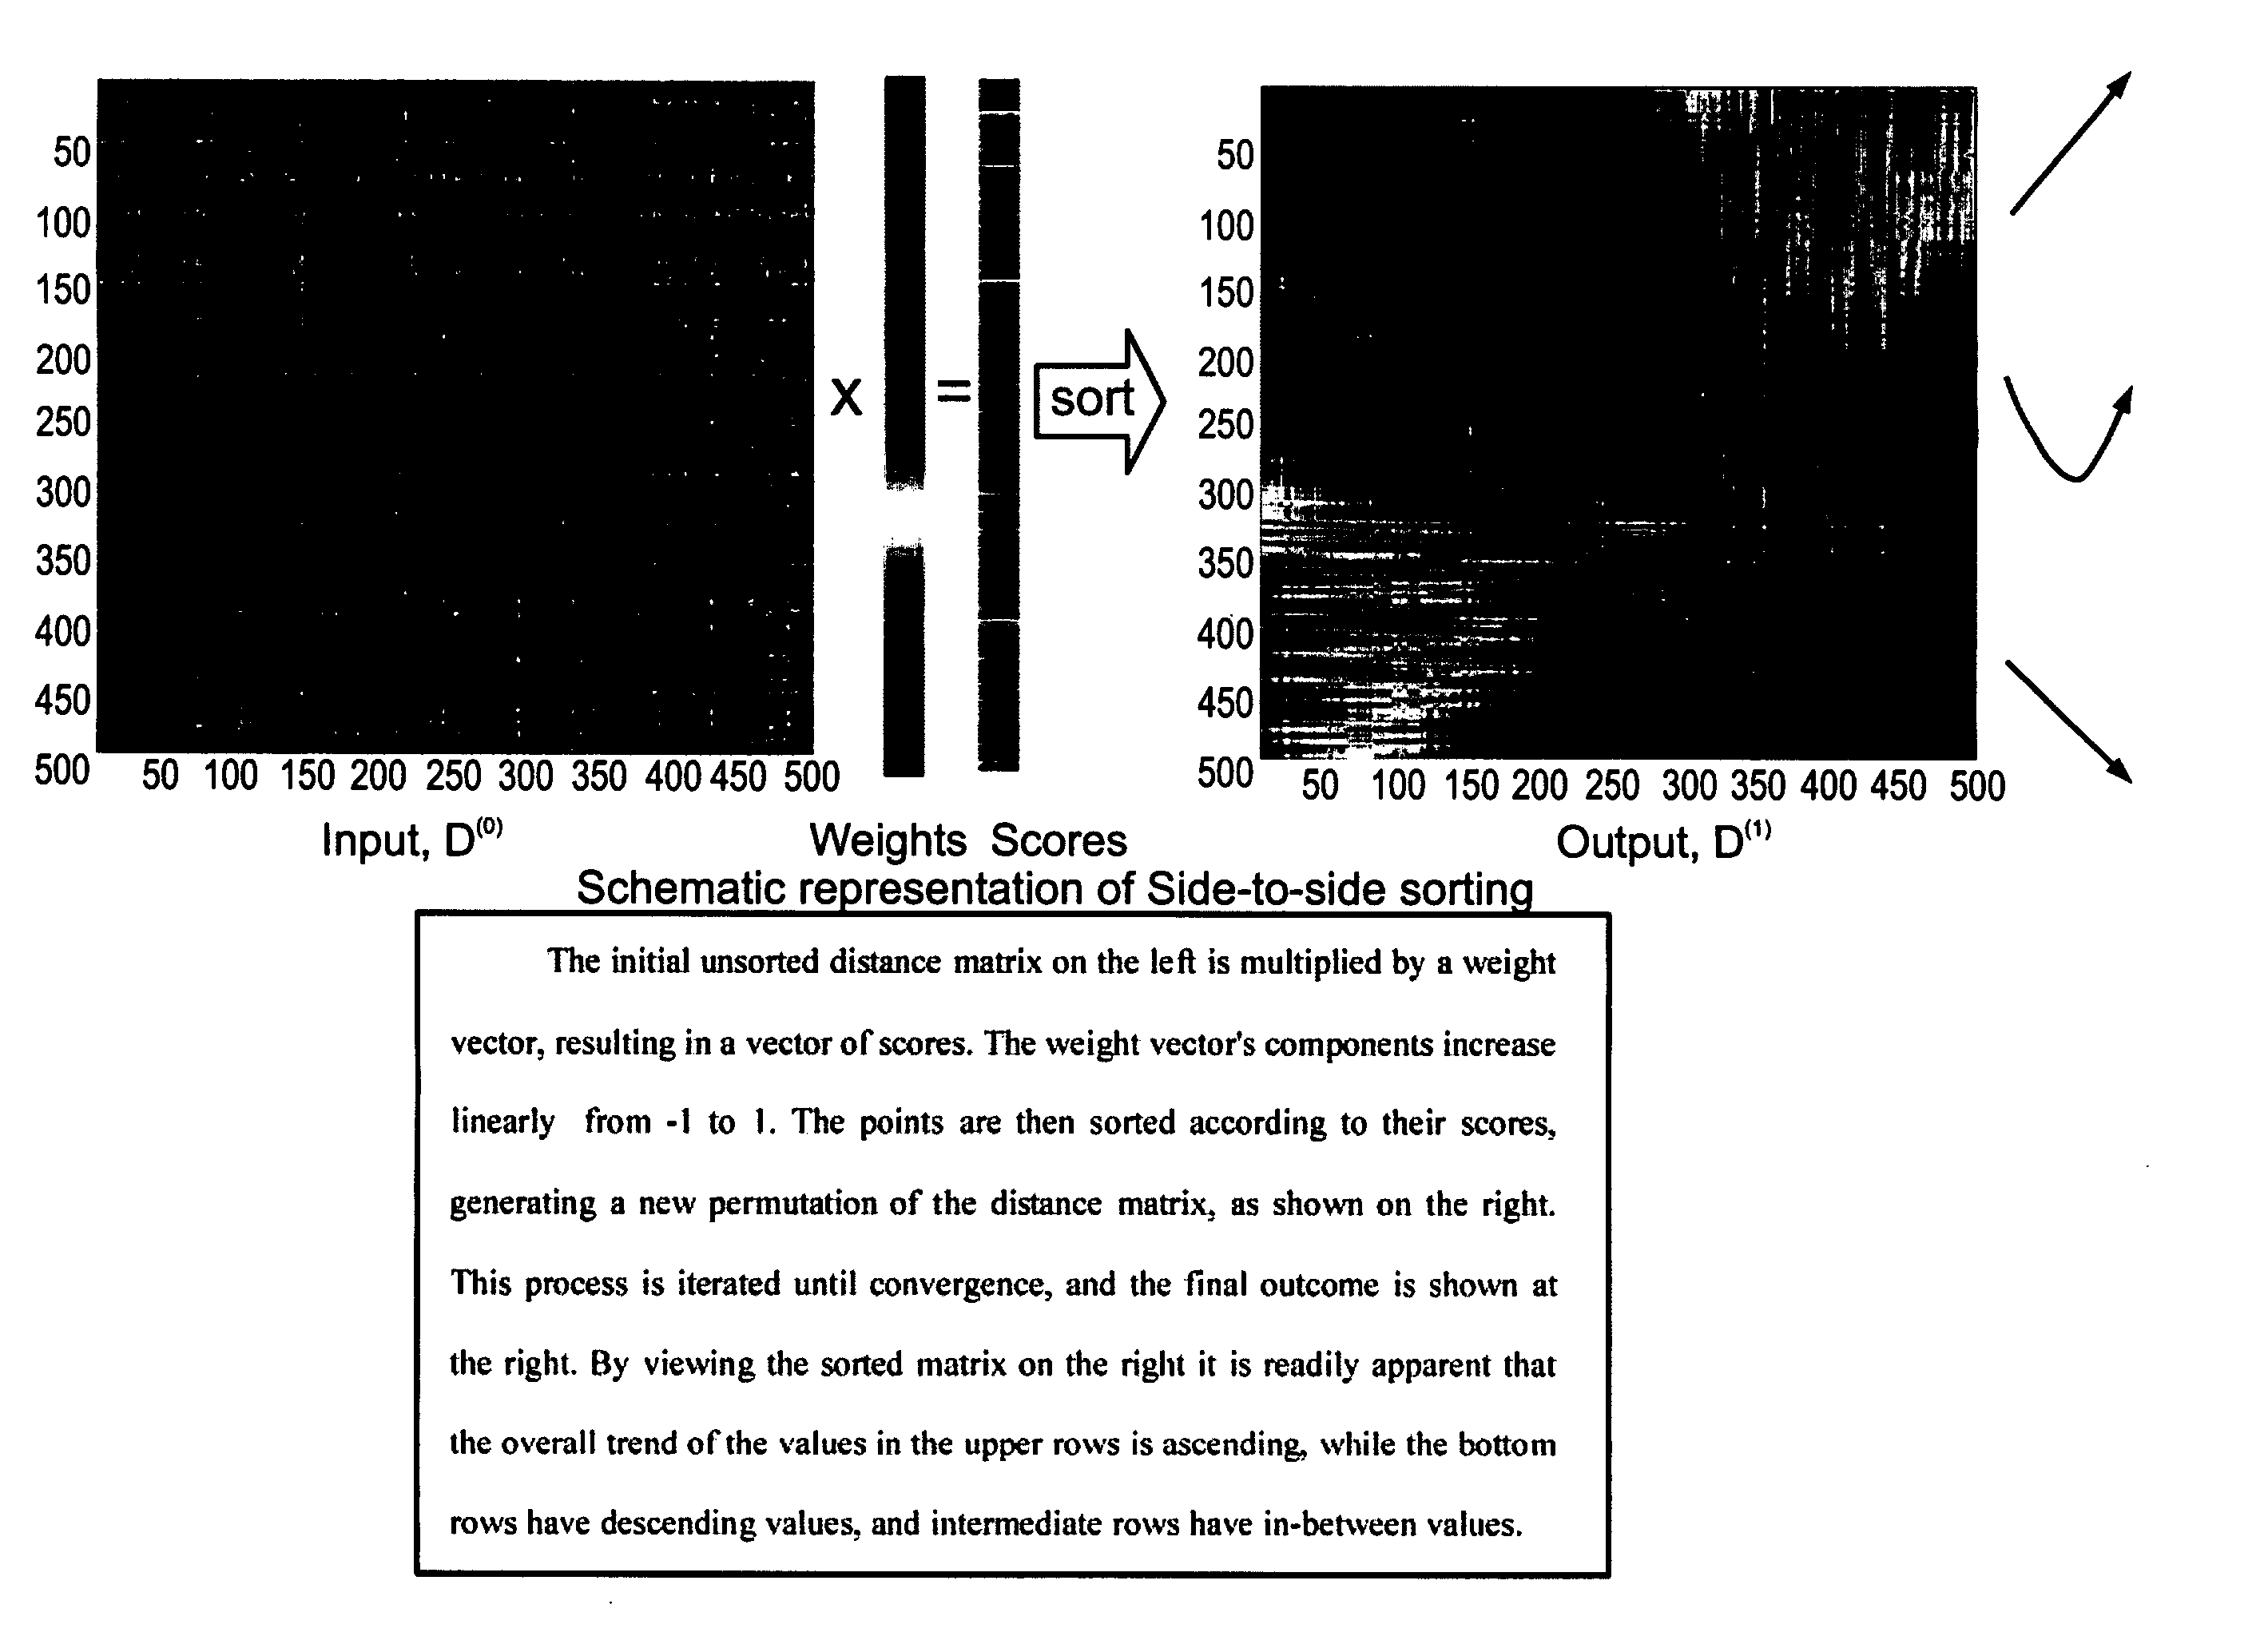
[0037] The input to SPIN is a distance matrix Dn×n calculated for a data set composed of n points, and its output is a reordered distance matrix, obtained by permuting the n objects according to a particular permutation PεSn (the permutation group of n points). We denote by P also the permutation matrix associated with p.

[0038] In order to find criteria for a good ordering, we studied several simple objects characterized by an inherent natural ordering (See FIG. 1a-c). Having observed such ordered distance matrices, we noticed two distinct and sometimes competing properties. First, in many cases the values in the upper rows of a well-ordered distance matrix tend to increase with the column index, while the values in the bottom rows have the opposite inclination. The second property is that the region near th...

example 3

Yeast Cell-Cycle

[0118] A sorting algorithm, such as the one we present, is particularly useful in cases where the effect of some continuous parameter needs to be studied. A specific example of the type of data where this form of analysis may be pertinent is genome-wide experiments. For example, the expression profile of synchronized cells is governed by the time in cell-cycle progression in which a particular sample was harvested. In these cases, SPIN's ability to ferret out elongated structures, even when the elongation refers to a complicated contour embedded in a high dimensional space, is extremely valuable.

[0119] We chose to present here analysis of the yeast Elutriation-Synchronized cell-cycle expression data (taken from [1]). Spellman et al. employed a supervised ‘phasing’ method to assign genes to five known classes, namely G1, S, S / G2, G2 / M and M / G1, utilizing the expression profiles of genes that were previously known to participate in specific phases of the cell cycle. ...


PUM


Abstract

A method for an unsupervised analysis of data according to a reordered distance matrix. According to preferred embodiments thereof, the present invention is useful for large scale multidimensional data, more preferably data having at least four dimensions. The present invention is also preferably used for data comprising a plurality of objects characterized by continuous variables, for example variables having a continuum of possible values rather than a plurality of discrete values.

Description

FIELD OF THE INVENTION [0001] The present invention is of a method for analyzing and visualizing large collections of data. BACKGROUND OF THE INVENTION [0002] Exploratory data analysis is critical in a broad range of research areas, where large collections of data need to be meaningfully arranged and presented. Indeed, a major challenge in the analysis of large-scale multidimensional data is effective organization and visualization. Graphically structured presentation can greatly aid humans in data mining: a clear and interactive display may reveal subtle structure and relationships, and assist in tracking down elusive connections. SUMMARY OF THE INVENTION [0003] The background art does not teach or suggest an efficient, intuitive tool for automated analysis and visualization, which may optionally be performed with little or no manual intervention. The background art also does not teach or suggest reorganization of distance matrices using the characteristics of the distances themsel...

Claims


Application Information

Patent Timeline
IPC IPC(8): G06F17/10G06F7/32G16B25/10G16B40/30
CPCG06F19/20G06K9/6217G06F19/26G06F19/24G16B25/00G16B40/00G16B45/00G16B40/30G16B25/10G06F18/21
Inventor TSAFRIR, ILANTSAFRIR, DAFNADOMANY, EYTAN
Owner YEDA RES & DEV CO LTD
Learn More