
Visualization and Processing of Multidimensional Data Using Prefiltered and Sorting Criteria

a multi-dimensional data and filtering technology, applied in the field of visualizing and processing multi-dimensional data, can solve the problems of not being able to sort single-pixel spectra without additional parameters or human intervention, burdensome processing time, prior art sorting algorithms, etc., and achieve the effect of rapid and efficient extraction of useful information and facilitation of independent sorting and backcoloring of individual groups

Inactive Publication Date: 2007-09-20
KAIROS SCI
View PDF12 Cites 44 Cited by
  • Summary
  • Abstract
  • Description
  • Claims
  • Application Information

AI Technical Summary

Benefits of technology

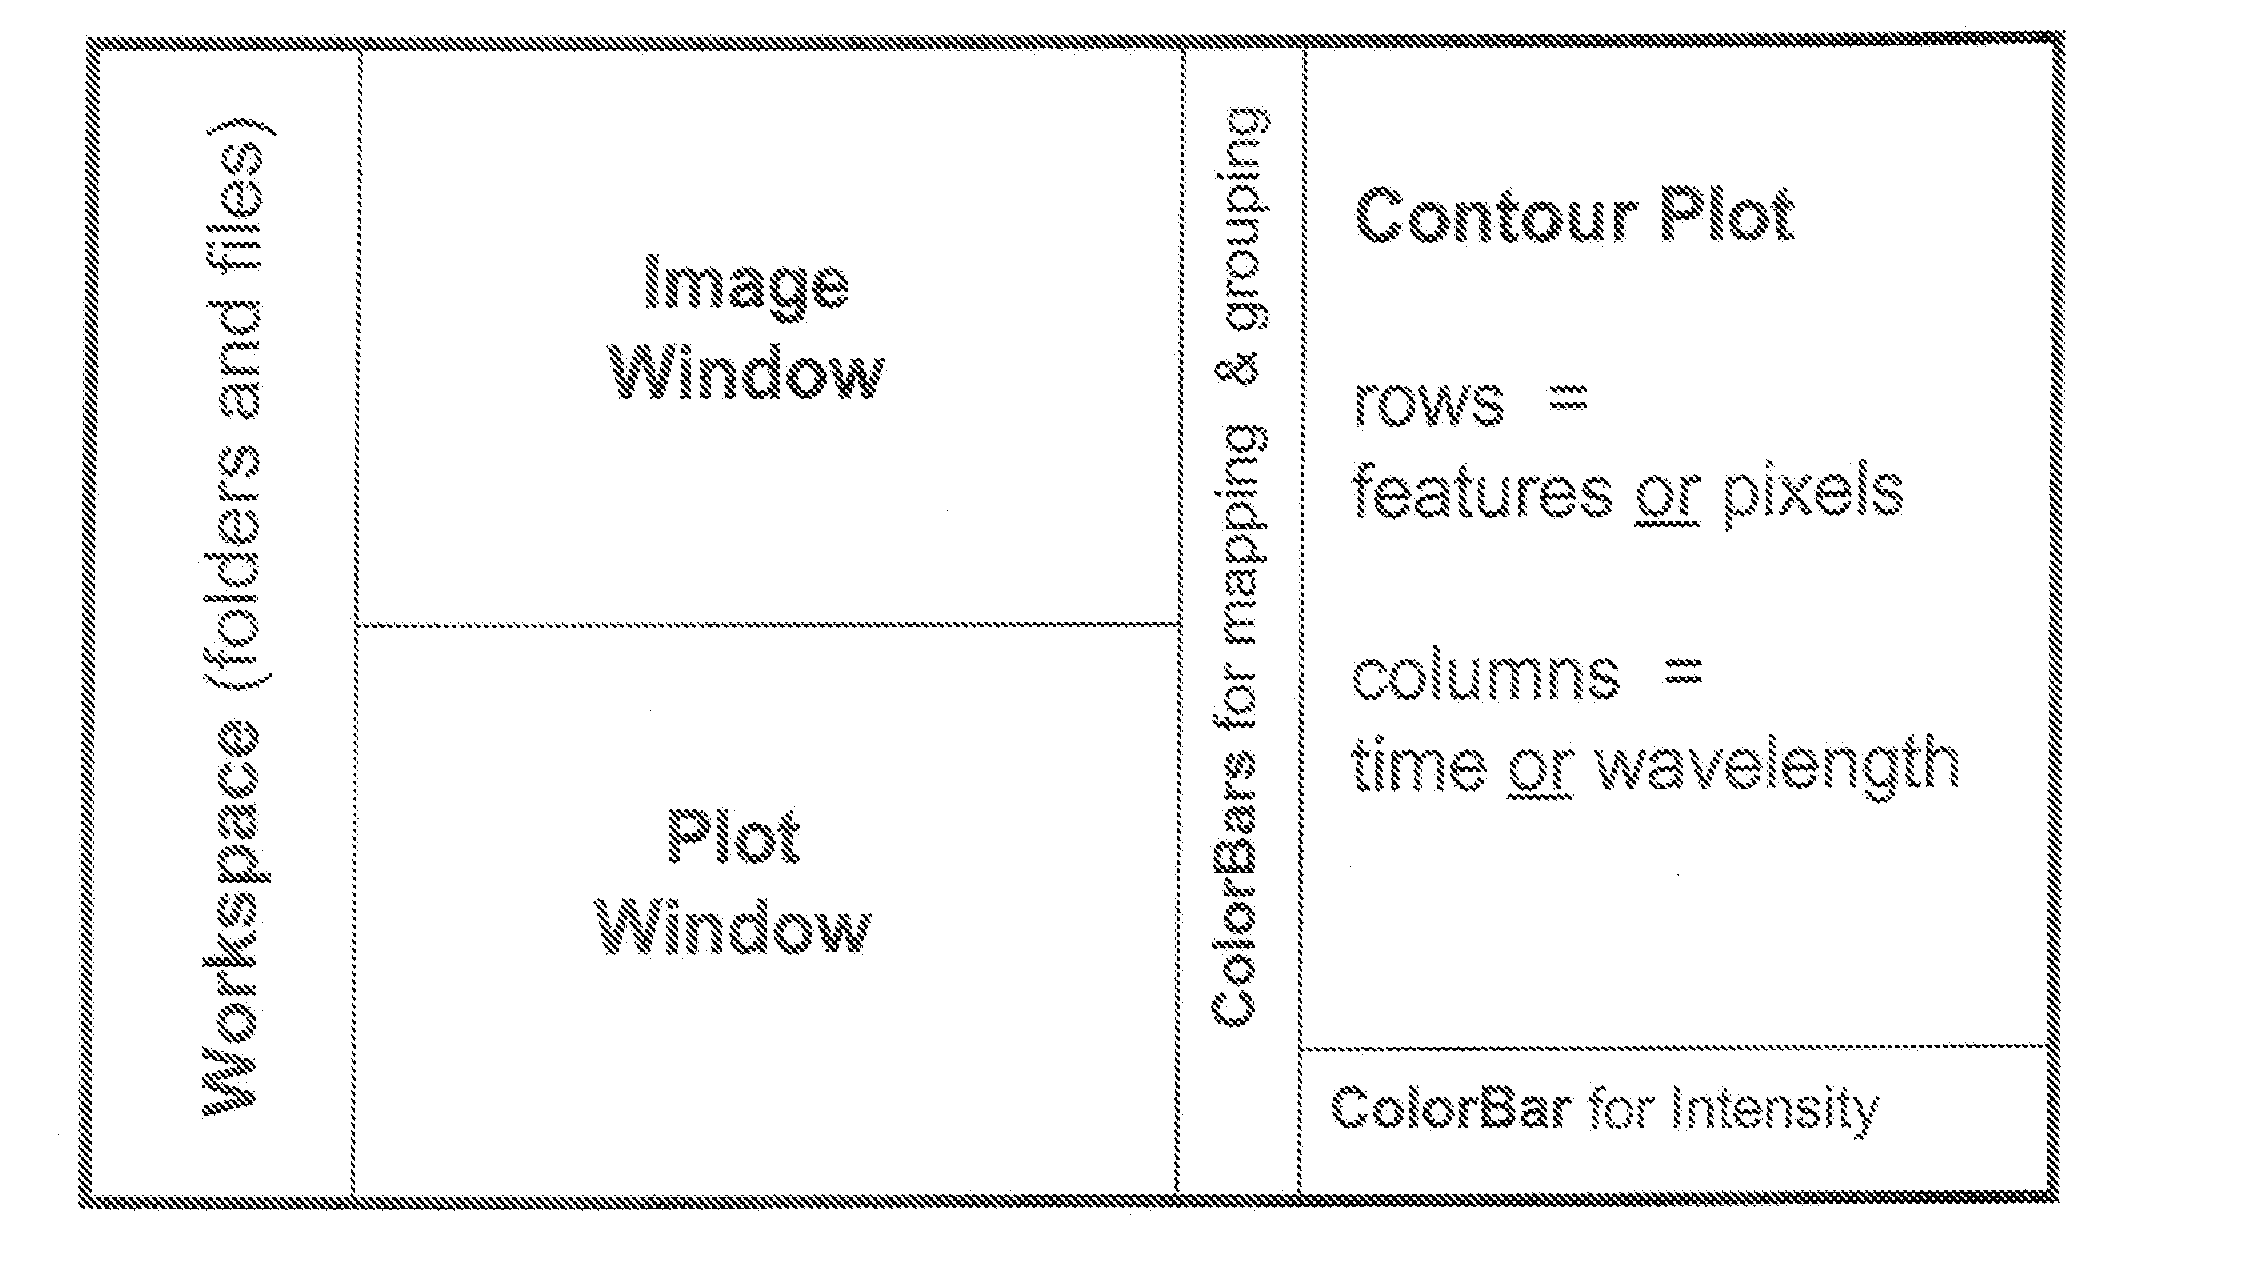
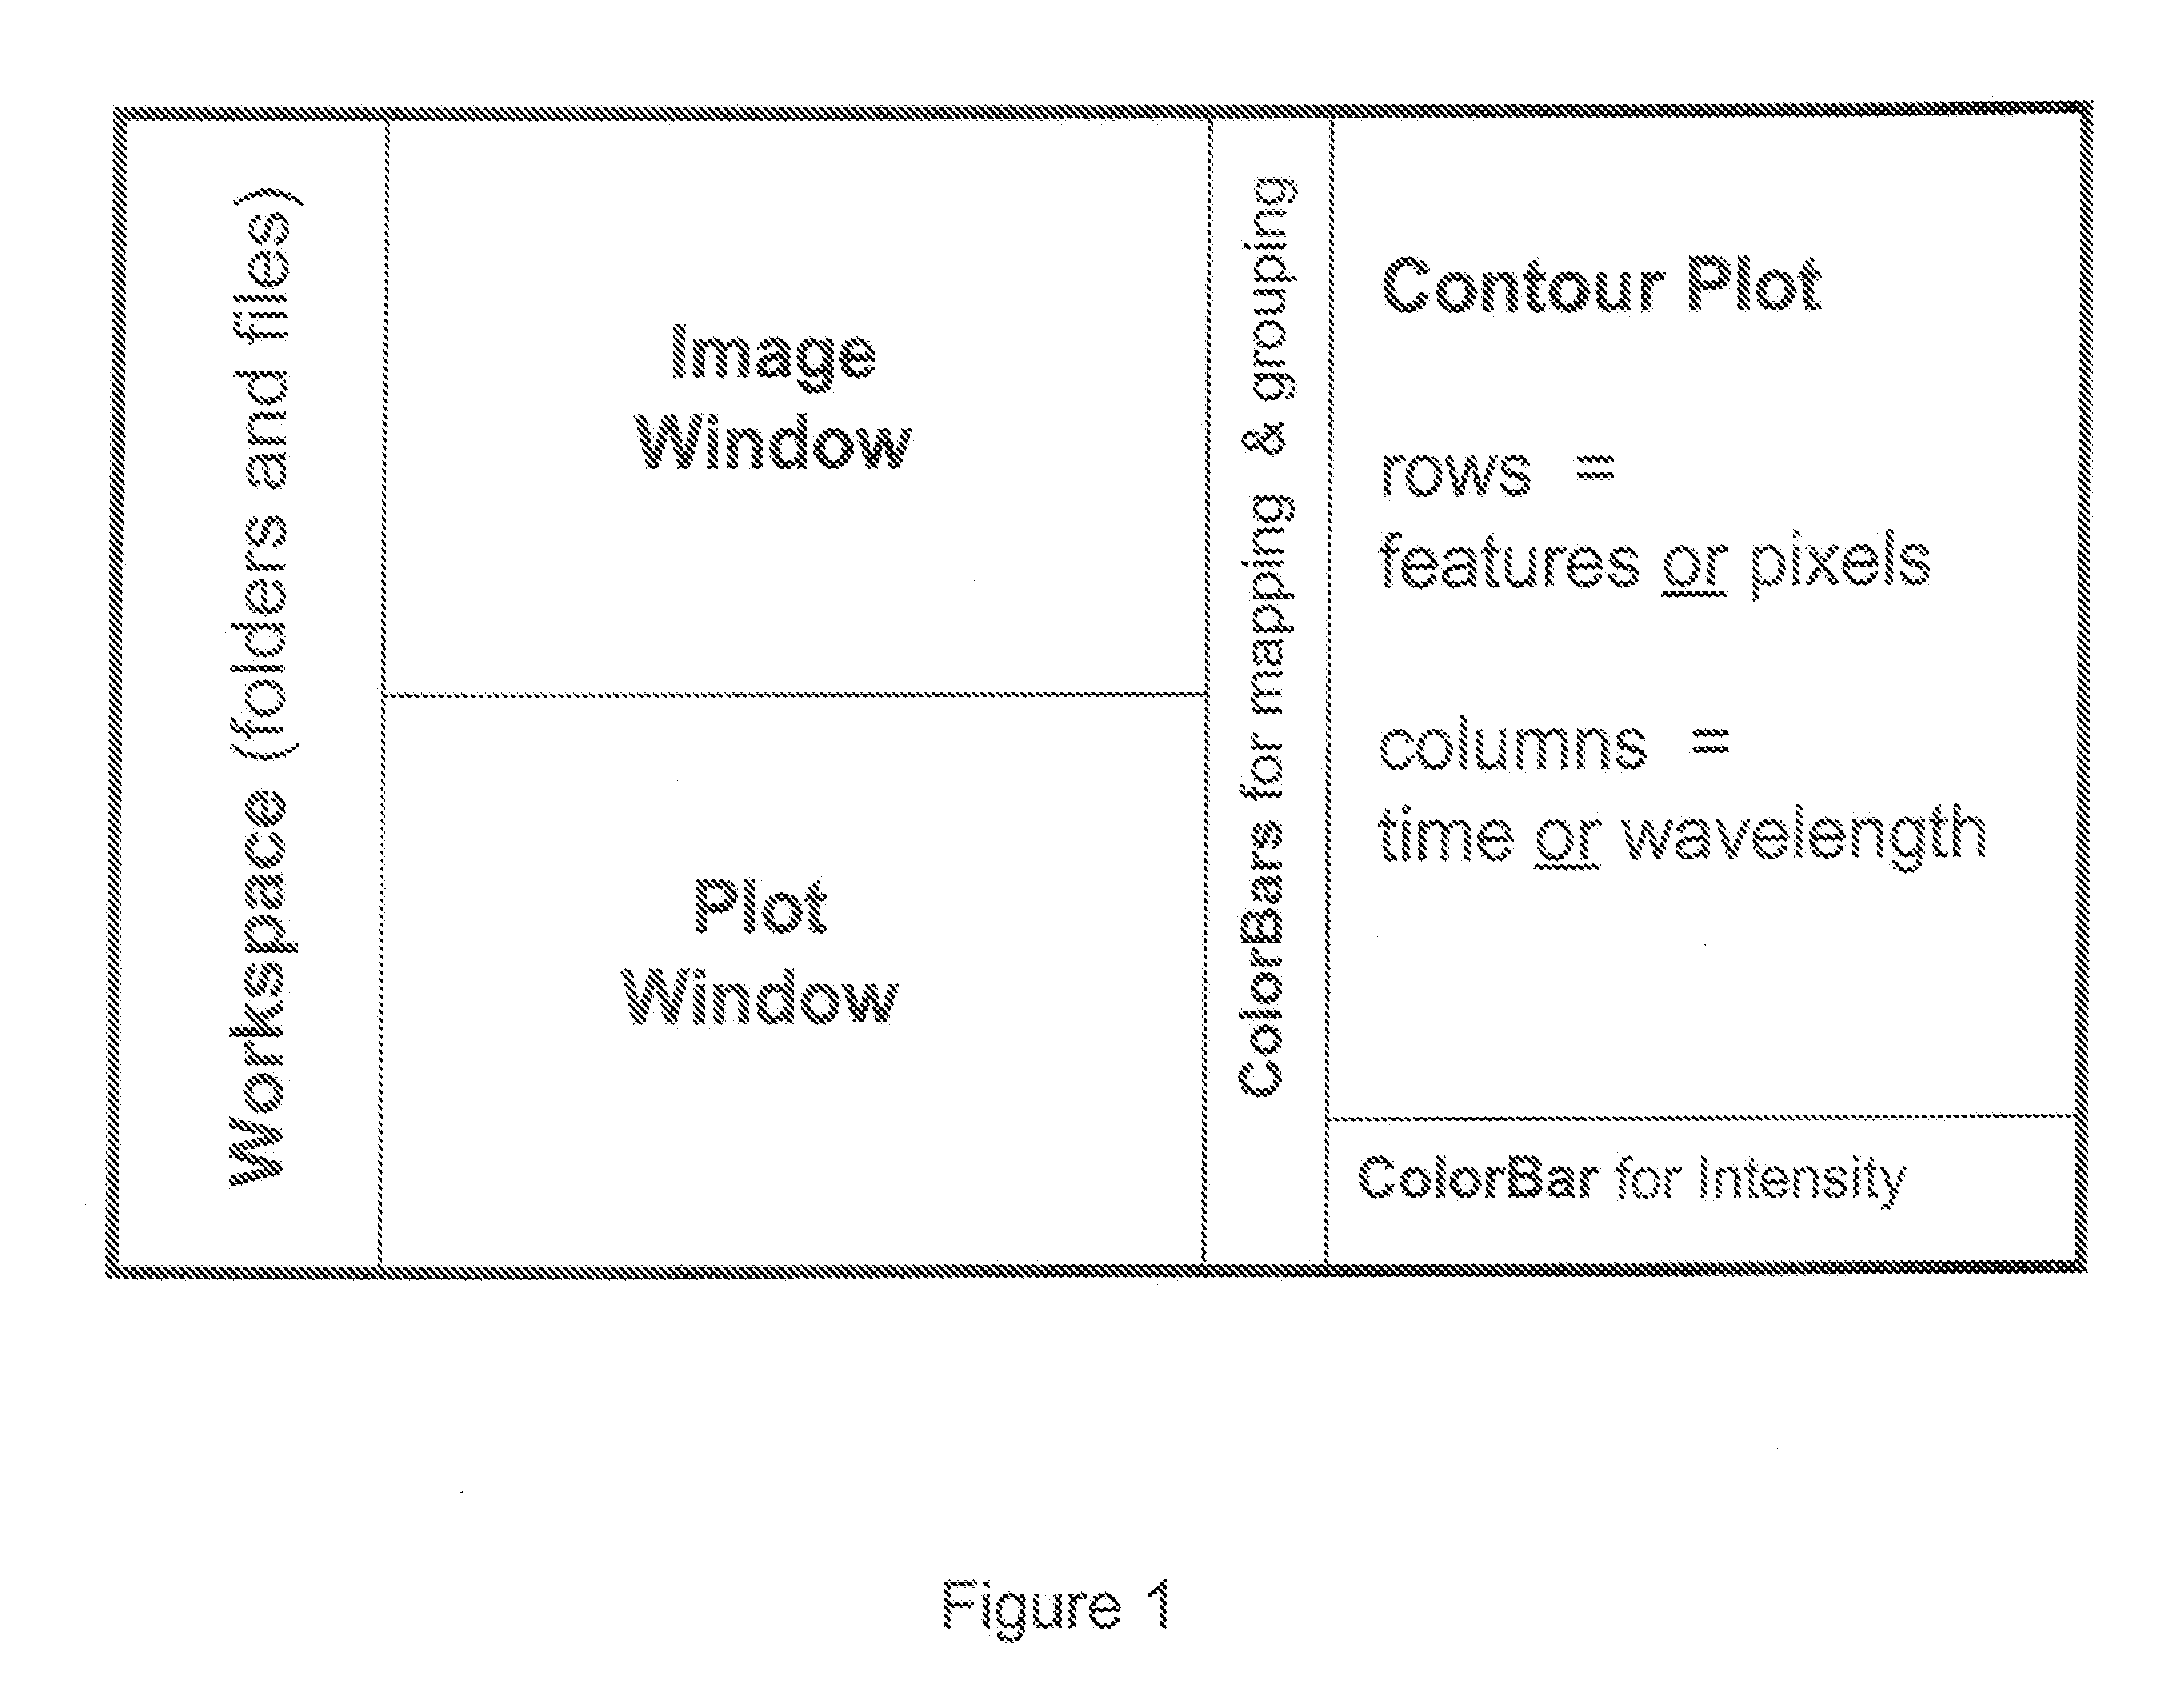
"The present invention provides methods, systems, and computer programs for analyzing and visualizing multidimensional data. The invention allows for the analysis of data from different fields, such as fluorescence emission intensity, absorbance, reflectance, and kinetics. The invention also allows for the simultaneous analysis of multiple data types, such as pixels or features within an image. The invention includes a graphical user interface for display and analysis of digital image data, which provides a reference window and a contour plot window for indicating pixel location and non-positional variables along different dimensions. The non-positional variables can include time, wavelength, temperature, pH, chemical activity, pressure, partial pressure of a gaseous chemical, or ionic strength, among others. The invention also includes a method for performing sequential sorting and back-coloring of pixels or features within an image. Overall, the invention provides a more efficient and effective way to analyze and visualize complex data."

Problems solved by technology

In addition to requiring a burdensome amount of processing time, prior art sorting algorithms that may have been adequate to categorize and classify relatively noiseless feature data are not necessarily successful in sorting single-pixel spectra without additional parameters or human intervention.

Method used


Image

  • Visualization and Processing of Multidimensional Data Using Prefiltered and Sorting Criteria
  • Visualization and Processing of Multidimensional Data Using Prefiltered and Sorting Criteria
  • Visualization and Processing of Multidimensional Data Using Prefiltered and Sorting Criteria

Examples


example 1

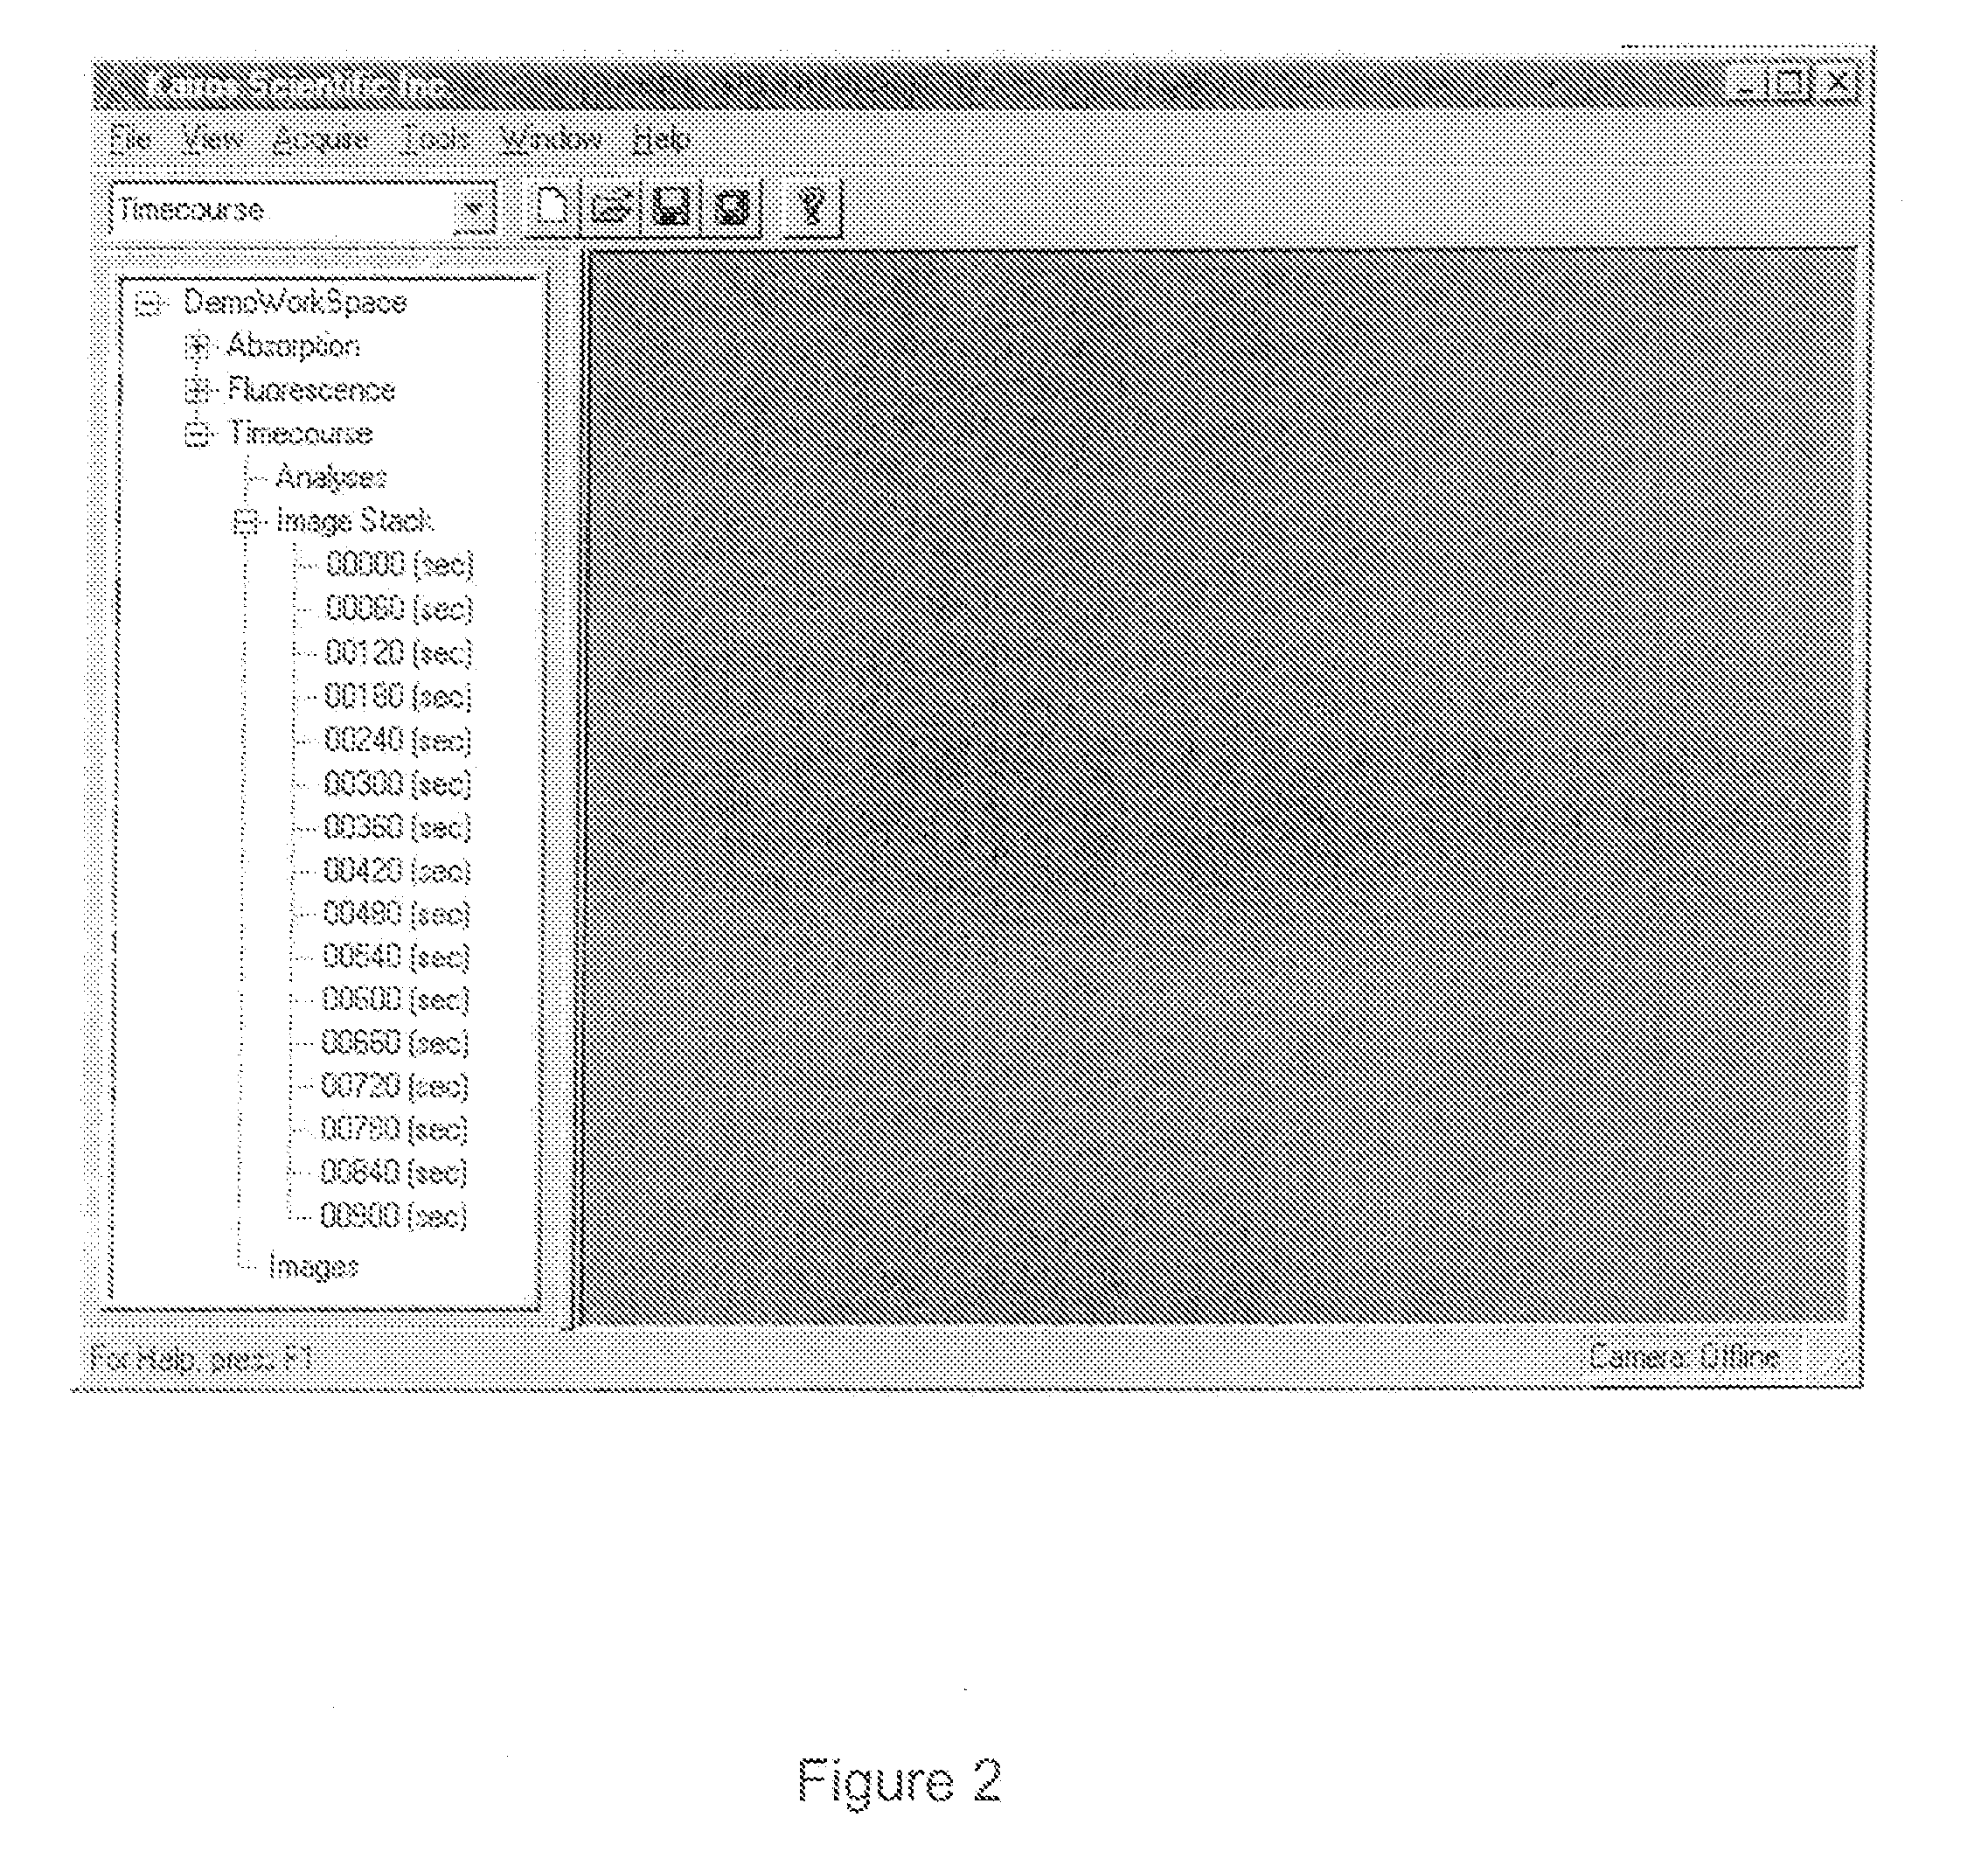
[0070] In this example, an analysis was first performed using the spectral data obtained at the end of a 45 minute kinetic run to select pixels with the greatest 610 nm: 540 nm absorbance ratio. After data acquisition, the following steps were followed: [0071] 1. The 610 nm image from the Absorbance project was flat-fielded with the T0 image from the Timecourse project in order to generate a reference image. [0072] 2. Using this reference image, a pixel-based spectral analysis is created. The software wizard automatically identifies pixels with grayvalues in the lowest tenth percentile. These pixels correspond to the pixels with the highest absorbances at 610 nm. As previously discussed, the user can override these automatic selections by painting on the image or redefining the high and low grayvalue range for ROIs. [0073] 3. A microcolony-free region on the edge of the membrane disk is selected for I0. These values are input into the Beer-Lambert equation to calculate pixel absorba...

example 2

[0079] In this second sorting example, an analysis was first performed using the timecourse data obtained during a 45 minute kinetic run to select pixels meeting specific temporal criteria. In other examples, this kinetic run can be longer or shorter. In this case, the temporal criterion is the fastest absorbance increase at 610 nm. The following steps were followed: [0080] 1. The T=600 second image is flat-fielded with the To image from the Timecourse project in order to generate a reference image. [0081] 2. Using this reference image, a pixel-based kinetic analysis is created. The software wizard automatically identifies pixels with grayvalues in the lowest tenth percentile, corresponding to high absorbance at 610 nm and significant Abg-catalyzed product formation. As previously discussed, the user can override these automatic selections by painting on the image or redefining the high and low grayvalue range for ROIs. [0082] 3. A microcolony-free region on the edge of the membrane...

example 3

[0087] In a third sorting example, spectral data obtained at the end of a kinetic run (or during the run) is used to determine ROIs meeting a specific spectral criteria without performing a complete contour plot based spectral analysis. This is done by generating a reference image from absorbance images as previously described. Using the Abg experiment as an example, the 610 nm image can be divided by the 540 nm image and the pixels with the lowest grayvalues would correspond to the ‘bluest’ pixels. If a satisfactory pixel cutoff value has been previously determined, one can use this cutoff value to select ROIs without performing the entire spectral analysis and sorting described in steps 1-5 of EXAMPLE 1 above. A single reference image based on spectral data is generated and this image is used for the kinetic analysis as listed in steps 7-8.


PUM


Abstract

Complex multidimensional datasets generated by digital imaging spectroscopy can be organized and analyzed by applying software and computer-based methods comprising sorting algorithms. Combinations of these algorithms to images and graphical data, allow pixels or features to be rapidly and efficiently classified into meaningful groups according to defined criteria. Multiple rounds of pixel or feature selection may be performed based on independent sorting criteria. In one embodiment sorting by spectral criteria (e.g., intensity at a given wavelength) is combined with sorting by temporal criteria (e.g., absorbance at a given time) to identify microcolonies of recombinant organisms harboring mutated genes encoding enzymes having desirable kinetic attributes and substrate specificity. Restriction of the set of pixels analyzed in a subsequent sort based on criteria applied in an earlier sort (“sort and lock” analyses) minimize computational and storage resources. User-defined criteria can also be incorporated into the sorting process by means of a graphical user interface that comprises a visualization tools including a contour plot, a sorting bar and a grouping bar, an image window, and a plot window that allow run-time interactive identification of pixels or features meeting one or more criteria, and display of their associated spectral or kinetic data. These methods are useful for extracting information from imaging data in applications ranging from biology and medicine to remote sensing.

Description

RELATED APPLICATION DATA [0001] This application is a continuation of U.S. patent application Ser. No. 10 / 956,878, filed Oct. 1, 2004, entitled “Visualization and Processing of Multidimensional Data Using Prefiltered and Sorting Criteria,” which is a divisional of co-pending U.S. patent application Ser. No. 09 / 767,595, filed Jan. 22, 2001, now U.S. Pat. No. 6,834,122, which claims the benefit of U.S. Provisional Application No. 60 / 177,575, filed Jan. 22, 2000 and U.S. Provisional Application No. 60 / 186,034, filed Mar. 1, 2000, the entire disclosures of which are hereby incorporated by reference in their entirety.STATEMENT REGARDING FEDERALLY SPONSORED RESEARCH OR DEVELOPMENT [0002] The U.S. Government has certain rights in this invention pursuant to Grant No. R44GM5555470 awarded by the National Institutes of Health.FIELD OF THE INVENTION [0003] The current invention relates generally to the visualization and processing of multidimensional data, and in particular, to data formed fro...

Claims


Application Information

Patent Timeline
Patent Type & Authority Applications(United States)
IPC IPC(8): G06K9/68G06T5/00G06T11/20G06V10/58G06V20/13
CPCG06K9/00127G06K9/0014G06K9/6253G06K2009/00644G06K2009/4657G06T7/0012G06K9/0063G06T2207/10016G06T2207/10056G06T2207/30024Y10S707/99937Y10S128/922G06T2200/24G06V20/69G06V20/695G06V20/194G06V20/13G06V10/58G06F18/40
Inventor YANG, MARY M.BYLINA, EDWARD J.COLEMAN, WILLIAM J.DILWORTH, MICHAEL R.ROBLES, STEVEN J.YOUVAN, DOUGLAS C.
Owner KAIROS SCI
Learn More