
Enterprise integrity modeling

a technology of enterprise integrity and modeling, applied in the field of knowledge processing system for risk assessment and analysis, can solve the problems of reducing the value of one or more assets in the set of assets, etc., and achieves the effect of reducing the work load of any single person to report on security measures, reducing the return on investment for the potential project, and reducing the work load

Inactive Publication Date: 2007-05-03
SAP AG
View PDF13 Cites 27 Cited by
  • Summary
  • Abstract
  • Description
  • Claims
  • Application Information

AI Technical Summary

Benefits of technology

[0005] The invention can be implemented to include one or more of the following advantageous features. A potential reduction of risk of one or more assets may be calculated due to the implementation level of each measure. A report may be generated, the report including one or more of the status of each asset or group of assets, the status of each threat or group of threats, the status of each measure or group of measures, or the implementation level for each measure or group of measures, and the report may be displayed to one or more individuals. Each assessment may include three ratings: knowledge, readiness, and penetration. The assessment may be received from e an interview form, the interview form including one or more questions about each measure. The interview form may be completed by an individual with knowledge of one or more measures. The interview form presented to the individual may only includes questions relating to the one or more measures knowledgeable to the individual. The individual may respond to the questions included on the interview form by selecting a color code representing the individual's response. The color code may include the following colors, each color being associated with a numerical rating: red, indicating a low rating of the measure by the individual; yellow, indicating a medium rating of the measure by the individual; green, indicating a high rating of the measure by the individual, white, indicating that the rating of the measure is unknown by the individual, and black, indicating that the measure is not applicable to the individual.
[0007] The invention can be implemented to include one or more of the following advantageous features. Project data representing a proposed project may be received, the proposed project modifying the set of measures by adding additional measures to the set of measures or enhancing one or more measures in the set of measures or both. A return on investment of the proposed project may be calculated based on the modified set of measures and the additional threat. The current status may be represented by a percentage value, with 100 percent representing full compliance with the one or more requirements and 0 percent indicating no compliance with the one or more requirements. The current status may be displayed graphically, wherein the current status is indicated by one of the following colors: red, indicating no compliance or a low level of compliance; yellow, indicating a medium level of compliance; and green, indicating a high level of compliance or full compliance. A report may be generated, the report indicating the level of compliance with the one or more requirements.
[0009] The invention can be implemented to include one or more of the following advantageous features. A cost of the simulated project may be received. A return on investment based on the savings and the cost may be calculated. A report may be generated, the report including the savings caused by one or more simulated projects and / or the return on investment of one or more simulated projects.
[0010] The invention can be implemented to realize one or more of the following advantages. Data relating to security risks and concerns and considerations can be gathered and integrated from a wide array of sources. The individual or individuals responsible for a particular area are automatically informed of risks and concerns that fall within their scope. The workload on any single person to report on security measures is reduced. Reports can be generated that reflect the security and risk situation of an entire organization, including the individual divisions that make up the organization, in addition to reports generated for each individual division. Reports can be generated on a real-time basis, reflecting the most current information available. Predictions and recommendations can be automatically provided based on the information available. The risks and benefits of a potential project can be simulated, and the return on investment for the potential project can be calculated. Potential changes in the physical or regulatory environment can be simulated to determine possible risks, as well as potential measures that can be taken to ameliorate the additional risk. One implementation of the invention provides all of the above advantages.

Problems solved by technology

Threat data representing a set of threats is received; each threat in the set of threats potentially reduces the value of one or more of the assets in the set of assets.

Method used


Image

  • Enterprise integrity modeling
  • Enterprise integrity modeling
  • Enterprise integrity modeling

Examples


Embodiment Construction

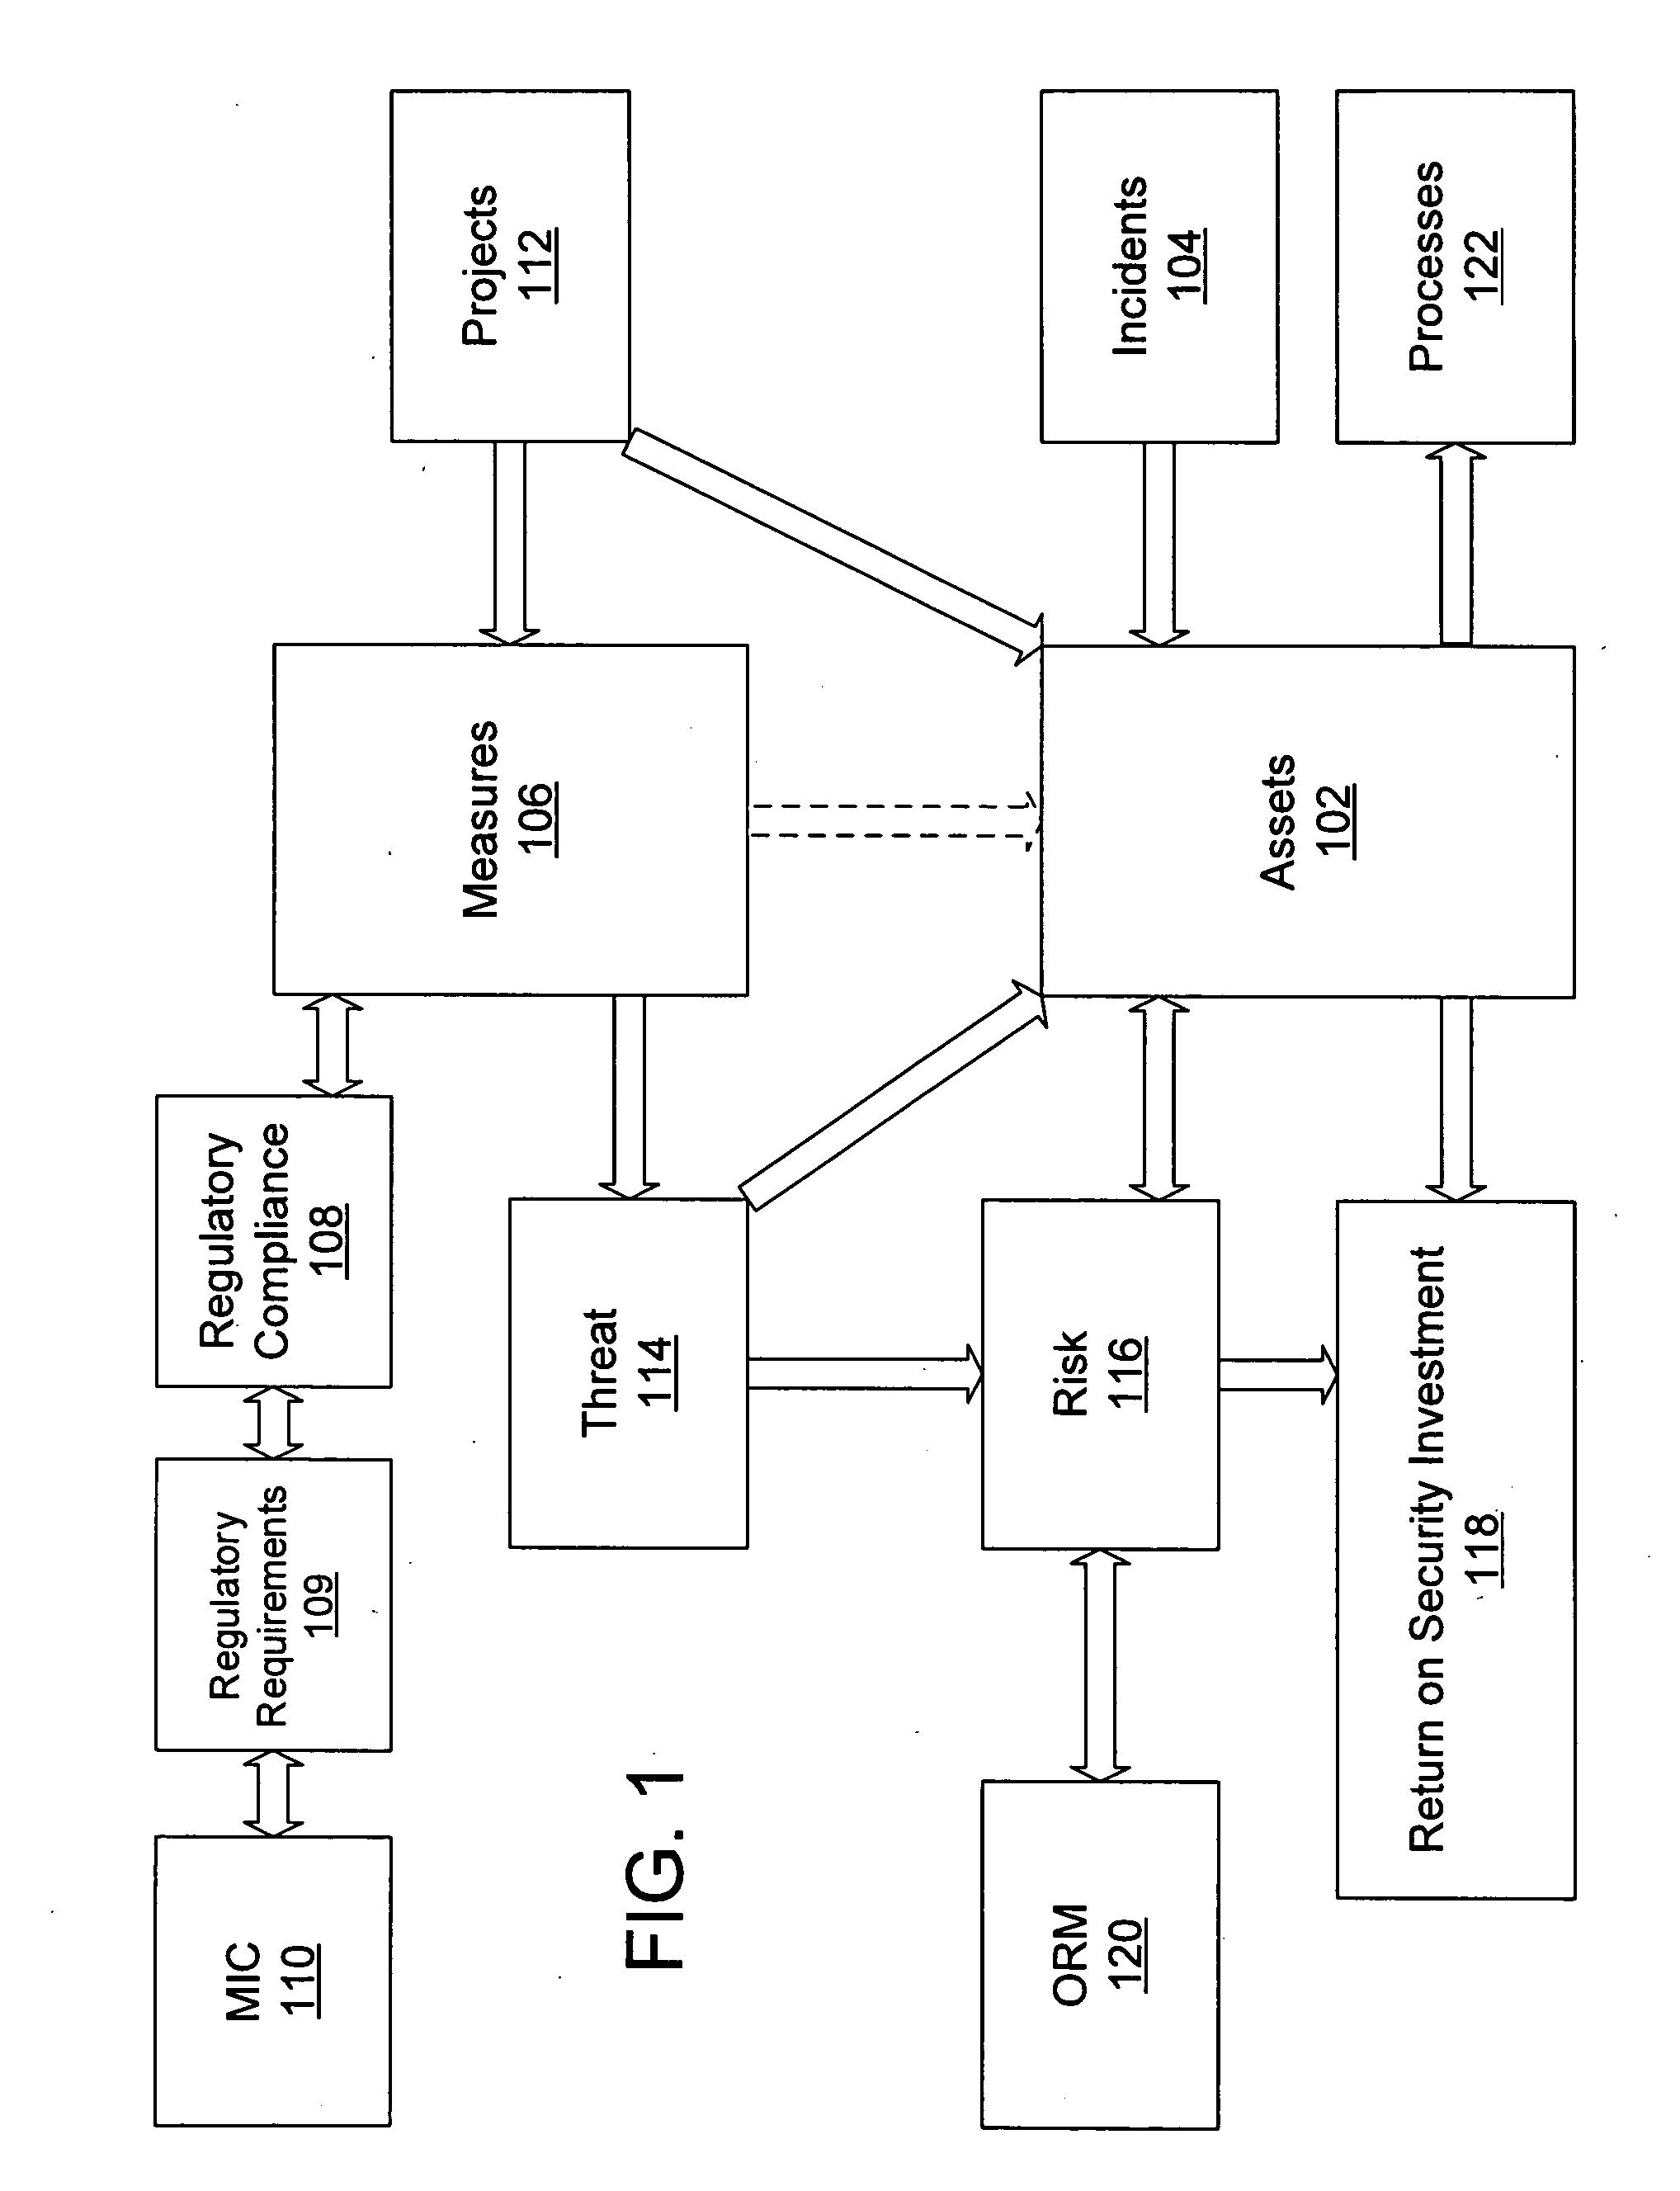
[0022]FIG. 1 illustrates the security-related infrastructure for an organization. The organization has assets 102. Anything that has value to the organization and that requires protection can be an asset. Assets can include tangible and non-tangible items. Examples of possible assets 102 include customer data, a Windows server, facilities / physical plant, employees, shareholder value, and public image. Typically, it is desirable to keep the value of a particular asset as high as possible; alternatively, it is also desirable to keep the total cost of ownership (“TCO”) for a particular asset as low as possible. The assets 102 are used by the organization to support the various processes 122 undertaken by the organization in its ordinary course of business.

[0023] Security related incidents 104 generally lower the value of one or more assets 102. A single incident can lower the value of a single asset, or multiple assets at the same time. For example, a fire at a warehouse lowers the va...


PUM


Abstract

Methods and apparatus, including computer program products, for risk assessment and analysis In one general aspect, asset data representing a set of assets is received, the asset data includes a respective value for each asset in the set of assets having a value. Threat data representing a set of threats is received; each threat in the set of threats potentially reduces the value of one or more of the assets in the set of assets. Measures data representing a set of measures is received; each measure in the set of measures protects the value of one or more assets from one or more threats. Assessment data representing one or more assessments is received; each assessment rates one or more measures. An implementation level for each measure is calculated based upon the assessment data.

Description

BACKGROUND [0001] The present invention relates to a knowledge processing system for risk assessment and analysis. [0002] Risk management is an important consideration for any organization. However, potential risks fall into a very diverse array of categories, including risks relating to information technology (e.g., computer viruses, hackers, etc.), risks relating to physical facilities (e.g., fire, flood, earthquake, burglary, etc.), as well as legal risks (e.g., failure to comply with regulatory requirements). In addition, measures that can be taken to mitigate potential risk can frequently overlap and protect against multiple risks, even across different categories. For example, a security system added to protect a file or web server from physical attacks can protect against hackers gaining physical access to the server, mitigating an information technology risk, as well as protect against burglaries, mitigating a physical facilities risk. [0003] However, different individuals a...

Claims


Application Information

Patent Timeline
IPC IPC(8): G06Q99/00
CPCG06Q10/067G06Q40/00G06Q99/00
Inventor PAULUS, SACHAR M.WAGNER, GUIDO
Owner SAP AG
Learn More