
Three-dimensional structural activity correlation method

Inactive Publication Date: 2006-04-13
NIPPON ZOKI PHARM CO LTD
View PDF1 Cites 1 Cited by
  • Summary
  • Abstract
  • Description
  • Claims
  • Application Information

AI Technical Summary

Benefits of technology

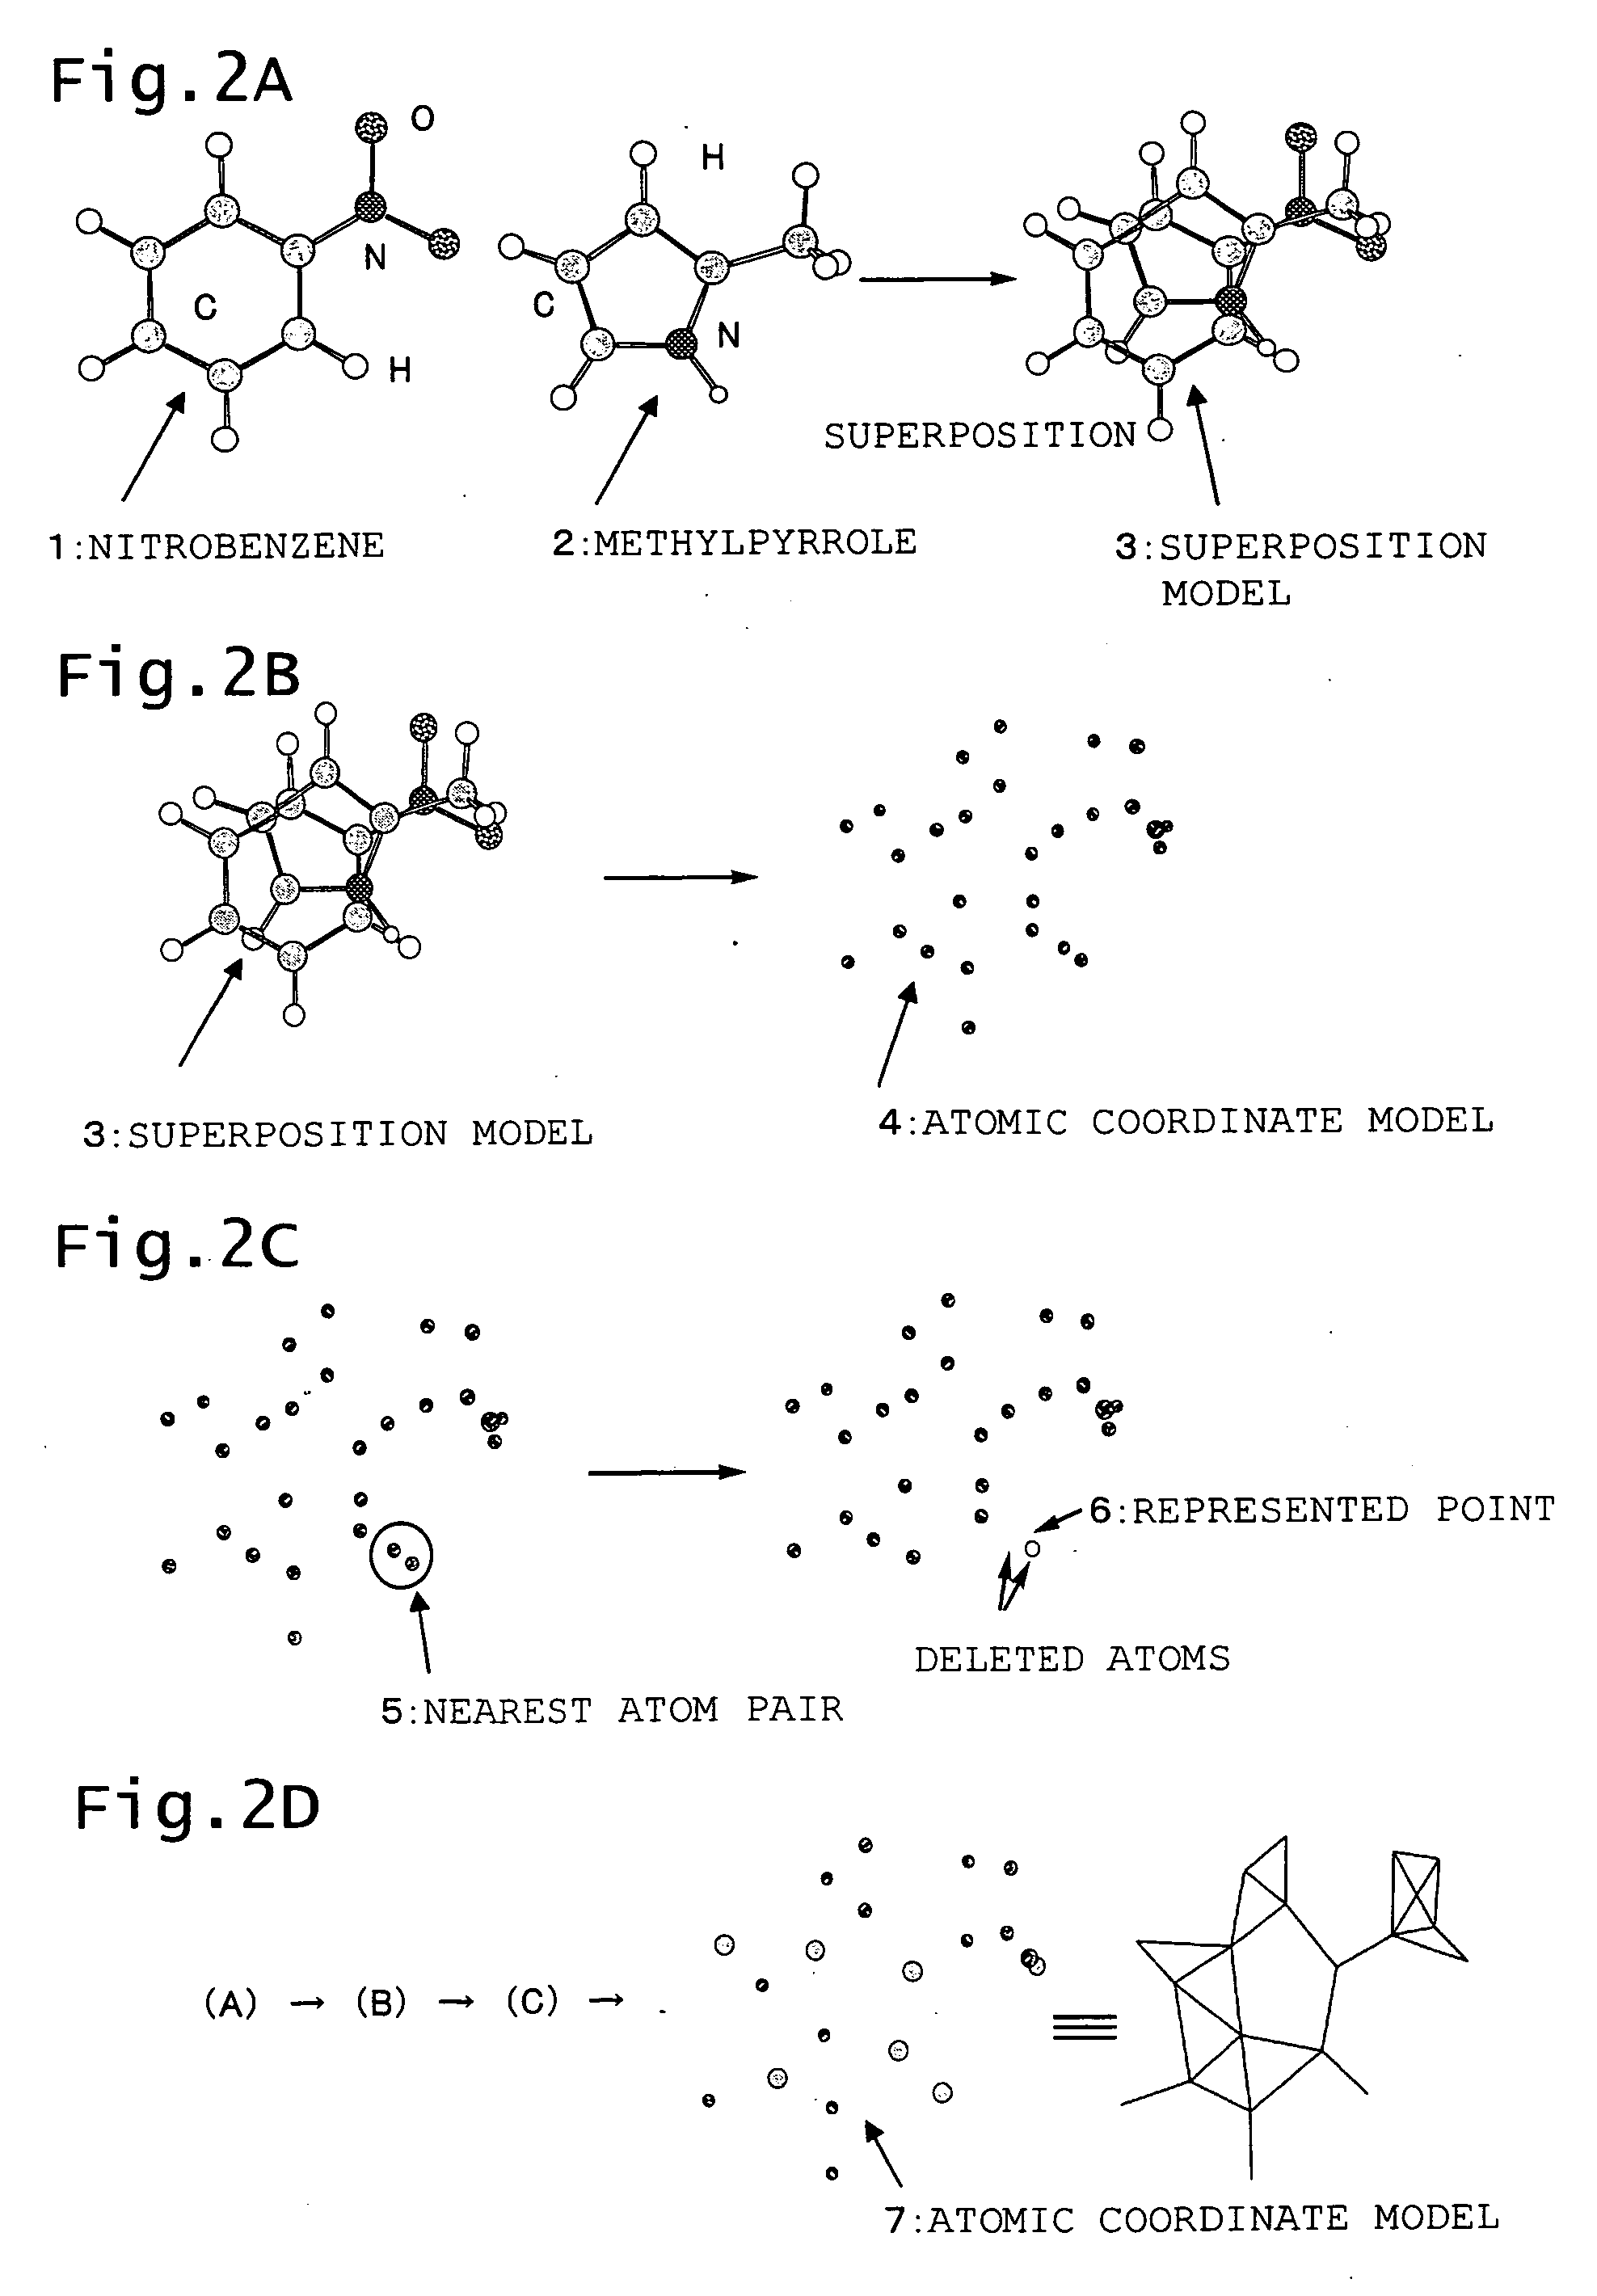
[0042] In this manner, where a pseudo-atom is generated as an imaginary point which represents a functional group, it is possible to decrease the number of the “atoms” used for computing, reduce the amount of computing needed for 3D QSAR analysis, and analyze faster and more conveniently. Whether to set a point which represents a functional group, where to set the point and the like may be determined appropriately depending upon the type of the functional group, parameters to use, etc. In other words, the point which represents the functional group can be set at the center of the functional group, a position which uses weighted average or arithmetic average considering the atomic weight, etc., and plural such points may be set. Further, in the event that molecules have a ring structure, a pseudo-atom may be set additionally at a position which represents the ring structure. In this case, unlike setting of a pseudo-atom for a functional group, the atoms constituting the ring structure are left a the pseudo-atom is additionally set. This permits consideration of characteristics of the ring portion of the molecules and discovery of a more preferable structure-activity relationship. The position at which the pseudo-atom is set may be properly determined in a similar manner to that for setting of a pseudo-atom which represents a functional group.
[0060] When such a three-dimensional quantitative structure-activity relationship method and the program for the same are used, instead of generating lattice points around molecules as in CoMFA, CoMSIA and MFA, represented points for calculation of interactions are generated inside the molecules, and hence, the number of points needed for computing is greatly reduced. This remarkably reduces the amount of computing and a memory area required for 3D QSAR analysis.
[0062] Further, use of an evaluation formula, a Gaussian evaluation formula or indicator coefficients in a rapid molecular superposition approach for calculation of interactions makes it possible to avoid singularities, cut-off, etc.

Problems solved by technology

However, although completing superposition in a short period of time, the approach of superposing atoms with each other or functional groups with each other has a disadvantage that researcher's subject is inevitably reflected.
Meanwhile, an approach of automatically extracting functional groups using a computer still has a problem that selection of the types and number of functional groups to be superposed is susceptible to the arbitrariness of software dependency, researcher's subject, etc.
Although an approach using an evaluation function is ideal as a molecular superposition procedure per se, this approach has a flaw that computation takes time.
However, there are only few integrated molecular design packages for 3D QSAR that can be executed on a standard PC, and further, since such a 3D QSAR analysis method is available as a dedicated module of an integrated molecular design package and therefore it is not possible to obtain only this.
In addition, most 3D QSAR analysis methods are very often run on expensive general purpose computers, workstations, etc.
This makes it difficult for a synthetic chemist to conveniently perform 3D QSAR while conducting a test and apply this to optimization of a target compound.
Hence, while realizing analysis of only a group of compounds having relatively similar skeletons, the method has a disadvantage that QSAR analysis can not be made on a group of compounds having functional groups to which parameters have not been assigned.
The greatest defect is that this method is not applicable to three-dimensional QSAR analysis.
In addition, since the gradient of the potential is different between a Lennard-Jones potential and a Coulomb potential, there is a disadvantage that the distances from a molecule which is cut off are different.
), HASL needs a dramatically smaller number of lattice points, about one hundred, which permits computation on a standard PC but yet has a similar problem to those with CoMFA, CoMSIA and the like in that creation of lattice points is still arbitrary.
As for a derivative for which the HASL atom type is not defined, it is not possible to conduct QSAR analysis.
However, although these computation methods are convenient and have been used for superposition of derivatives, these computation methods have a disadvantage that a result becomes different depending upon how physiochemical properties are defined.
(a) Since thousands lattice points need be created, the amount of computing increases, a large memory area is necessary and it is not possible to run 3D QSAR analysis on a standard PC.

Method used


Image

  • Three-dimensional structural activity correlation method
  • Three-dimensional structural activity correlation method
  • Three-dimensional structural activity correlation method

Examples


example 1

Generation of Represented Points Based on Atomic Coordinates of Superposed Molecules

1-A) Use of Rapid Molecular Superposition Evaluation Formula

[0138] After superposition, 0.3D QSAR analysis using molecular superposition method discussed in Kotani, T.; Higashiura, K. Rapid evaluation of molecular shape similarity index using pairwise calculation of the nearest atomic distances. J. Chem. Inf. Comput. Sci., 2002, 42, 58-63. was conducted. FIG. 9 shows the PLS analysis result. In FIG. 9, r2 is a multiple correlation coefficient, q2 is cross-validated r2, and 1−(n−1) (1−q2 / (n−c) is an evaluation function expressing the optimal number of components proposed by Tropsha et al. In this example, q2 has the maximum value when the number of components is 2, holding that this is a reliable model.

[0139]FIG. 10 is visualization of the computed result. In FIG. 10, the green portions are regions where the activity will be enhanced sterically, i.e., a sterically demanding substitutional group wi...

example 2

Generation of Represented Point with Addition of New Point at Position Representing Ring

[0143] A new point (pseudo-atom) wad added in a central section of a ring as a position which represents the ring, and similar computing was conducted. Addition of the pseudo-atom is expected to improve the accuracy of superposition and yield a more precise 3D QSAR result.

2-A) Use of Rapid Molecular Superposition Evaluation Formula

[0144] The same result as the 1-A result was obtained. This means that the rapid molecular superposition method which the inventors have developed is so accurate that it is not necessary to insert a pseudo-atom and permits superposition of molecules at a high accuracy.

2-B) Use of Seal-Type Evaluation Formula

[0145] After superposition with a pseudo-atom inserted at the center of a ring, 3D QSAR analysis was conducted using the SEAL-type evaluation method. FIG. 20 is a graph of r2, q2 and 1−(n−1) (1−q2) / (n−c). In this case, as q2 has the maximum value when the numb...


PUM


Abstract

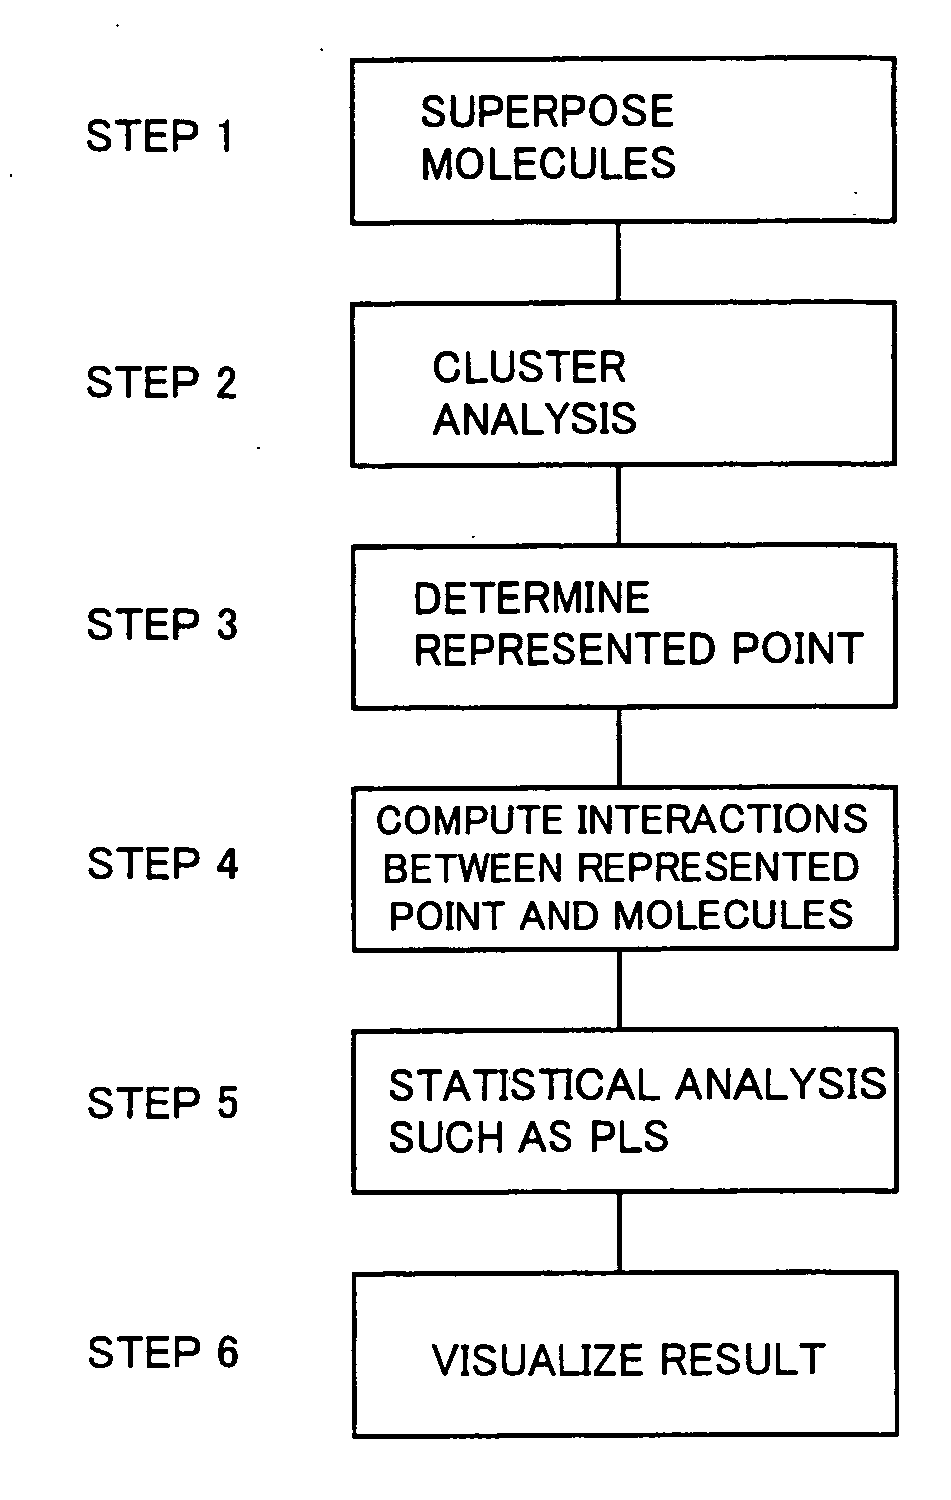
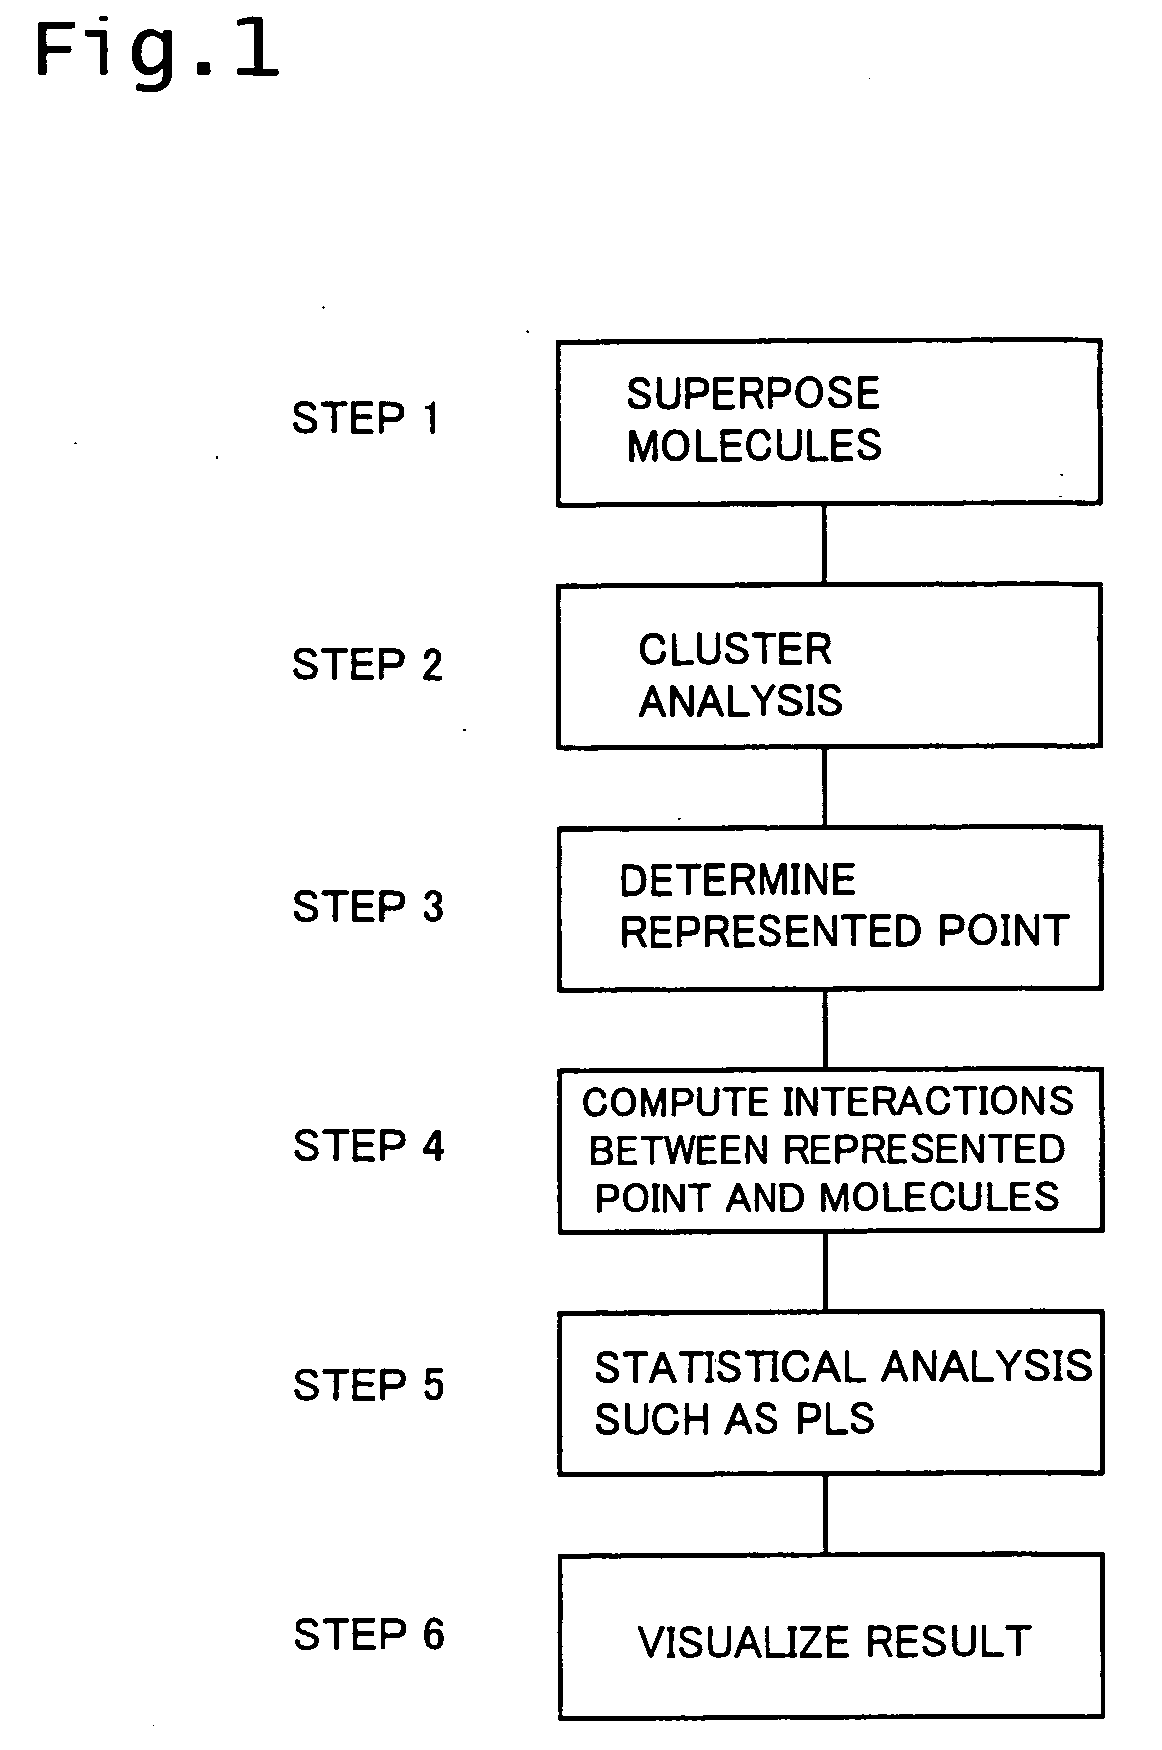
A three-dimensional quantitative structure-activity relationship method has process B1 of calculating the coordinates of the respective atoms contained in the plural molecules thus superposed in the virtual space, process B2 of calculating interatomic distances between each atom and other atoms and identifying the shortest interatomic distance among thus calculated interatomic distances and two atoms constituting the shortest interatomic distance; process B3 of deleting the two atoms having the shortest interatomic distance from the three-dimensional space and generating an atom which represents the two atoms in the weighted average coordinates of the two atoms to delete, when the shortest interatomic distance thus calculated is equal to or smaller than a predetermined threshold value; process B4 of returning to the second process B2 after the third process B3 and executing the second process B2 including the atoms formed during the third process B3; and process B5 of terminating the process B when the shortest interatomic distance thus calculated is exceeds the predetermined threshold. This method enables strikingly reducing the memory zone and amount of computation required for 3D QSAR analysis.

Description

FIELD OF THE INVENTION [0001] The present invention relates to a three-dimensional quantitative structure-activity relationship (3D QSAR) method and a program for quantitatively analyzing a relationship between the three-dimensional structure and the biological activity of a compound utilizing a statistical approach. BACKGROUND OF ART [0002] As a method of designing a drug molecule having a desired biological activity, logical molecule design methods utilizing three-dimensional quantitative structure-activity relationship (3D QSAR) analysis, pharmacophore mapping and the like are used. Where these methods are used, statistical processing is performed utilizing a PLS (partial least square of latent valuables) method, a neural net (NN) method, genetic algorithm (GA) or the like after superposition of known drugs one atop the other within a virtual space in accordance with a proper rule, thereby extracting characteristics between various parameters such as biological activity, hydropho...

Claims


Application Information

Patent Timeline
IPC IPC(8): G06G7/58G01N33/48G06F17/50G06F19/00G06F19/16G06F19/18
CPCG06F19/704G06F19/706G06F19/707G16C20/30G16C20/50G16C20/70
Inventor KOTANI, TAKAYUKIHIGASHIURA, KUNIHIKO
Owner NIPPON ZOKI PHARM CO LTD
Learn More