
Integration of visualizations, reports, and data

a visualization and report technology, applied in the field of web site visualization tools, can solve the problems of time-consuming selection, alignment and comparison process, and user-intensive and substantial investment of time, and achieve the effect of reducing the amount of time for users

Active Publication Date: 2004-09-09
TERADATA US
View PDF8 Cites 198 Cited by
  • Summary
  • Abstract
  • Description
  • Claims
  • Application Information

AI Technical Summary

Benefits of technology

[0007] Another object of the present invention is to reduce the amount of time for a user to obtain visualization analysis data.

Problems solved by technology

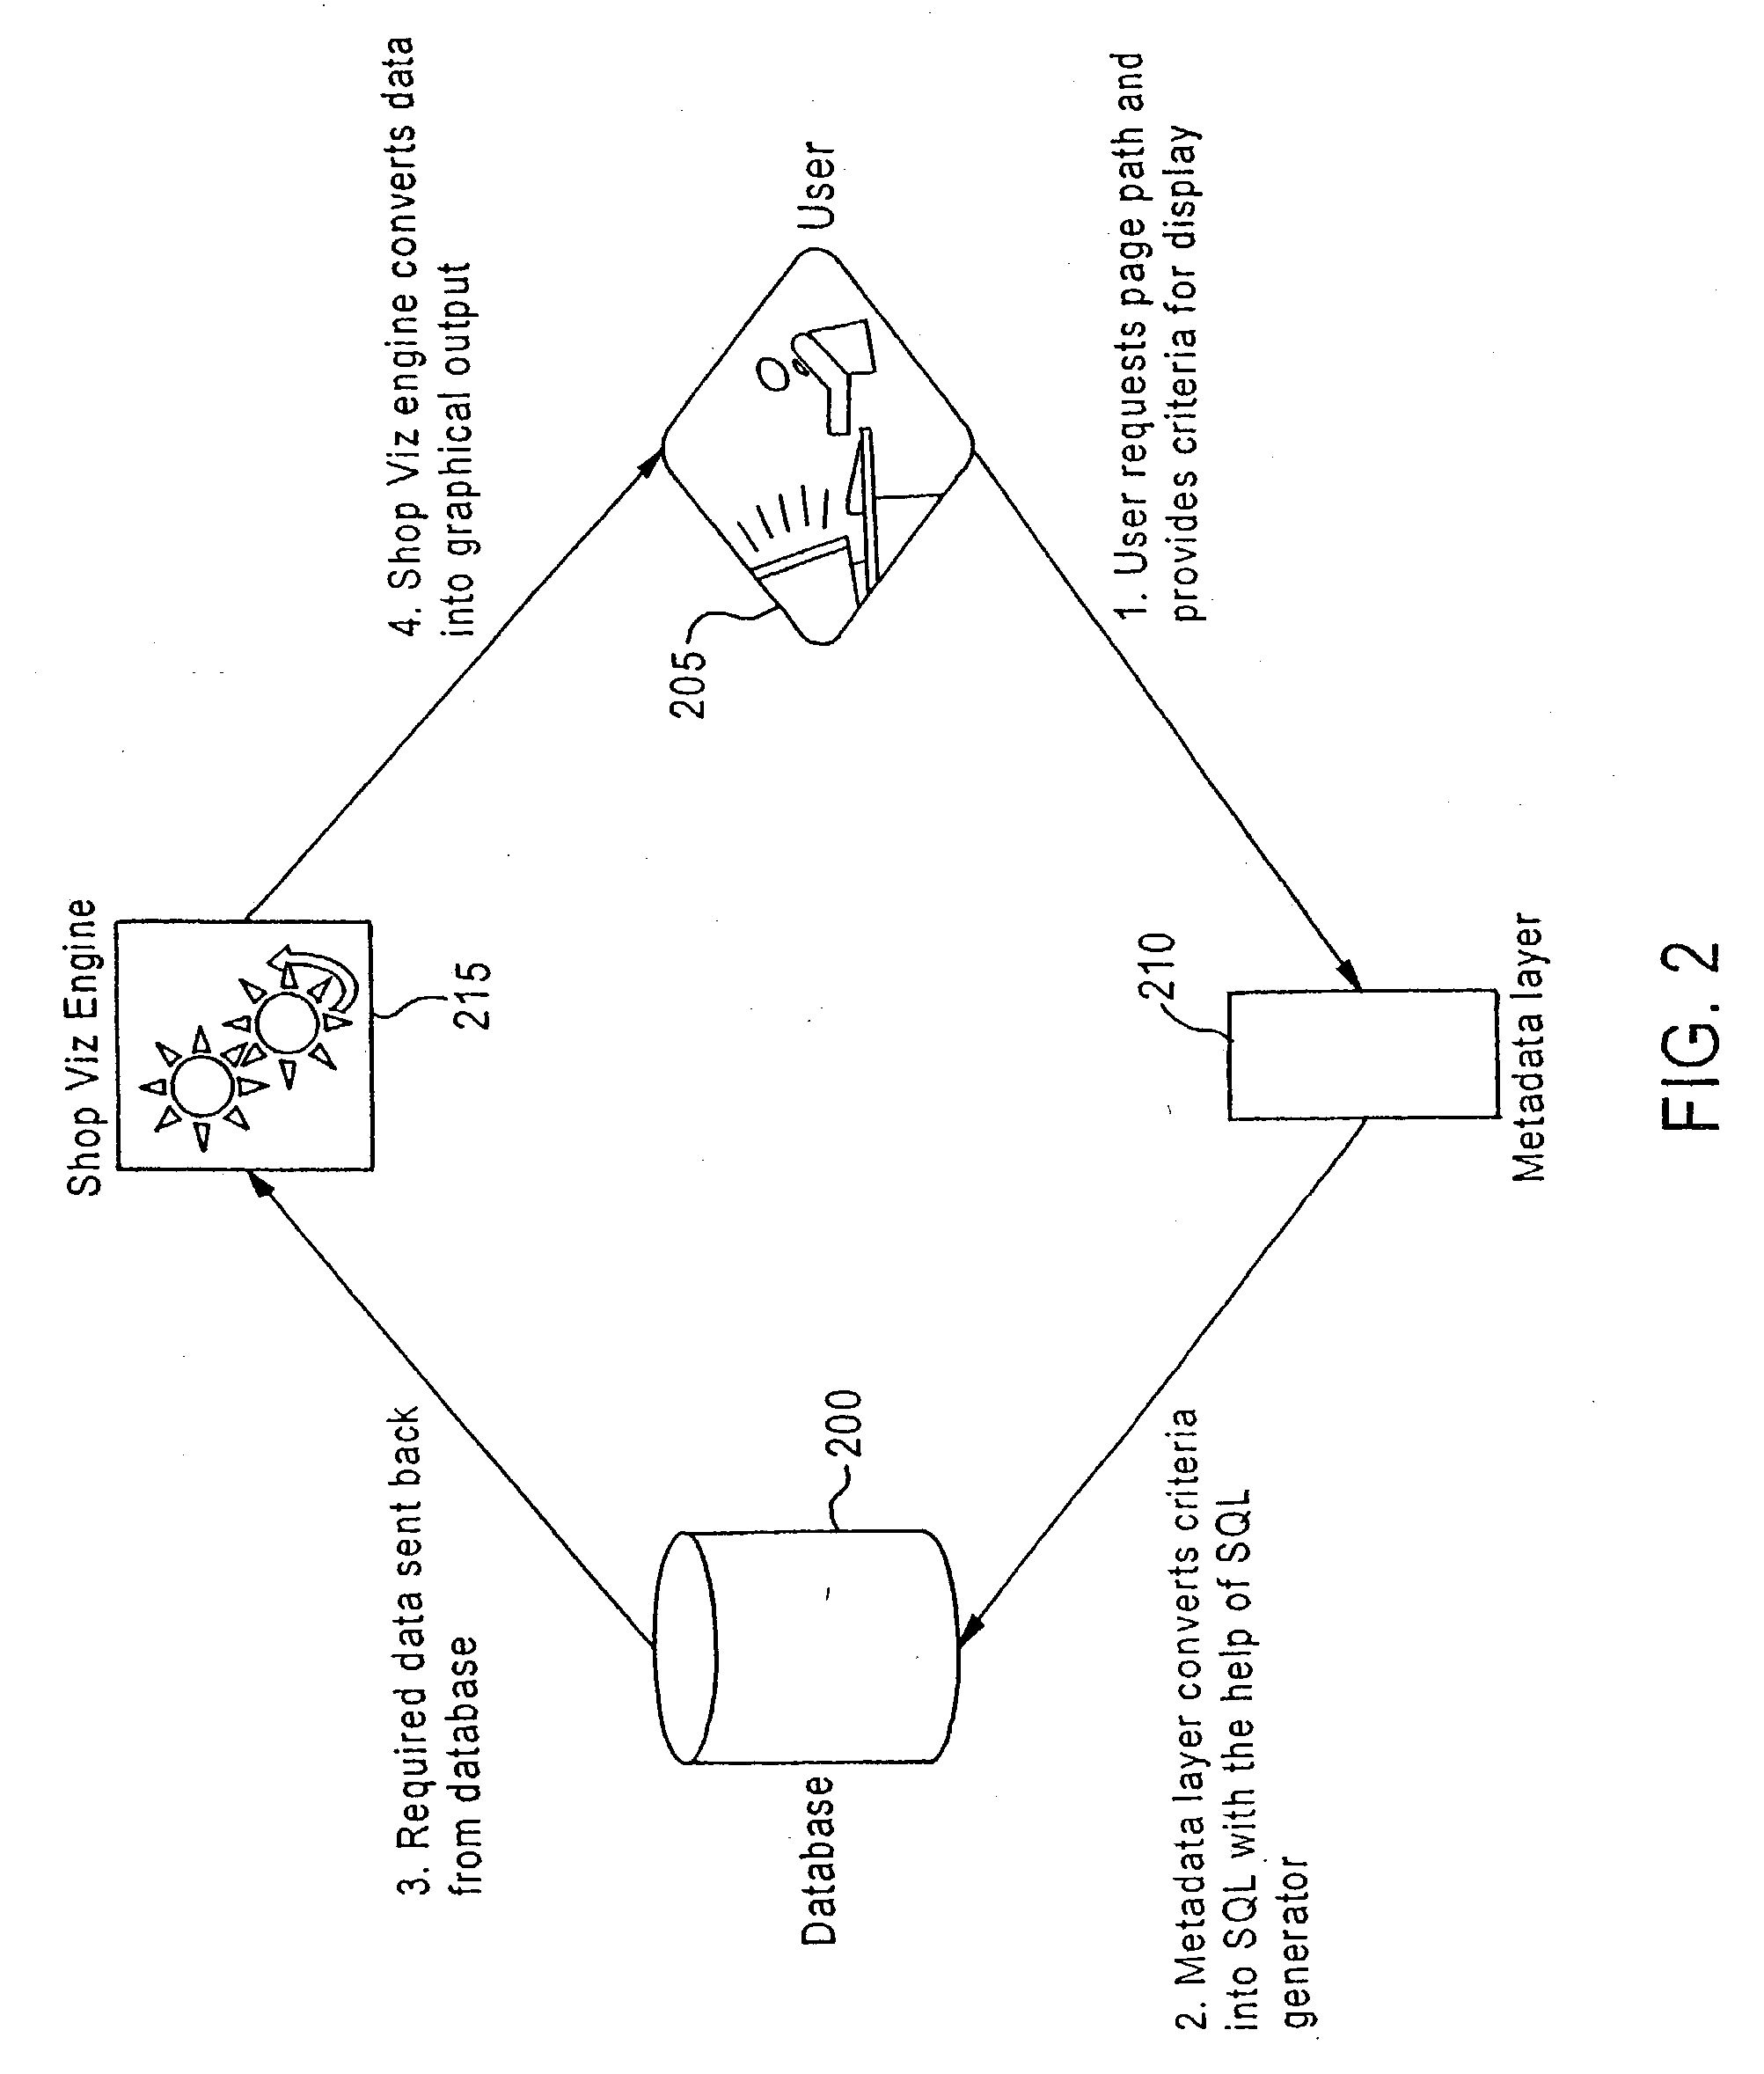
The selection, alignment and comparison process is time consuming and user intensive requiring a substantial investment of time for a user to be able to analyze data.
Further complicating matters, the user is required to use multiple, different, individual tools.

Method used


Image

  • Integration of visualizations, reports, and data
  • Integration of visualizations, reports, and data
  • Integration of visualizations, reports, and data

Examples


example

[0147] Several visualization examples are described below.

[0148] Visualization 1--Overview of the Entire Site

[0149] The Overview visualization 600, as shown in FIG. 6, enables the user to see the "big picture" of consumer activity on a site or e-store. Overview analyses display only the pages of a site and the selected parameters. The multitude of paths that can be traveled in the site are not shown on the diagram. Users use other visualizations to study link activity among pages.

[0150] As a default, Overview visualizations do not display individual product pages. This data is aggregated up to the lowest Category page in the logical hierarchy. Customers with extensive sites can set up multiple Overview visualizations, each of which displays only a subset of the entire site. One or more of these subsets may include individual product pages. When customers create Overview visualizations displaying individual product pages, Shop Viz displays only those pages visited by customers during...


PUM


Abstract

A method of graphically displaying the path of a customer traversing a web site and related business data is described. The method includes receiving a user request for a visualization. The user request may include data filters and exclusions. Responsive to the user request, traffic data is selected for analysis. The selected traffic data is analyzed and displayed to the user. The display may be in the form of a visualization including a graph and related business data. The graph may be of an overview, referral, path, page-to-page path, and animation type. A system for visualizing traffic patterns and the path of a customer at a site is described in conjunction with the above method. The system includes a logical data model, a dimensional data model, a report specification, a graphical interface, metadata database and an analysis report. The graphical interface is used for viewing visualization information.

Description

[0001] The present invention relates generally to web site visualization tools, and more particularly, to a web site visualization tool including integrated visualization and on-line analytical processing (OLAP) reporting functionality.[0002] Market Trends[0003] E-store Merchandising--The layout and merchandising of the electronic or online store or website, i.e., e-store, is becoming critically important to online retailers, i.e., e-tailers. The e-tailers need to know how customers are shopping their sites so e-tailers can understand how products and promotions are viewed by customers and where to place internal site promotions. Awareness of customer or shopper traffic patterns also helps e-tailers maximize the value of advertising space sold to vendors.[0004] E-store Marketing--Revenues from the e-store site come from direct product revenue as well as display and vendor ads. It is important to understand the traffic patterns and the types of customers on each area of the site to o...

Claims


Application Information

Patent Timeline
IPC IPC(8): G06Q30/02G06T11/20H04L29/06H04L29/08
CPCG06Q30/02G06Q30/0202G06T11/206H04L69/329H04L67/36H04L67/22H04L29/06H04L67/535H04L67/75H04L9/40
Inventor CEREGHINI, PAULDEVARAKONDA, KAVITHADO, GIAIDUNSKER, ERICHAQUE, AHSAN U.PAPIERNIAK, KARENSRIKANT, SREEDHARBOERGER, ELLEN
Owner TERADATA US
Learn More