
Method for node mapping, network visualizing and screening

Inactive Publication Date: 2004-02-05
HITACHI LTD
View PDF1 Cites 13 Cited by
  • Summary
  • Abstract
  • Description
  • Claims
  • Application Information

AI Technical Summary

Benefits of technology

[0019] A method for screening a regulatory substance according to the present invention comprises the steps of: extracting an interaction between nodes to be noted from the network visualized on the screen as described above; and screening the regulatory substance which regulates the interaction. The regulatory substance is a substance which facilitates or attenuates the interaction.

Problems solved by technology

Therefore, if there is difficulty in viewing the visualized network, a user would have to appropriately re-arrange the nodes by himself.
However, when there are more nodes, linkage lines between nodes in the display becomes too complex to be viewed, thereby making it impossible to understand the network.
Further, in these conventional methods, a network is projected only onto a two-dimensional plane, and thus it is impossible to visualize and therefor understand reflect the properties of the network based on the arrangement of, for example, three-dimensional periodical boundary conditions.
This method is theoretically possible by assuming proper potential between nodes, but it is not practical because a good amount of time is required for computation.
Beyond that, computation time will be enormous for handling networks having several thousands of, or more, nodes combined, and it will thus be substantially impossible to draw these networks.

Method used


Image

  • Method for node mapping, network visualizing and screening
  • Method for node mapping, network visualizing and screening
  • Method for node mapping, network visualizing and screening

Examples


Embodiment Construction

[0033] Hereinafter, embodiments of the present invention will be described with reference to the drawings. Although proteins are used here as examples to describe a method for creating pathways, the present invention is applicable to other materials such as genes and DNA. Further, when conjugated proteins are decomposed into protein groups and the relationships of the proteins among the protein groups are visualized, it is possible to draw the relationships on a two- or three-dimensional space in the same manner as drawing pathways based on binary relations between single proteins.

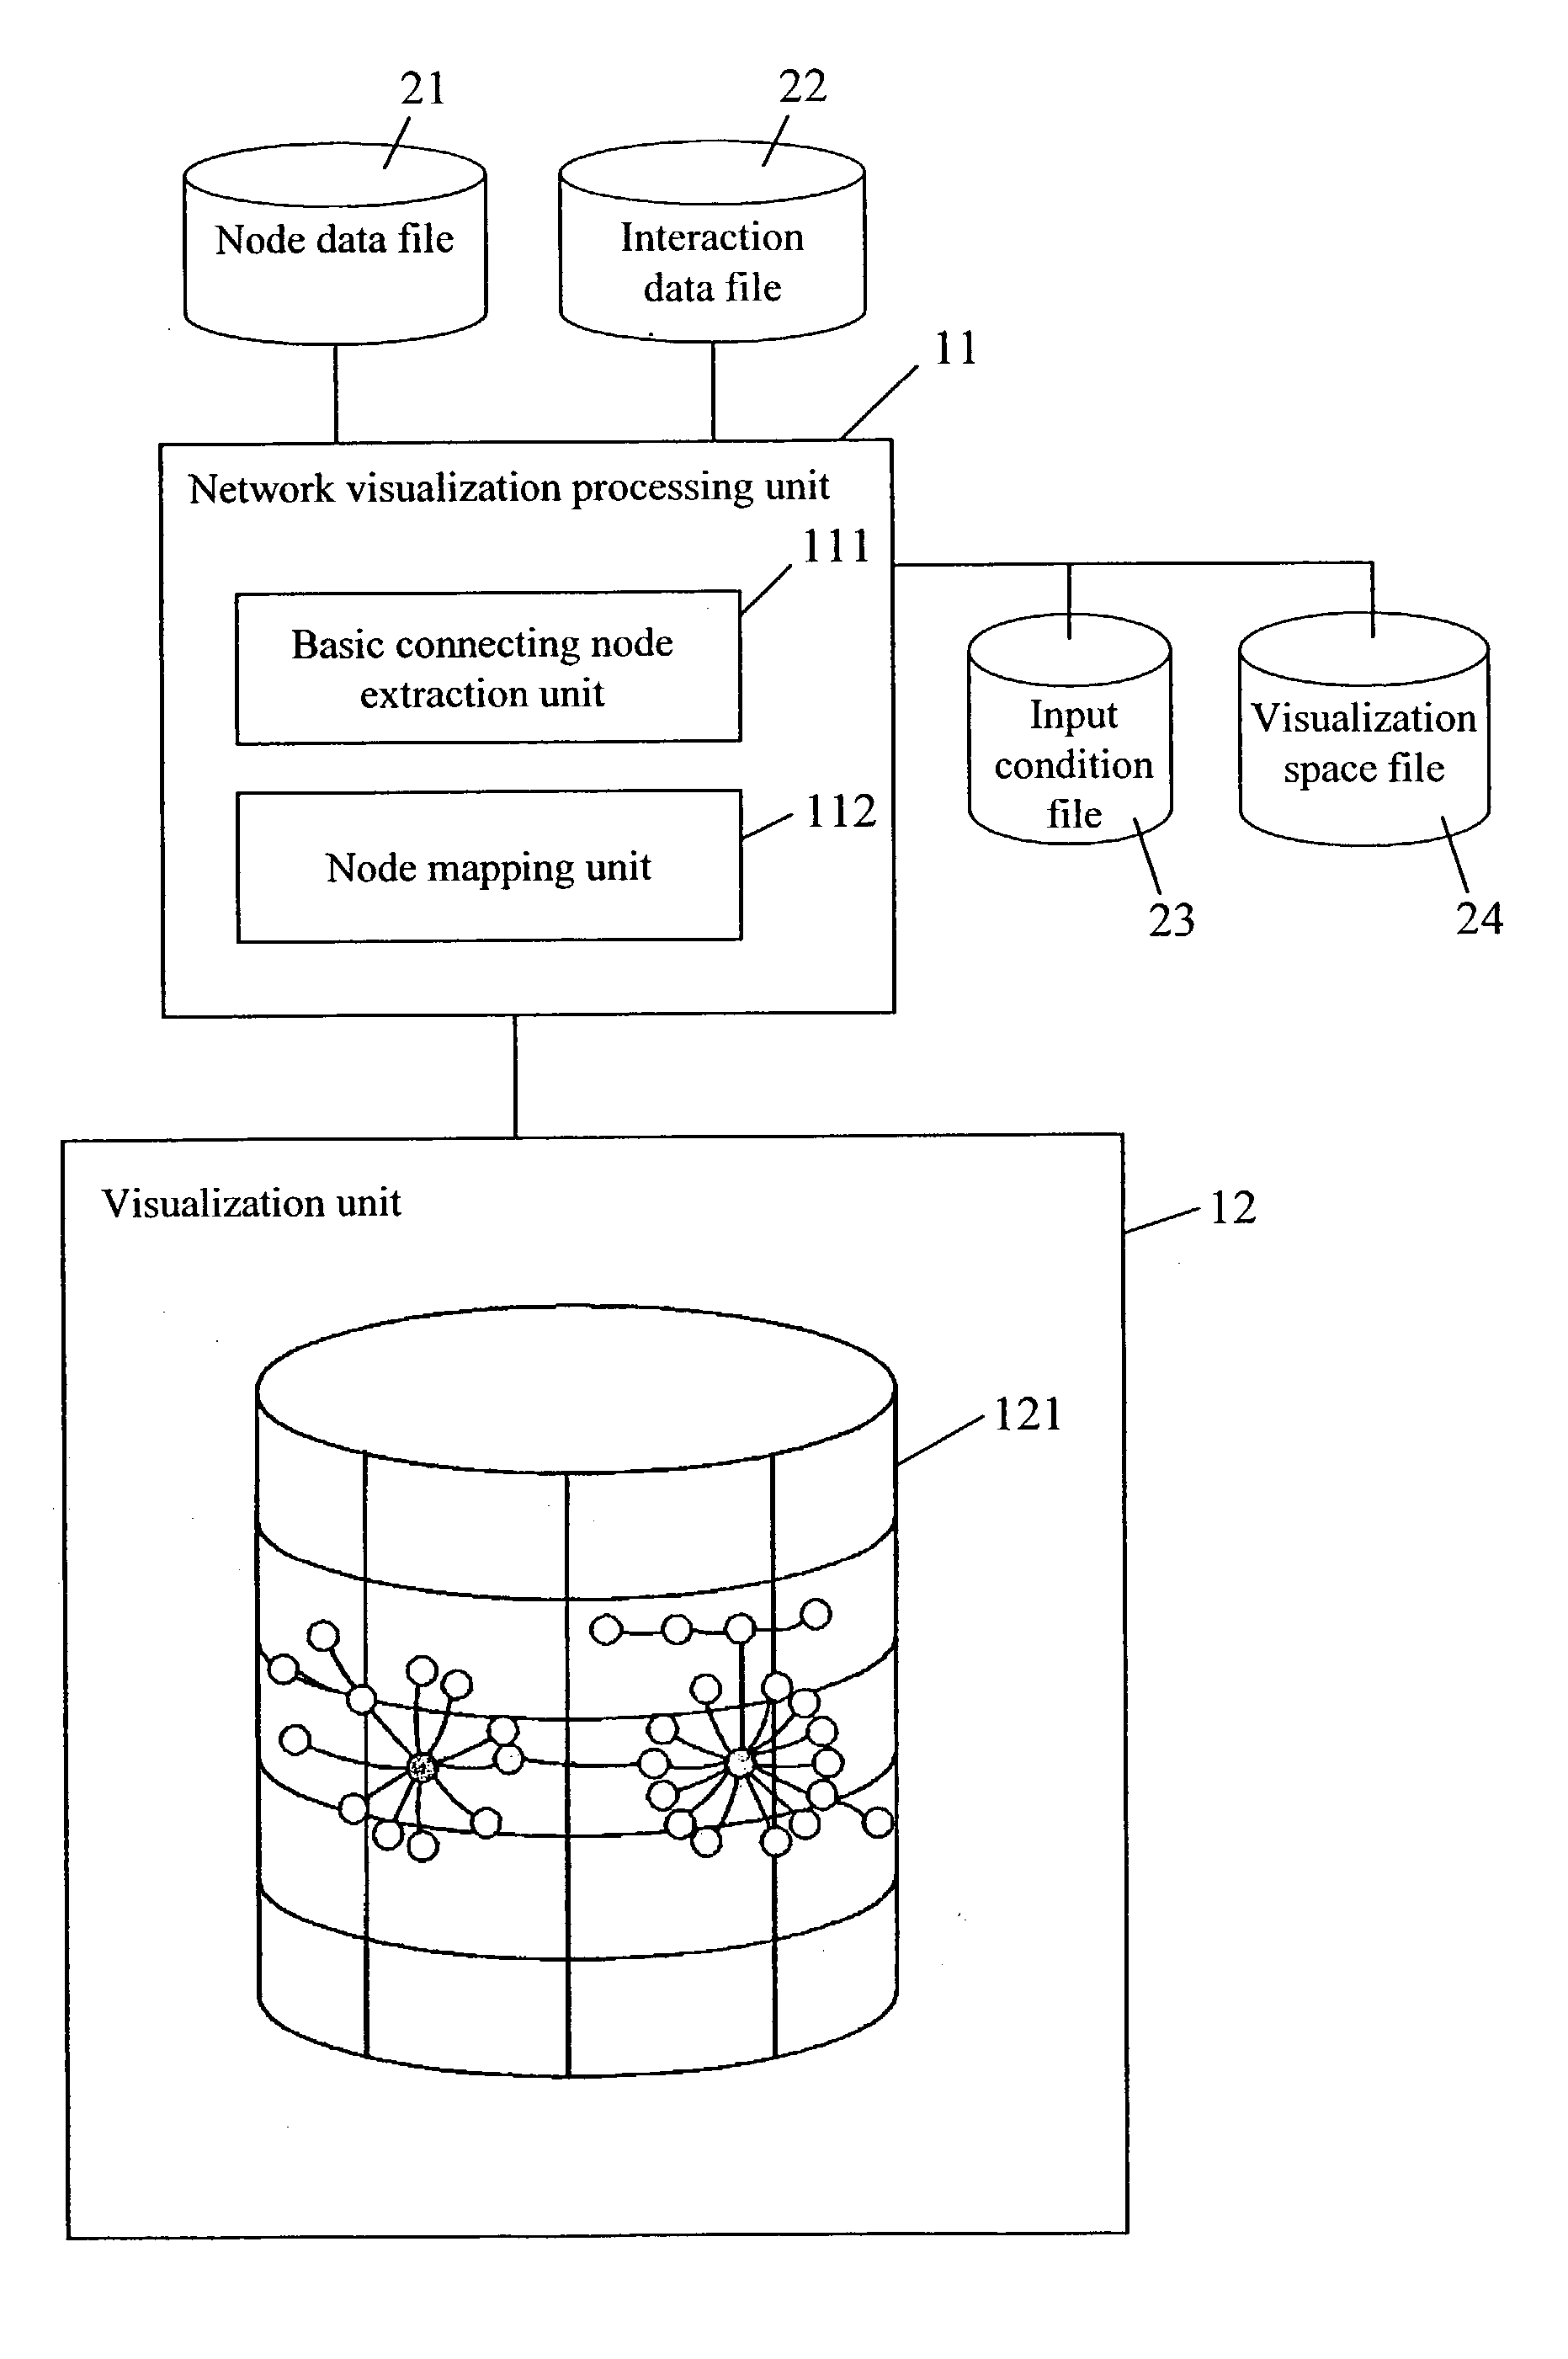
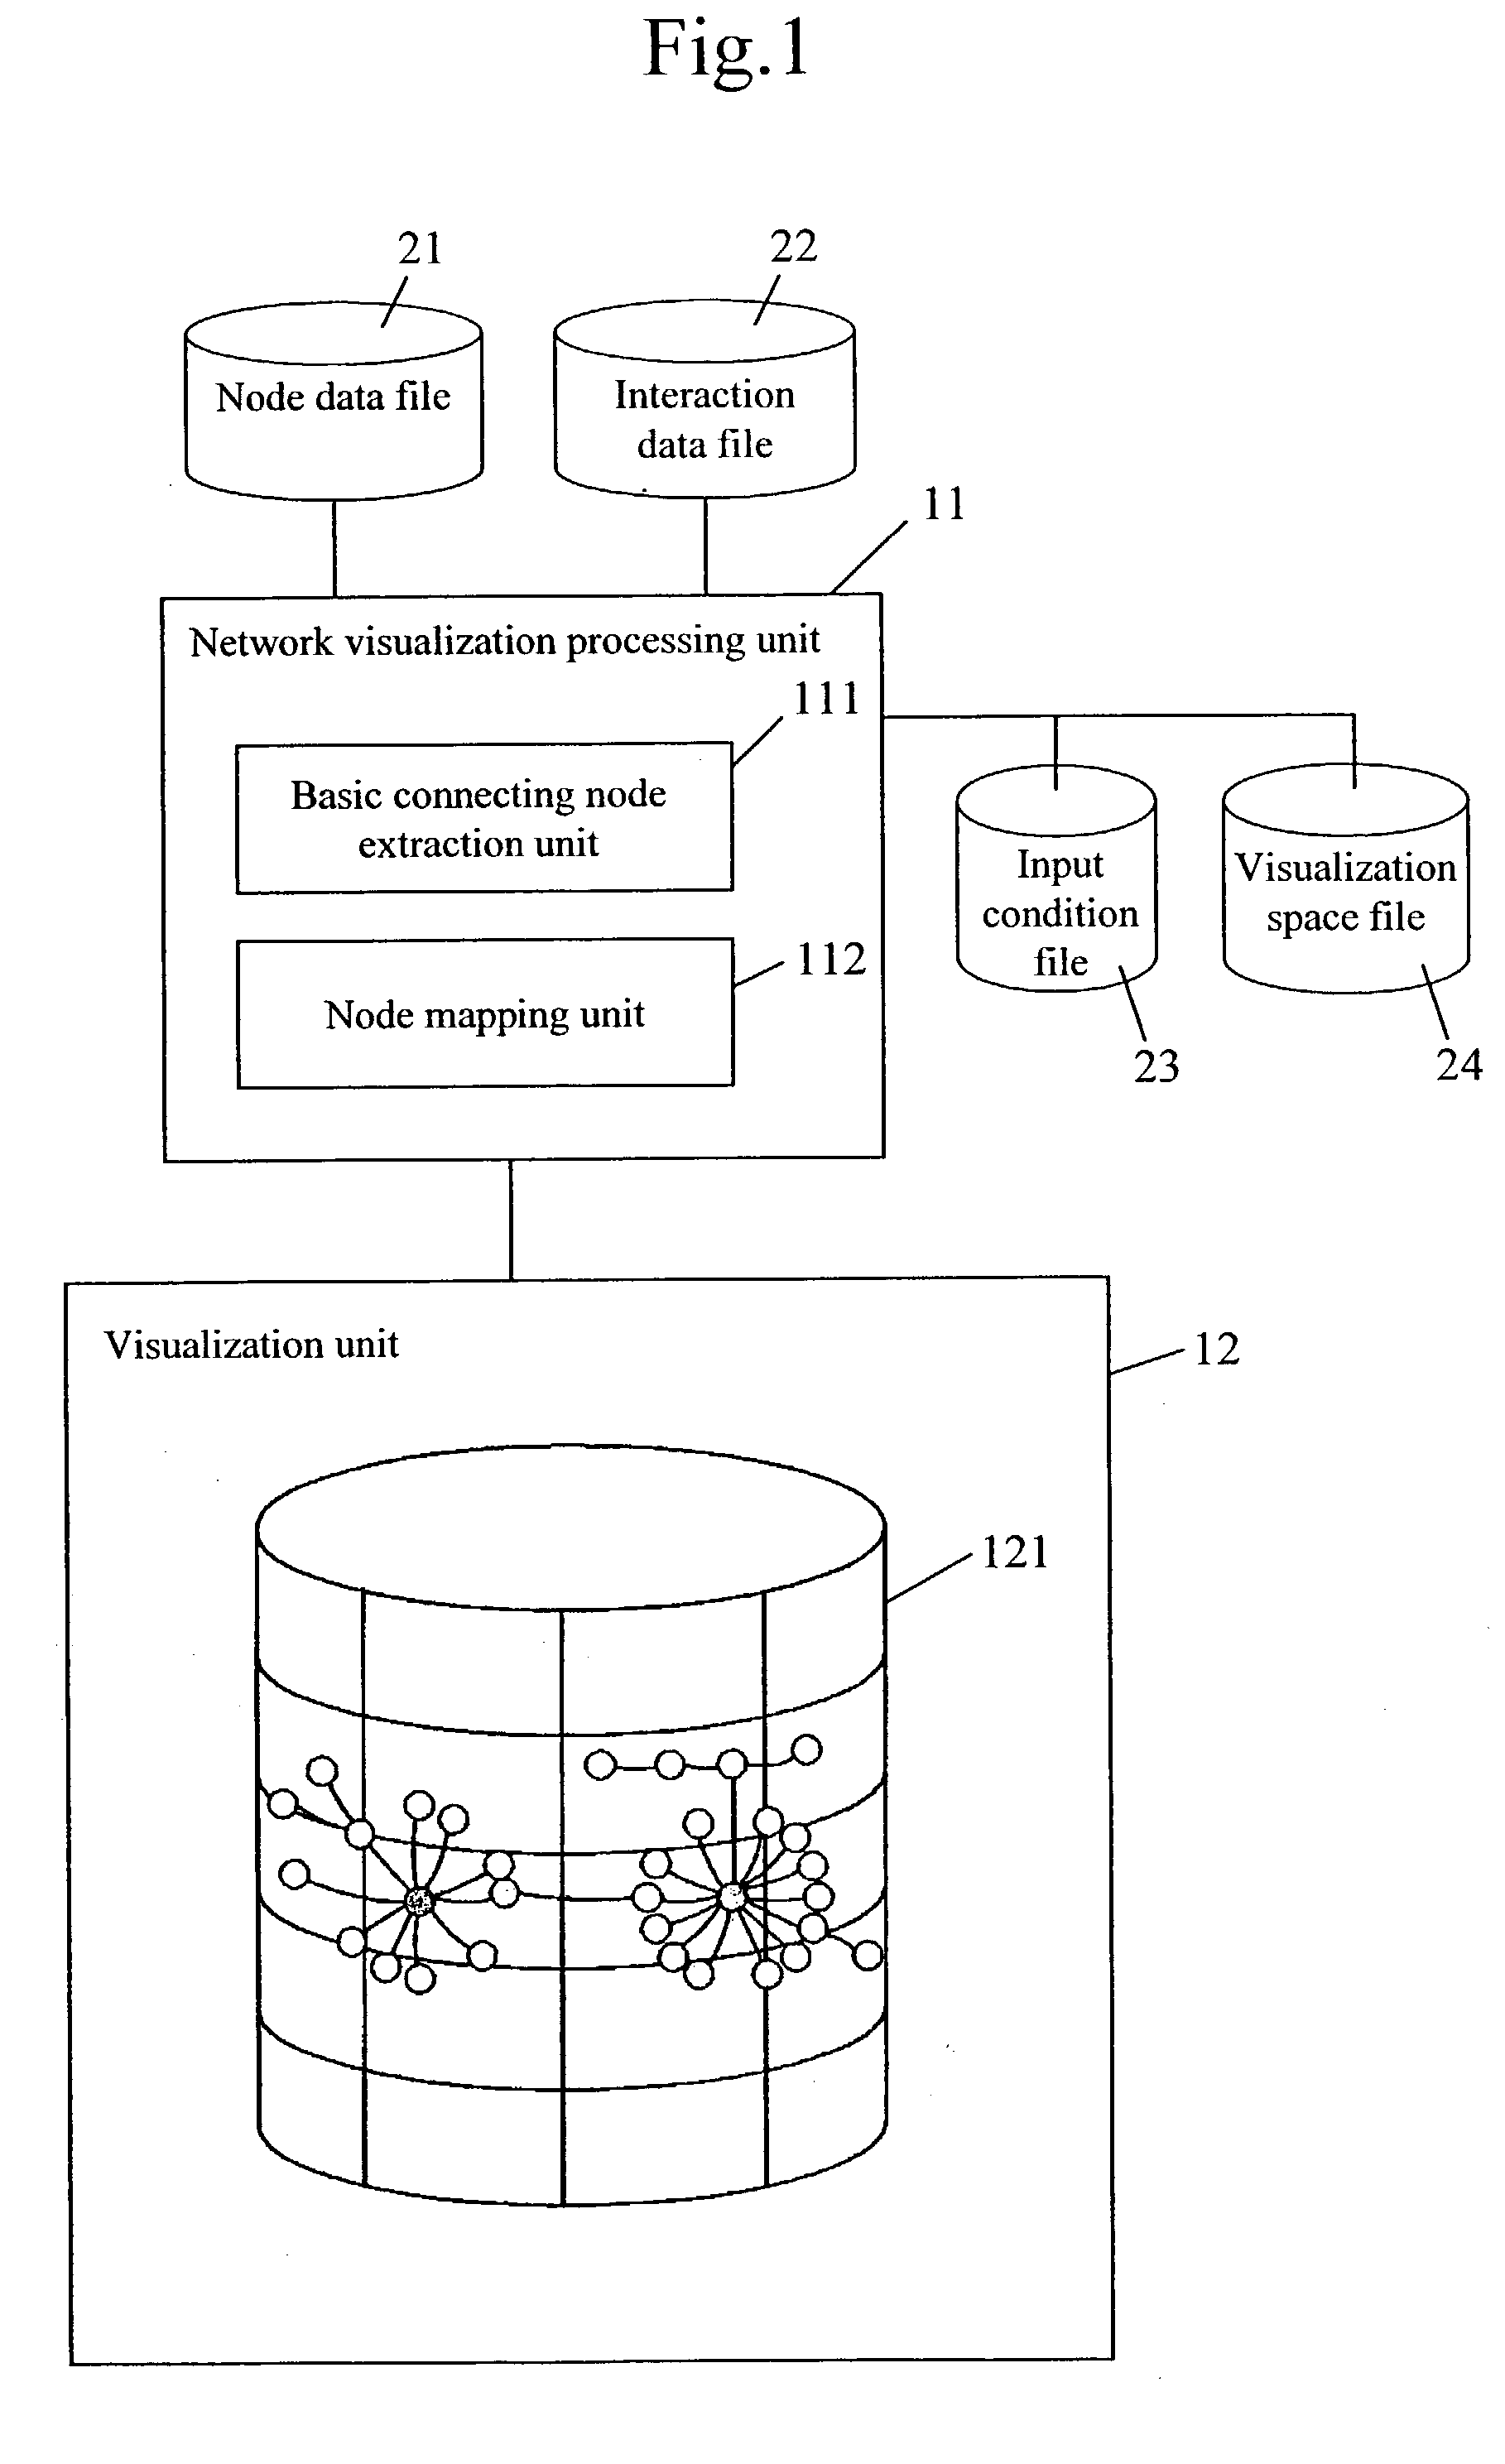
[0034] FIG. 1 is a schematic view illustrating an onscreen network visualization system according to the present invention. Described herein is a case whereby names of single or conjugated proteins are used as nodes.

[0035] A network visualization processing unit 11 is connected to a node data file 21, an interaction data file 22, an input condition file 23, a visualization space file 24, and a visualizatio...


PUM


Abstract

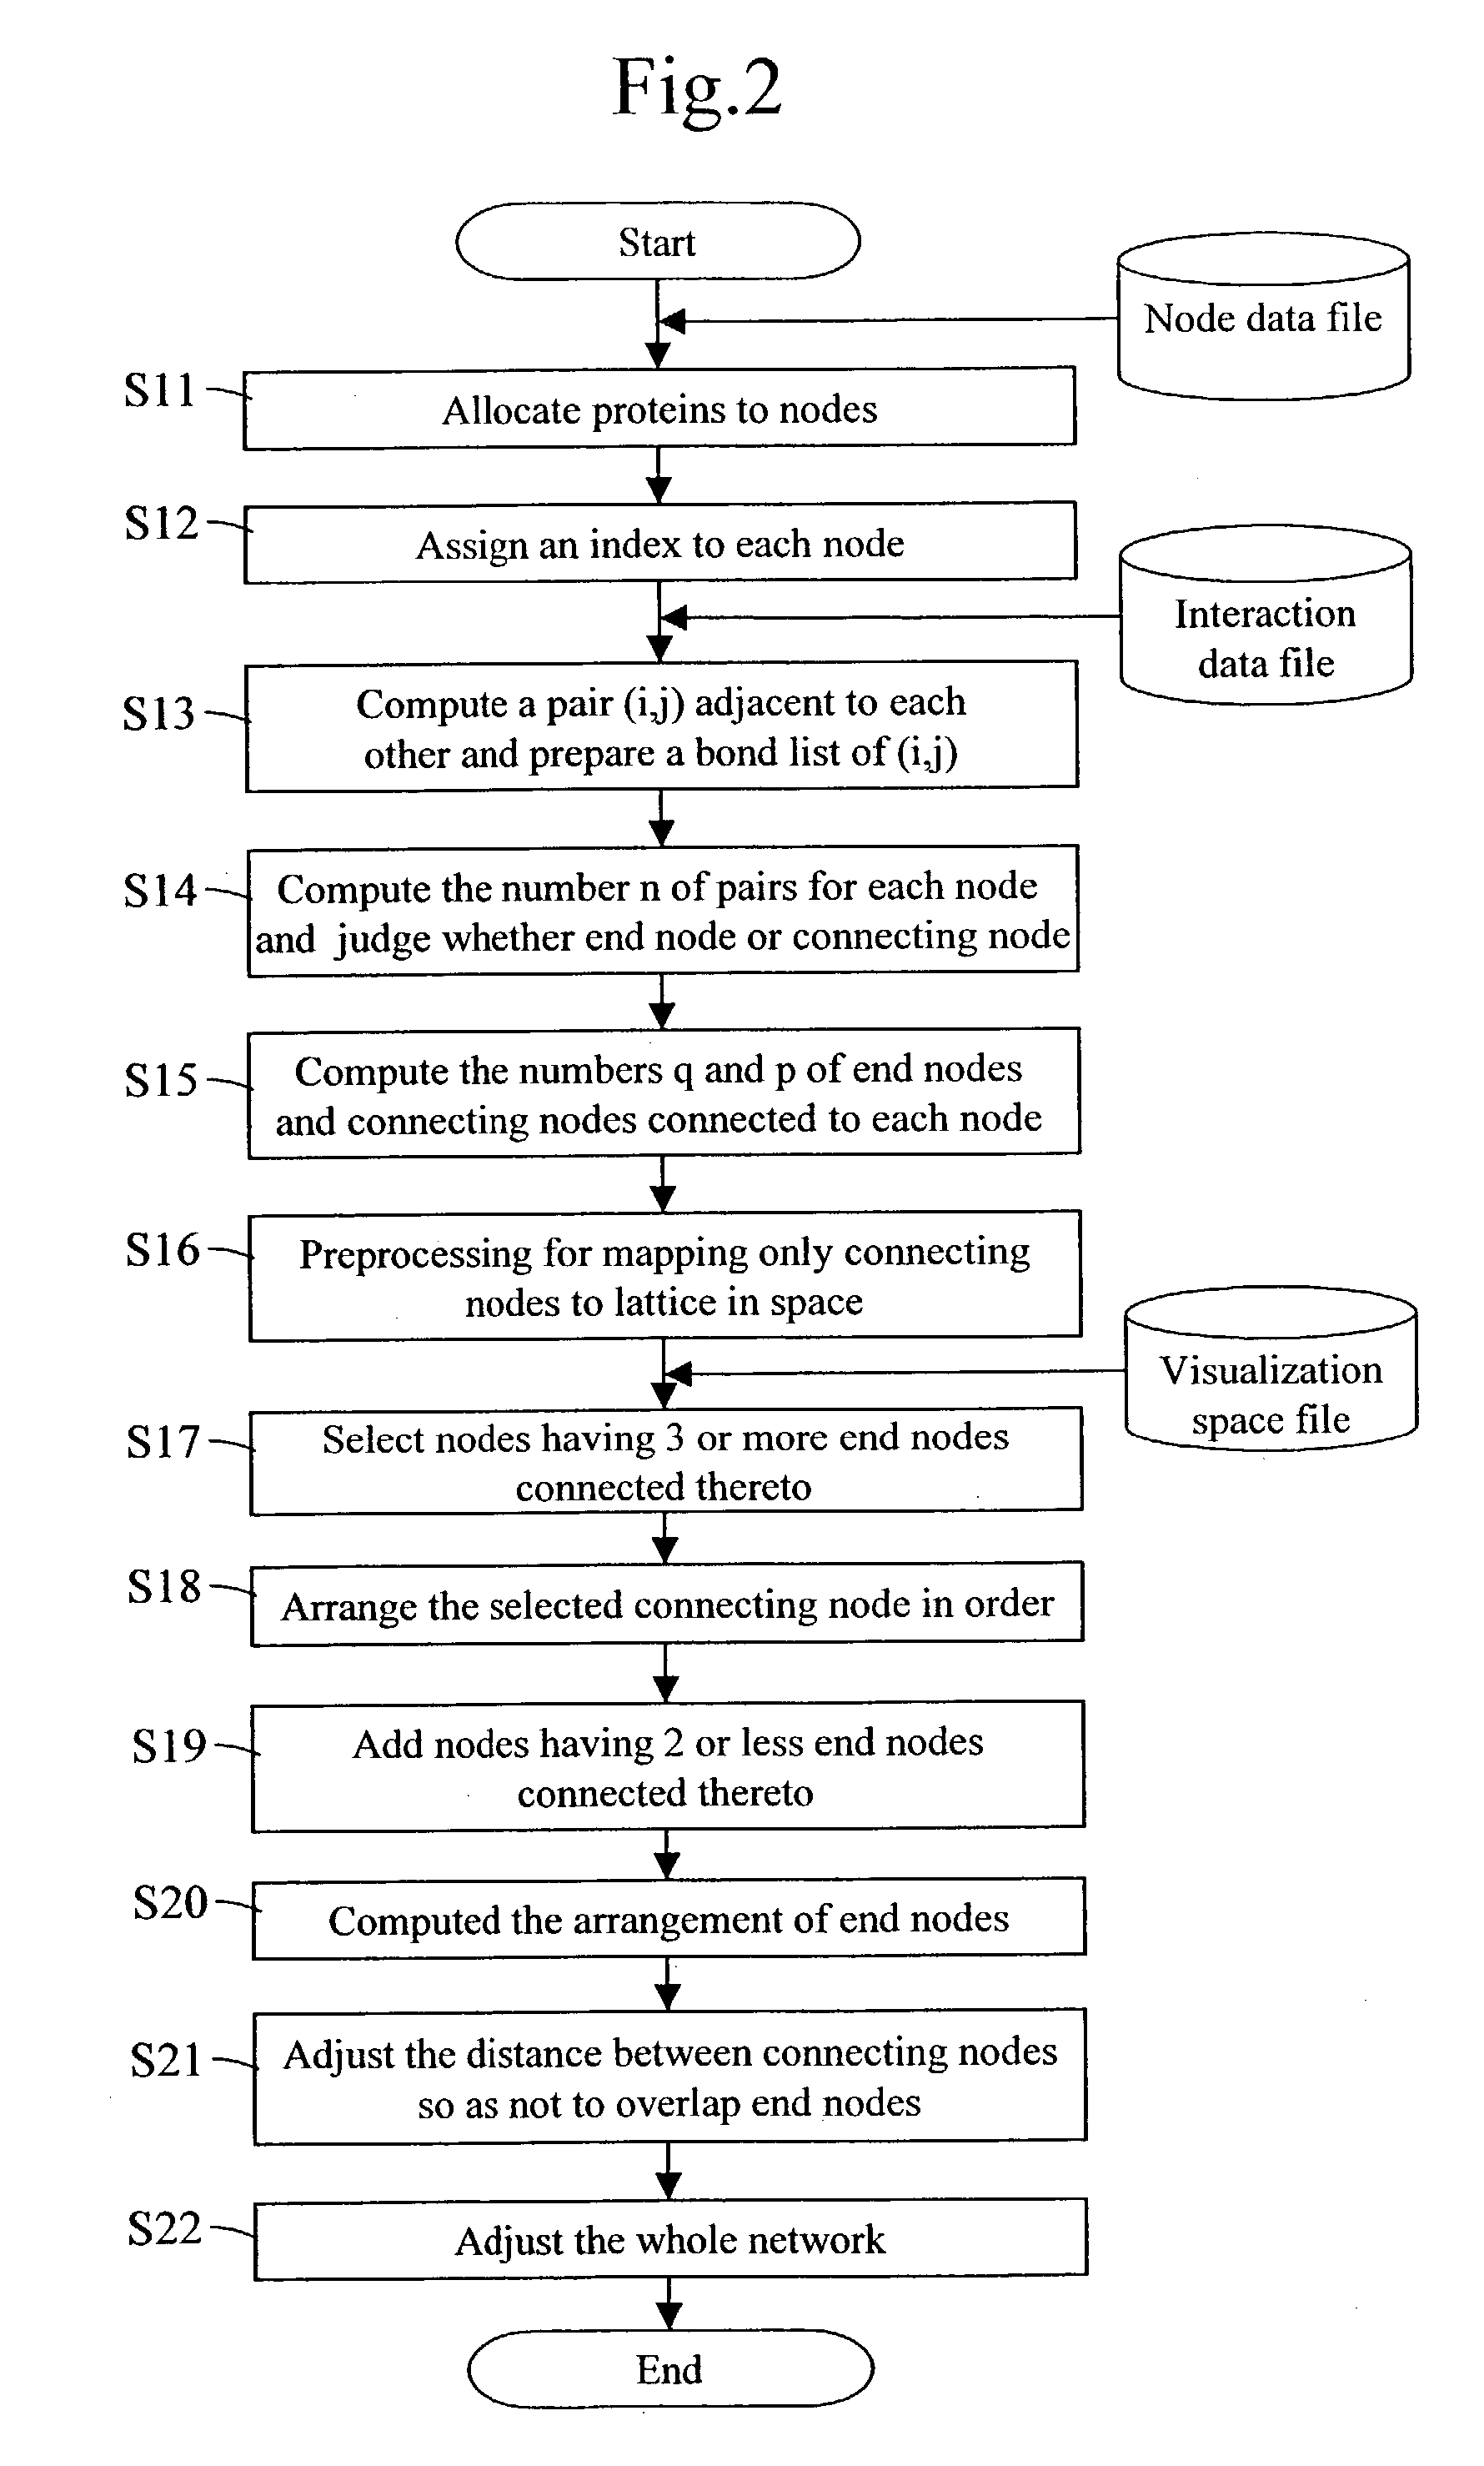
An automated method for creating easily viewable network visualizations without direct use involvement. A table which includes as elements node types, the number of connecting nodes to be connected to the nodes, and the number of end nodes to be connected to the nodes, is prepared by searching databases that stores interactions between nodes, and connecting nodes that are connected to a predetermined number of, or more, end nodes are extracted from this table. The extracted connecting nodes are arranged onto a visualization space at a distance of not less than a preset distance, and the remaining connecting nodes are arranged onto the visualization space. Thereafter, the arrangement of the end nodes in the visualization space is computed, and the distance between the connecting nodes is adjusted so that the end nodes do not overlap.

Description

[0001] 1. Field of the Invention[0002] The present invention relates to a technology to display a network of interacting proteins or genes, DNA, or the like, and in particular to a method of node mapping for network visualization, a method for network visualization, and a method for screening.[0003] 2. Description of the Related Art[0004] With the progress of human genome projects, there is an increasing demand for the function analysis of proteins which are coded on obtained DNA sequences. The functions of proteins are featured by interactions with other materials, and thus attempts for encyclopedic determination on interactions are being undertaken vigorously. Meanwhile, other attempts to obtain interaction information from the literature have been started. To visualize large quantities of the obtained interaction information in an easily understandable manner is very important for correct interpretation of the interaction information.[0005] One of the methods for visualizing inte...

Claims


Application Information

Patent Timeline
IPC IPC(8): G01N33/15G01N33/50G01N33/48
CPCG06F19/26G16B45/00
Inventor OHTA, YOSHIHIRO
Owner HITACHI LTD
Learn More