Advanced delay analysis mechanism

a delay analysis and delay technology, applied in the direction of instruments, 2d-image generation, texturing/coloring, etc., can solve the problems of delay in project completion, lack of continuity, and delay in the amount of time activities can be delayed

Active Publication Date: 2022-08-16
LONG THOMAS CHARLEY
View PDF10 Cites 0 Cited by
  • Summary
  • Abstract
  • Description
  • Claims
  • Application Information

AI Technical Summary

Benefits of technology

[0010]The visualization of impending delay could occur by the progress of urgent colored blips through time toward the inner most circle of the graph, or by seeing a blip near the inner circle start to change color from a non-urgent color to a more urgent color or any combination of the two. This visualization could thus provide an advanced alert before an activity begins actually delaying a project.

Problems solved by technology

Any delay to work on the critical path will by definition delay project completion.
This represents the amount of time activities can be delayed before they become critical and start delaying the project.
The problem with current methods are that they are good at evaluating where your critical path, activities and float are at a given time, but they are snapshots and lack continuity.
Even when this data is updated rapidly or in real time, the display of this data lacks convergence continuity, which makes it difficult to observe trends that are occurring that could be useful in predicting delays so that they can be preemptively interdicted before or as they occur.

Method used


Image

  • Advanced delay analysis mechanism
  • Advanced delay analysis mechanism
  • Advanced delay analysis mechanism

Examples


Embodiment Construction

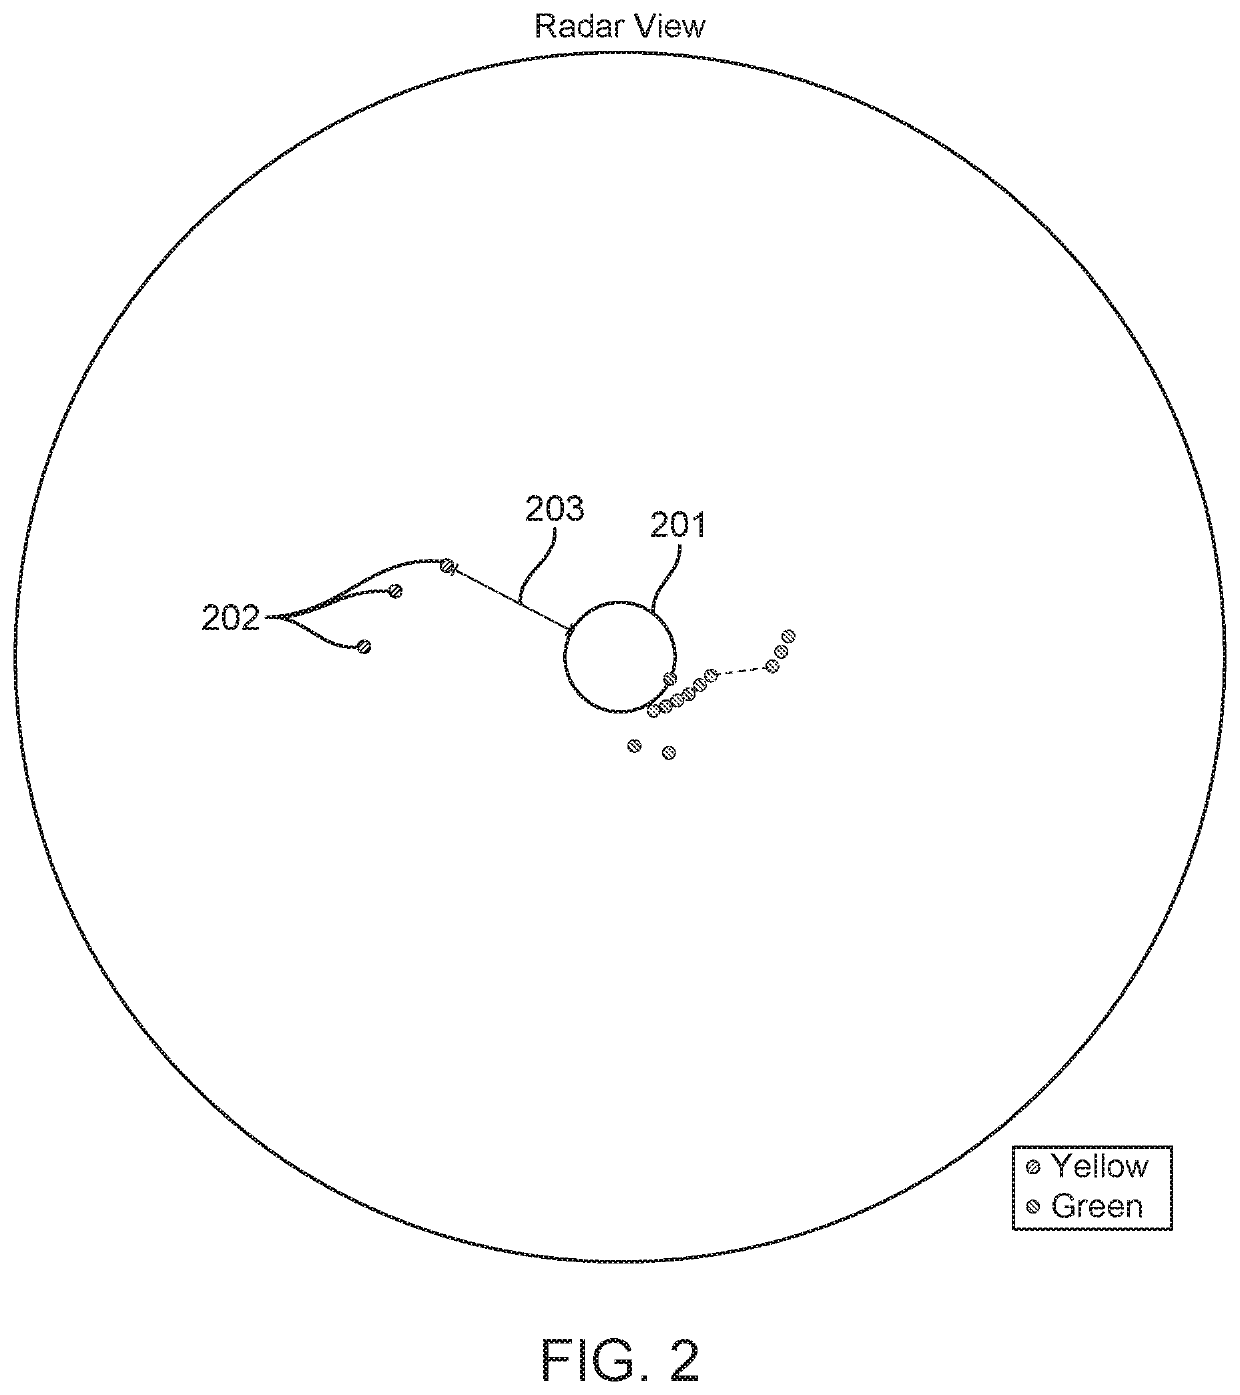
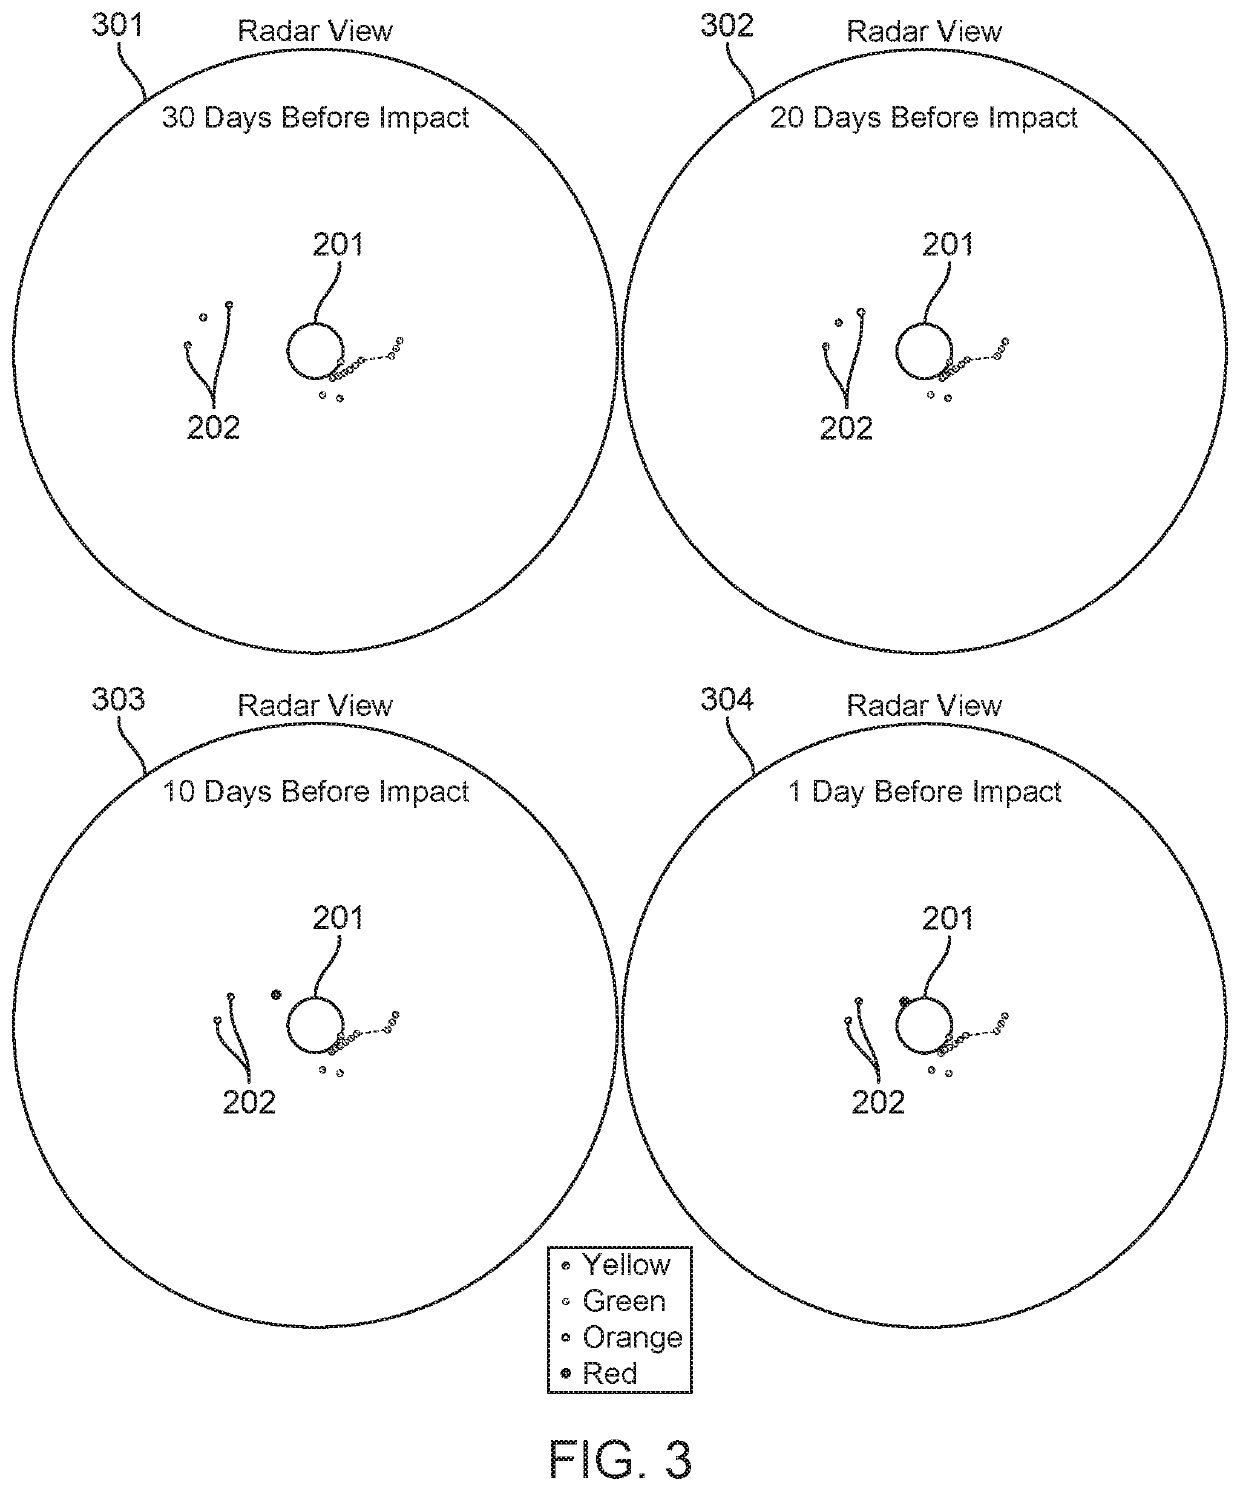
[0015]As mentioned above, prior work using CPM and computer modeling focus on determining critical paths and documenting delays at the time of an update. This invention is unique in that it places the progress data in an animated radial, radar view type display; so that the recent trends of the schedule can be visualized in a familiar way. It is like a combination of a radar screen and a weather map animation. By combining a visual display of changing color and location of activities the various ways of an activity or task becoming critical can be visualized in a variety of ways.

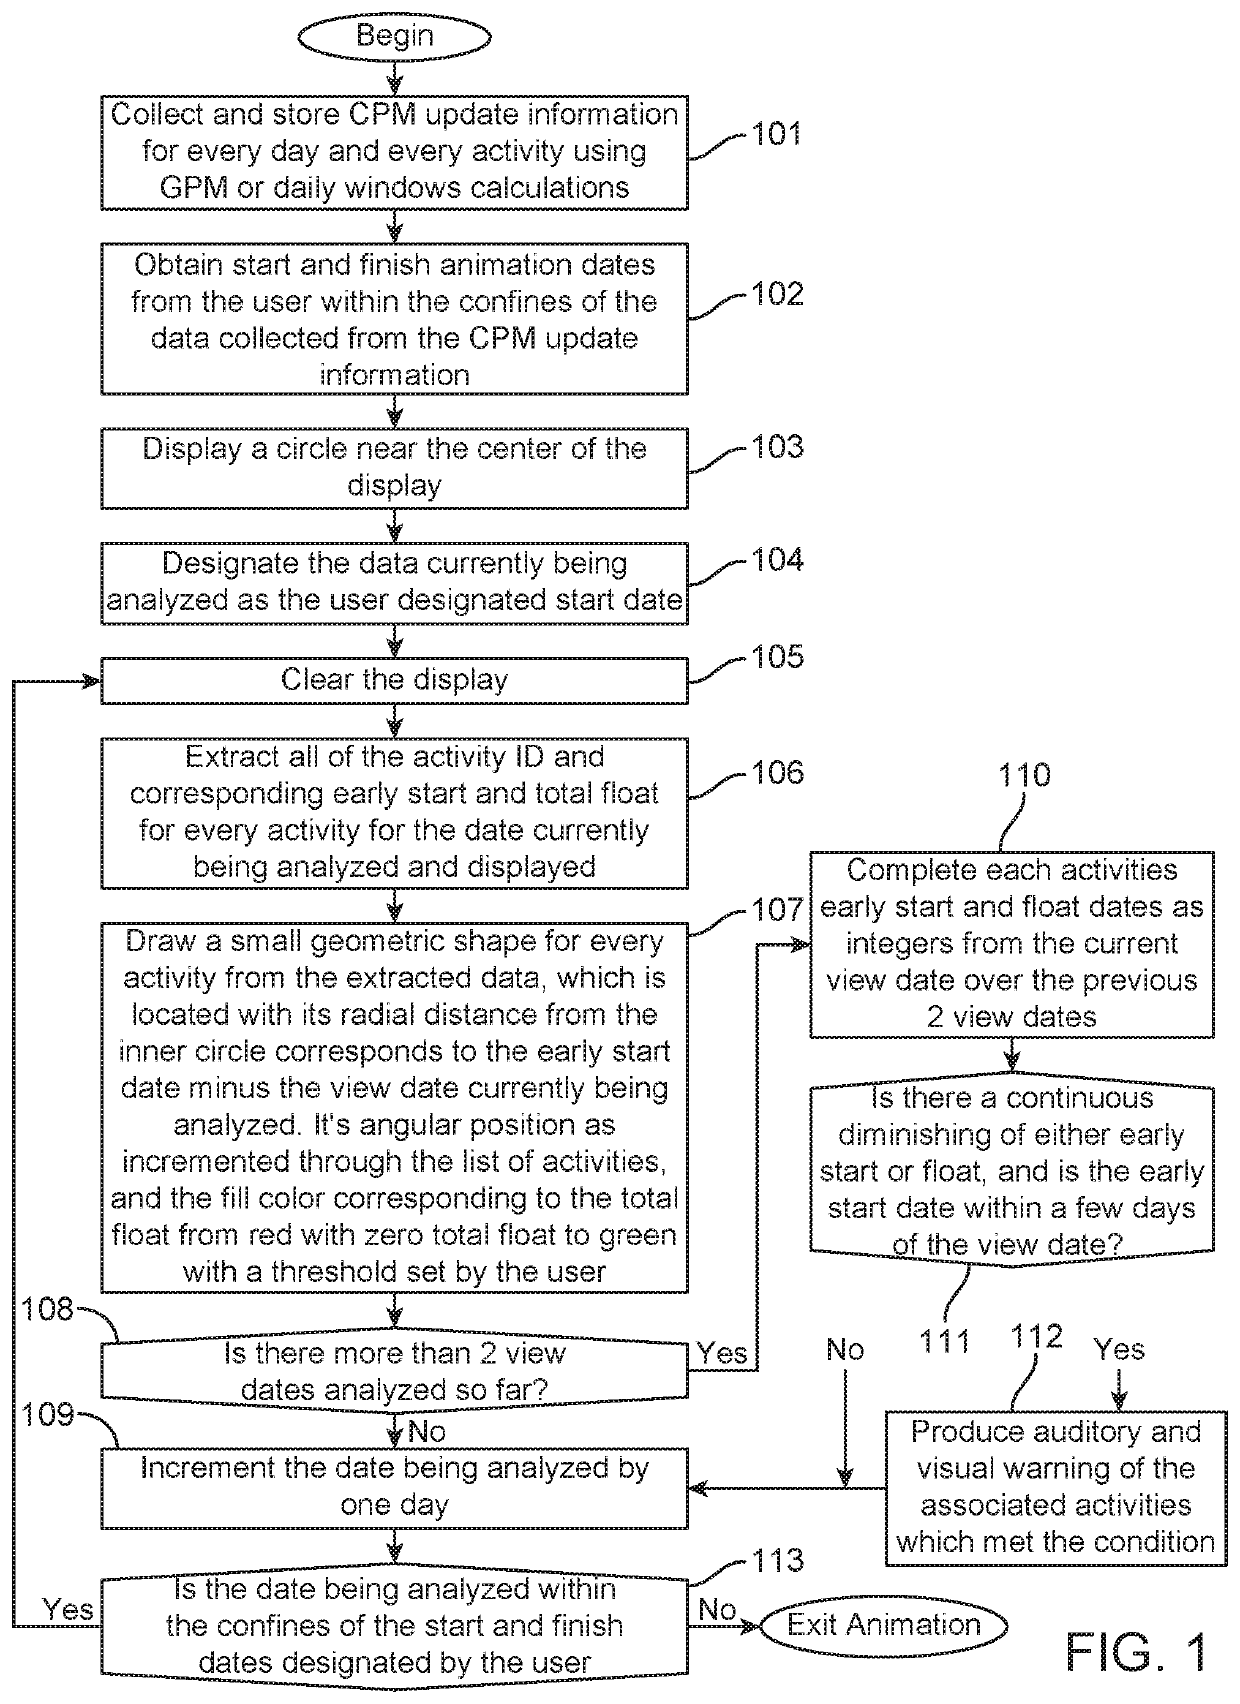
[0016]FIG. 1. is a flowchart describing an embodiment of the method of displaying the radial graphic to a user in accordance with the invention. The initial task at block 101, is to use a CPM method of calculation to compile the following data for every day which you have update information: unique activity identifier, total float of the activity as of the calculation date as an integer, early start date as ...


PUM


Abstract

A computer graphics display system and method which places moving and color changing geometric shapes, which represent tasks of a project, on a circular graph by means of a display such as a computer monitor, (similar to a radar screen) which alerts the user to impending delays to a project by means of visualization of the movement and color change of the geometric shapes or “blips” on the circular graph.The method comprises extracting information from planning calculations, then translating this information into an animated visual radial graphic display.

Description

CROSS REFERENCE[0001]The present application claims benefit of Provisional Application No. 62 / 673,927 with filing date May 20, 2018 (20 May 2019).TECHNICAL FIELD[0002]The present invention generally relates to the field of project planning and control, and more specifically of a display system to visualize impending impacts to a project's duration.BACKGROUND[0003]The most commonly used method of modeling the time and criticality of different activities within a project is known as the critical path method or CPM. It is the basic model used by nearly all planning software. At its heart, is a simple path finding algorithm having nodes which are point-in-time events and a distance between nodes which is measured in time. An activity in the CPM measures the amount of time to do the work of that task. More specifically, it measures the amount of time to get from one node, the start, to another, the finish. Then these tasks are related to each other's starts and finishes, which comprises ...

Claims


Application Information

Patent Timeline
Patent Type & Authority Patents(United States)
IPC IPC(8): G06T13/80G06T11/20G06T11/00
CPCG06T13/80G06T11/001G06T11/20G06T11/206
Inventor LONG, THOMAS CHARLEY
Owner LONG THOMAS CHARLEY
Why Eureka
Try Eureka