Water consumption trend graphical analysis method based on water fingerprint algorithm

An analysis method, a technology of fingerprint algorithm, applied in the field of data analysis

Pending Publication Date: 2021-11-09
无锡市水务集团有限公司 +1
View PDF0 Cites 2 Cited by
  • Summary
  • Abstract
  • Description
  • Claims
  • Application Information

AI Technical Summary

Problems solved by technology

[0003] The technical problem to be solved by the present invention is to be able to discover the laws according to the performance of various data and analyze them with a more scientific graphical method, so as to guide our work and find bad situations more accurately. A water fingerprint algorithm is provided Graphical analysis method of water consumption trend

Method used


Image

  • Water consumption trend graphical analysis method based on water fingerprint algorithm
  • Water consumption trend graphical analysis method based on water fingerprint algorithm
  • Water consumption trend graphical analysis method based on water fingerprint algorithm

Examples


specific Embodiment example 1

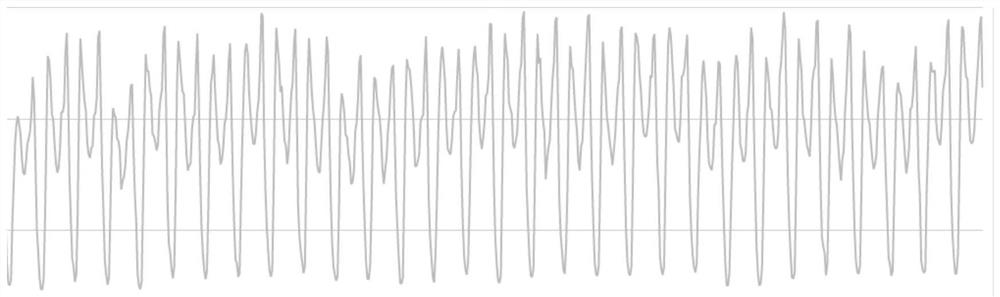
[0045] The water fingerprint algorithm is defined as a comprehensive algorithm that combines "swimming lanes" with machine learning prediction, time axis, background geometry and early warning. We take water data in a certain area and send it through the Internet of Things remote transmission device, such as figure 1 :

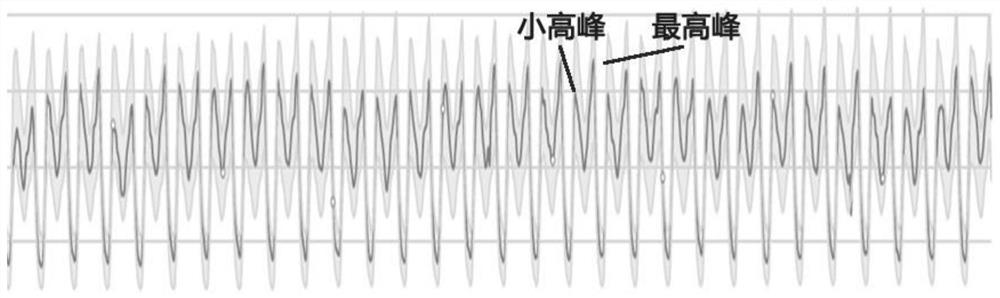
[0046] According to the data, the "swimming lane" area is divided, the "swimming lane" is designed, and the small peak and the highest peak are found at the same time, such as figure 2 :

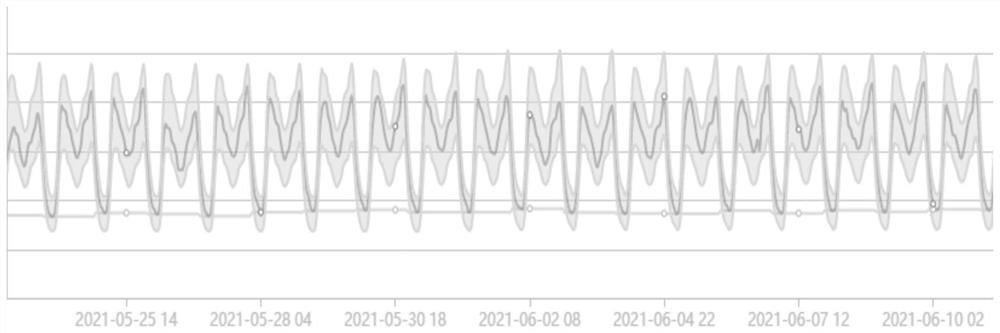
[0047] Through this data, we add the time (accurate to the hour) and find the following, such as image 3 :

[0048] The first peak is at 8 o'clock in the morning, the second peak is at 22 o'clock in the evening, and the lowest point is at 4 o'clock in the morning, such as Figure 4 :

[0049] This data is a city with a size of 5 million cities. We found the operating law of the entire city. Using this, we found the operating law of the entire city. Using this graphical...


PUM


Abstract

A water consumption trend graphical analysis method based on a water fingerprint algorithm comprises the steps that: data are obtained through remote transmission equipment of the Internet of Things, feature discovery is carried out on the basis of the data, the data are of a waveform structure, region division is carried out on the outer side of the waveform to form 'lane', and a plurality of peak periods and low peak periods are found according to the fluctuation of the 'lane'; and meanwhile, time is added on a horizontal coordinate axis, the time is accurate to hour, data filling is carried out in a 'lane' by predicting and simulating follow-up data, and follow-up prediction data is corrected when next monitoring data is acquired. After the structure is adopted, the method has the following advantages: the water consumption trend is basically determined according to the predicted path of the lane, by adopting the graphical analysis method model, when several prediction points are exceeded to give an alarm or the sudden waveform amplitude exceeds a great prediction value, monitoring equipment judges abnormity and gives an abrupt change alarm, so that the aim of timely early warning and timely informing can be achieved.

Description

technical field [0001] The present invention relates to the technical field of data analysis, and specifically refers to a graphical analysis method of water consumption trend based on water fingerprint algorithm (water fingerprint algorithm is defined as "swimming lane" combined with machine learning prediction, combined with time axis, combined with background geometric figures and early warning. algorithm). Background technique [0002] The social and economic life of enterprises and the development of production and operation of the country are inseparable from the flow of fluid gases such as water, drainage, rainwater, heating, electricity, oil, and gas in pipelines. Because users, enterprises, communities, the entire city, and the entire country use Every situation is different. How to analyze some laws and find out some phenomena based on these differences, provide a favorable method for production and life, provide guidance for water supply coordination, leakage con...

Claims


Application Information

Patent Timeline
Patent Type & Authority Applications(China)
IPC IPC(8): G06K9/00G06K9/62G06N20/00
CPCG06N20/00G06F2218/12G06F18/241
Inventor 吴蕴健邢宇曹琳农凯文张曦烜钱程程许云峰
Owner 无锡市水务集团有限公司
Why Eureka
Try Eureka