A method for intelligently presenting questionnaire report data on the screen

A data and questionnaire technology, applied in the direction of digital data processing, digital data information retrieval, special data processing applications, etc., can solve the problems of rigidity, single fixed width, large time cost and operation cost, etc., to achieve simple operation and low cost Effect

Active Publication Date: 2022-08-09
长沙冉星信息科技有限公司
View PDF6 Cites 0 Cited by
  • Summary
  • Abstract
  • Description
  • Claims
  • Application Information

AI Technical Summary

Problems solved by technology

[0002] Each online questionnaire is composed of questions, which are divided into two categories: subjective questions and objective questions. After the answer sheet data is collected, a questionnaire report will be generated to summarize and present the answer sheet data. The report data is generally composed of answer sheet Basic information data presentation, objective question option proportion presentation, subjective question presentation composition; the default presentation method of the data analysis results of the questionnaire report is either a single histogram, a line chart, a pie chart, or a single The fixed-width format is relatively rigid on the whole. If it is customized by the user, it will also bring a lot of time and operation costs;

Method used


Image

  • A method for intelligently presenting questionnaire report data on the screen
  • A method for intelligently presenting questionnaire report data on the screen
  • A method for intelligently presenting questionnaire report data on the screen

Examples


Embodiment 1

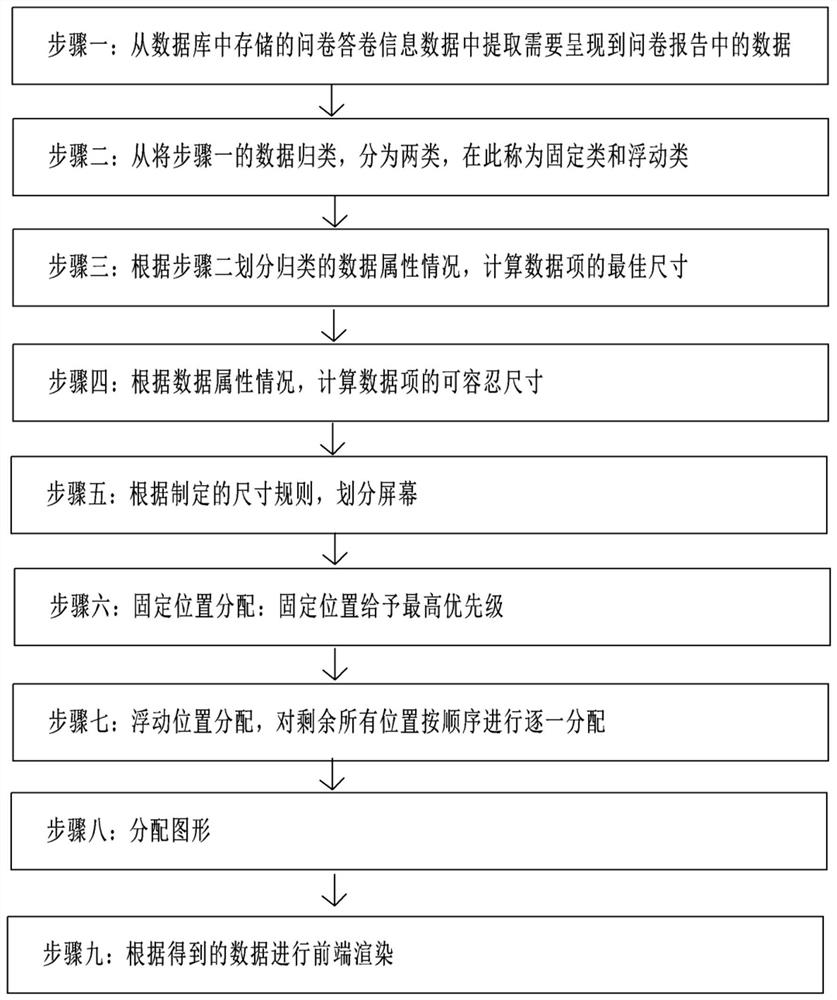
[0030] like figure 1 As shown, a method for intelligently presenting questionnaire report data on a screen includes the following steps:

[0031] Step 1: Extract the data that needs to be presented in the questionnaire report from the questionnaire answer information data stored in the database, such as: the location data of the respondent, the number of visits, the completion rate, the total number of answer sheets, the source data of the respondent, and the cloud data of subjective inscriptions , the proportion of objective question options, etc. The extraction is mainly composed of database reading, data grouping, data operation and other operations, which are all composed of existing technologies, and this technology is not the focus of this program.

[0032] Step 2: Classify the data in step 1 into two categories, which are called fixed and floating here. There are few fixed categories, and most of them are special cases, such as the total number of answers, the number of...


PUM


Abstract

The invention belongs to the technical field of online questionnaire digital presentation, and in particular relates to a method for intelligently presenting questionnaire report data on a screen. Data; Step 2: Classify the data in Step 1; Step 3: Calculate the optimal size of the data item; Step 4: Calculate the tolerable size of the data item; Step 5: Divide the screen according to the size rules; Step 6: Fixed position allocation: fixed position is given the highest priority; Step 7: Floating position allocation; Step 8: Allocate graphics; Step 9: Perform front-end rendering according to the obtained data; the present invention can realize a variety of presentation that is not monotonous or rigid way, and at the same time simple and low-cost questionnaire data is presented on the screen.

Description

technical field [0001] The invention belongs to the technical field of digital presentation of online questionnaires, and in particular relates to a method for intelligently presenting questionnaire report data on a screen. Background technique [0002] Each online questionnaire is composed of questions, which are divided into two categories: subjective questions and objective questions. After collecting the answer sheet data, a questionnaire report will be generated, and the answer sheet data will be summarized and presented. The basic information data is presented, the proportion of objective questions is presented, and the subjective questions are presented; the default presentation method of the data analysis results of the questionnaire report is either a single bar chart, a line chart, or a pie chart, or a single The fixed-width format is relatively rigid on the whole. If it is set by the user, it will also bring a lot of time and operation costs; [0003] The above p...

Claims


Application Information

Patent Timeline
Patent Type & Authority Patents(China)
IPC IPC(8): G06F16/248G06F16/2458
CPCG06F16/248G06F16/2462
Inventor 李文轩
Owner 长沙冉星信息科技有限公司
Why Eureka
Try Eureka