
Power load curve clustering method

A clustering method and power load technology, applied in the direction of instruments, character and pattern recognition, data processing applications, etc., can solve problems such as poor clustering quality

Pending Publication Date: 2021-01-26
XIAN UNIV OF TECH
View PDF5 Cites 2 Cited by
  • Summary
  • Abstract
  • Description
  • Claims
  • Application Information

AI Technical Summary

Problems solved by technology

[0004] The purpose of this invention is to provide a kind of power load curve clustering method, solve the problem of poor clustering quality existing in the prior art

Method used


Image

  • Power load curve clustering method
  • Power load curve clustering method
  • Power load curve clustering method

Examples


Embodiment

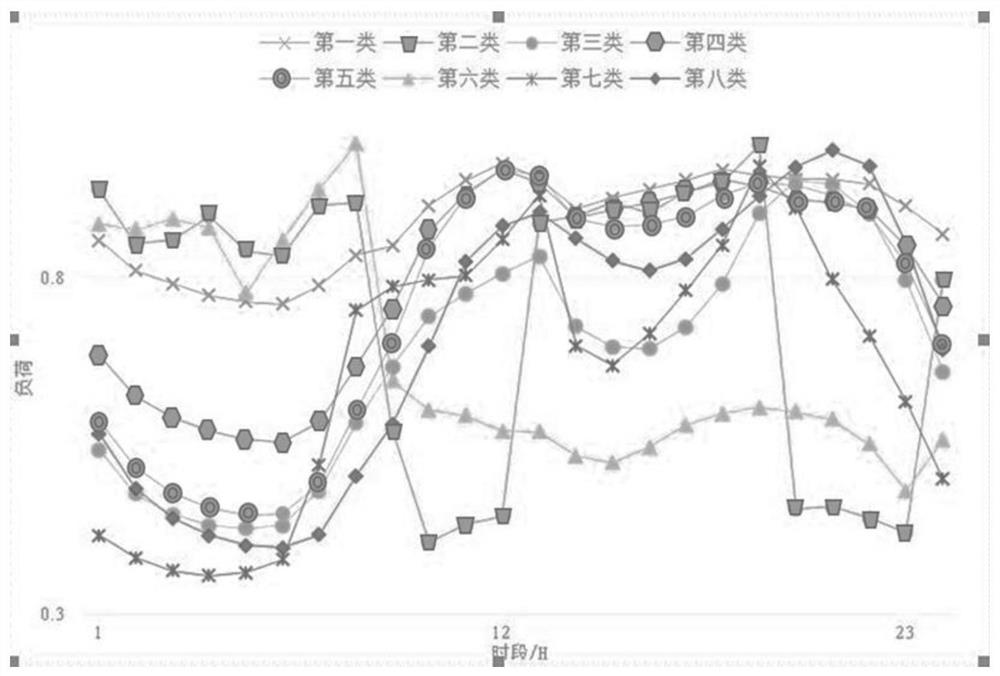
[0159] The annual load data of a city's power users in 2014, each group of load data sets are arranged in chronological order, the load collection interval is once an hour, and 1251 load curves are extracted. Clustering results such as image 3 shown. Depend on image 3 It can be seen that the classification results divide these load curves into eight load types, and these eight load types can be roughly divided into three types. Their characteristics are as follows:

[0160] The first type of load can be called "peak load", such as image 3 The load of the 3rd, 4th, 5th, 7th and 8th types of load is characterized by high load during the day and reaching the load valley period at night. like Figure 4c , 4g Among them, the third and seventh types of load have two obvious peak time periods, at 11:00-14:00 and 17:00-20:00. Such typical load enterprises are mostly in the retail industry, restaurants and other industries. Cater to peak times for guests. like Figure 4d , ...


PUM


Abstract

The invention discloses a power load curve clustering method, which comprises the steps of preprocessing historical load data to obtain a load data set; performing dimension reduction processing on the load data set to obtain a low-dimensional load data set; calculating the low-dimensional load data set by adopting a GSA elbow criterion method to obtain an optimal clustering number K; and performing clustering analysis on the low-dimensional load data set according to the optimal clustering number K to obtain a clustering result. Load is processed through a t-SNE dimension reduction technology, clustering analysis is carried out on the load by combining a GSA elbow criterion and a binary K-means algorithm, and experiments prove that the improved algorithm has better clustering quality.

Description

technical field [0001] The invention belongs to the technical field of load classification methods, and relates to a power load curve clustering method. Background technique [0002] With the liberalization and development of the electricity market, the market characteristics of diversified trading entities, more flexible trading methods, and more frequent trading times will gradually become prominent, which will be accompanied by massive trading information and power data, making efficient use of market trading. All kinds of information and load data are of great significance to ensure the stable and healthy development of the market. Analyzing different types of load patterns and exploring the characteristics of users' electricity consumption will help power generation companies and electricity sales companies to further understand various electricity consumption methods and their behavior habits, subdivide different target customers according to their characteristics, and...

Claims


Application Information

Patent Timeline
Patent Type & Authority Applications(China)
IPC IPC(8): G06K9/62G06Q10/06G06Q50/06
CPCG06Q10/0639G06Q50/06G06F18/213G06F18/23213
Inventor 张刚解佗张靠社罗军刚冯培基吕蒙解梦琰徐奔奔张丁予卿松
Owner XIAN UNIV OF TECH
Learn More