
Visualization method for situation awareness of power load section

A technology of situational awareness and power load, applied in the directions of visual data mining, structured data browsing, structured data retrieval, etc., can solve the problems of lack of data analysis, inability to reflect the operation volume of multiple dimensions at the same time, rough perception results, etc. Achieve high practical effect

Pending Publication Date: 2020-11-20
STATE GRID ZHEJIANG ELECTRIC POWER CO LTD SHAOXING POWER SUPPLY CO +2
View PDF1 Cites 0 Cited by
  • Summary
  • Abstract
  • Description
  • Claims
  • Application Information

AI Technical Summary

Problems solved by technology

[0004] However, the traditional visualization technology is often realized through the load thermal distribution under the two-dimensional scalar field, which has the problems of rough perception results, lack of data analysis, and the inability to reflect the operation volume of multiple dimensions at the same time

Method used


Image

  • Visualization method for situation awareness of power load section
  • Visualization method for situation awareness of power load section
  • Visualization method for situation awareness of power load section

Examples


Embodiment Construction

[0040] The application will be further described below in conjunction with the accompanying drawings. The following examples are only used to illustrate the technical solutions of the present invention more clearly, but not to limit the protection scope of the present application.

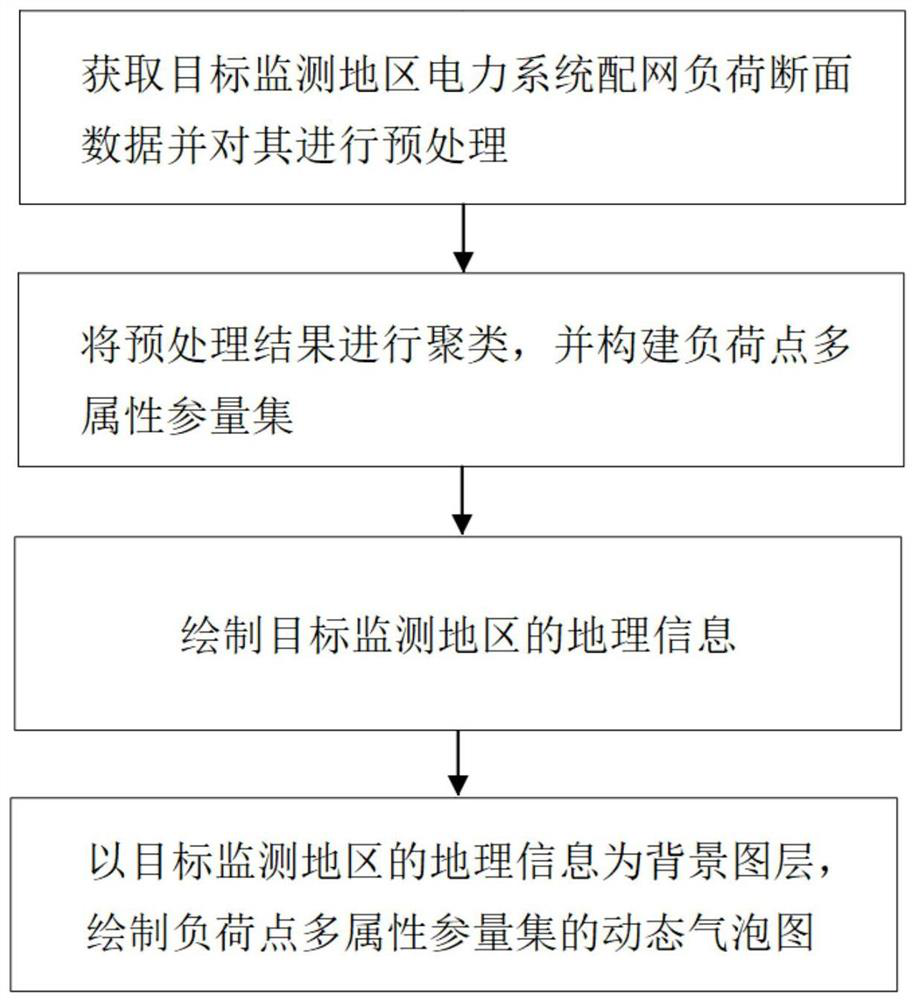
[0041] Such as figure 1 As shown, a visualization method for situational awareness of a power load section of the present application, the method includes the following steps:

[0042] Step 1: Obtain the load section data of the power system distribution network in the target monitoring area and preprocess it;

[0043] The distribution network load section data includes load data and geographic data, the load data is load value, and the geographic data includes relative longitude and relative latitude.

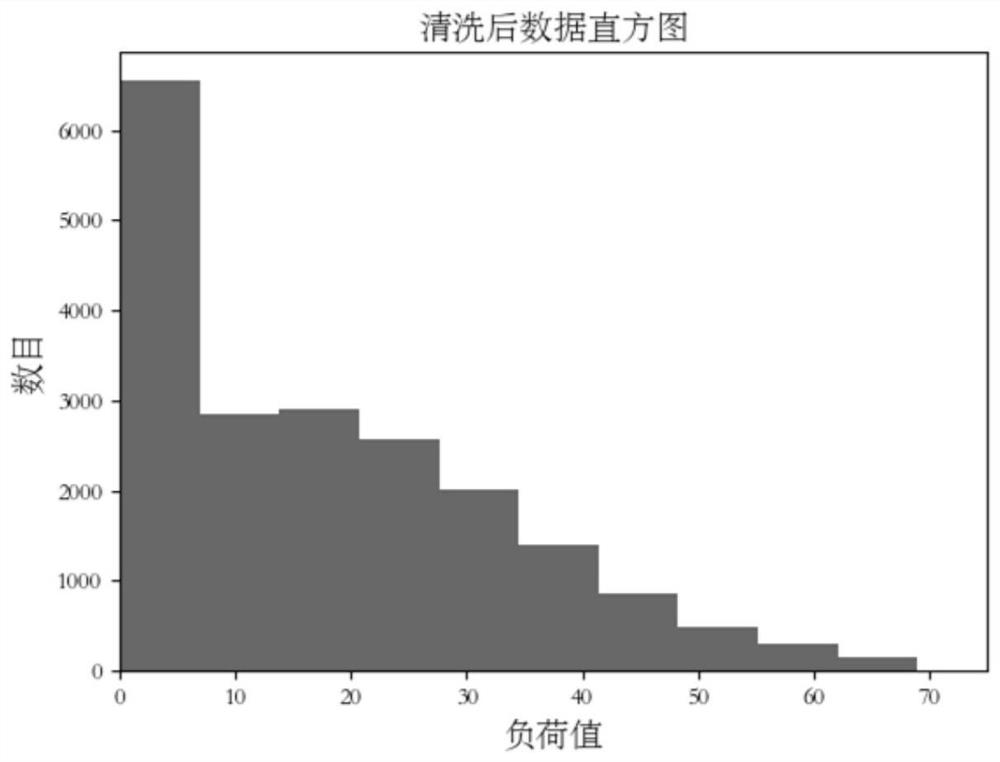
[0044] The original data has load data and geographical data. In order to complete the subsequent data mining more effectively, it is necessary to use the standard deviation method to clean the a...


PUM


Abstract

The invention discloses a visualization method for situation awareness of a power load section. The method comprises the following steps: acquiring distribution network load section data of a power system in a target monitoring area and preprocessing the data; clustering the preprocessing results, and constructing a load point multi-attribute parameter set; drawing geographic information of the target monitoring area; and drawing a dynamic bubble graph of the load point multi-attribute parameter set by taking the geographic information of the target monitoring area as a background graph layer,thereby achieving visualization of power load section situation awareness. According to the method, a distribution network multi-attribute parameter set is obtained through data preprocessing, analysis and mining, and the distribution network multi-attribute parameter set is visualized in an actual map in a dynamic bubble form, so that the distribution and development rules of loads can be effectively reflected, and the method has relatively high practicability.

Description

technical field [0001] The invention belongs to the technical field of power system load visualization, and relates to a visualization method for situation awareness of a power load section. Background technique [0002] The purpose of visual analysis of power grid operation is to help dispatching technicians extract effective information from massive power data, and assist technicians to improve their situational awareness of real-time power grid operation. [0003] For example, CN201410715334.7 proposes a visualization system based on power load flow calculation, including a power plant voltage acquisition module, a substation voltage acquisition module, a data summary module, an equivalent module, a power flow calculation module, a power flow analysis module and a display module. The power plant voltage acquisition module and substation voltage acquisition module are respectively connected to the data summary module, the data summary module is connected to the equivalent ...

Claims


Application Information

Patent Timeline
Patent Type & Authority Applications(China)
IPC IPC(8): G06F16/215G06F16/2458G06F16/26G06K9/62G06Q50/06
CPCG06F16/215G06F16/2465G06F16/26G06Q50/06G06F18/23213
Inventor 章剑光王锋华黄建平林海峰王有元张磊张永建陈浩凌玲张宇波谢颖杨剑峰韩保礼
Owner STATE GRID ZHEJIANG ELECTRIC POWER CO LTD SHAOXING POWER SUPPLY CO
Learn More