Poly(diacetylene) sensor arrays for characterizing aqueous solutions
A technology of sensor arrays and polydiacetylene, applied in instruments, scientific instruments, and analysis using chemical indicators, can solve complex labor intensity and other problems
- Summary
- Abstract
- Description
- Claims
- Application Information
AI Technical Summary
Problems solved by technology
Method used
Image
Examples
Embodiment 1
[0300] Example 1 - Sensor stability when exposed to ambient environment
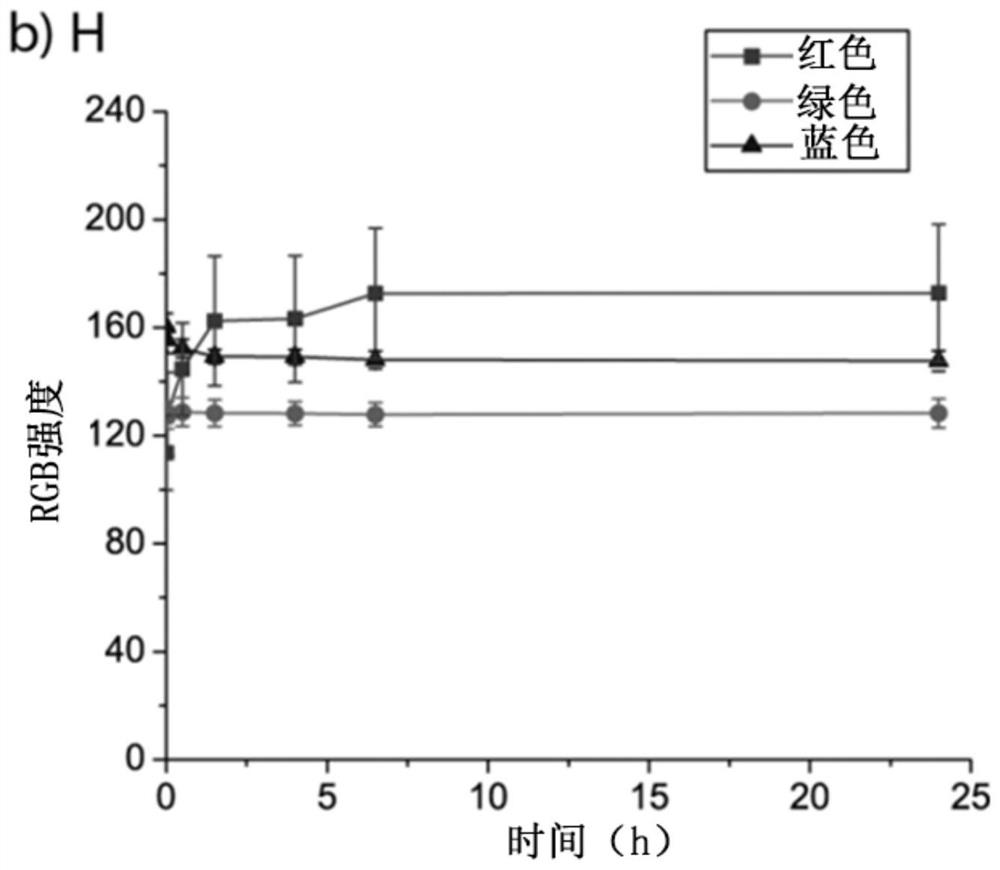
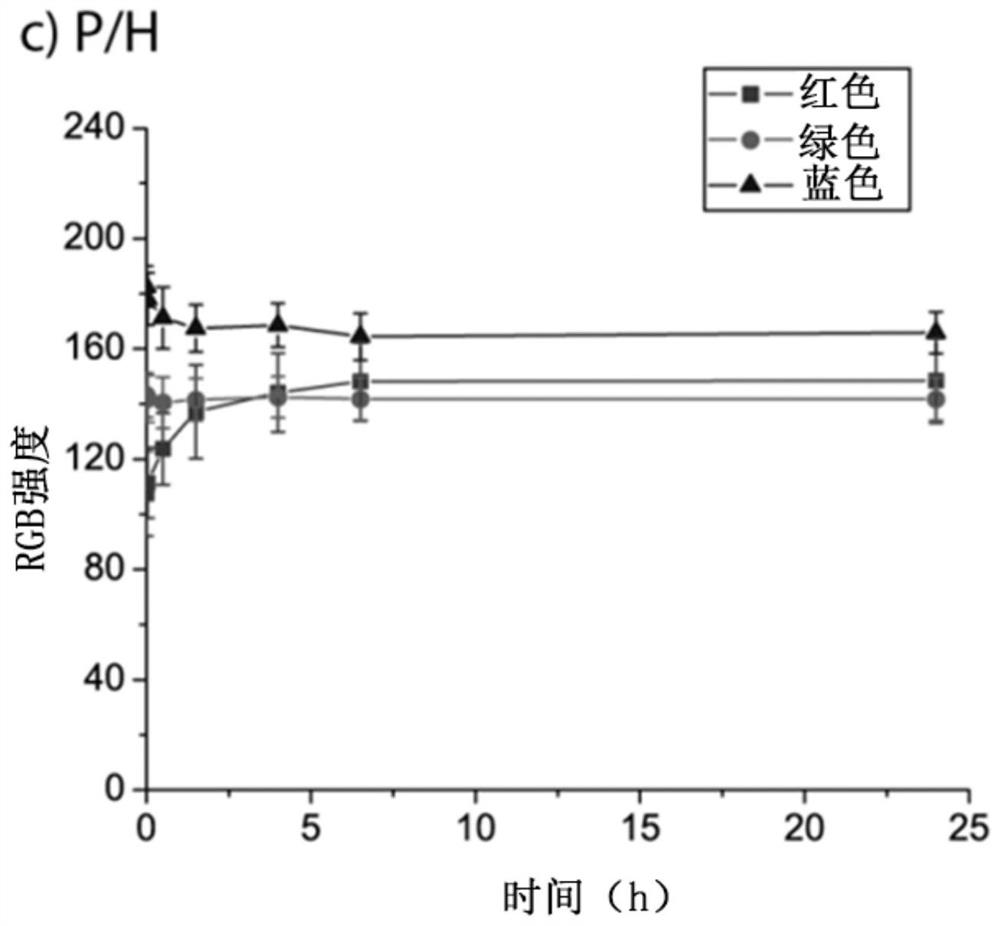
[0301] Paper-based PDA sensors were fabricated from 1 mM H, P, and T and their mixtures (H / T, P / H, and T / P, all 1:1 by volume). To characterize the stability of the paper-based PDA sensors, i.e. their propensity to change color in the absence of any specific stimulus, they were exposed to the environment for between 2 min and 1440 min, and the RGB changes were compared with the sensor at time 0. Scanned pictures of the sensor array visually show that all sensors containing H are red-shifted, while others retain their original blue color.
[0302] Specific RGB intensity maps confirm this observation ( Figure 1a to Figure 1f ). These figures also show that the H-containing sensor is stable after about 7 hours. Therefore, for all subsequent experiments, the paper-based PDA sensor was reused approximately 12 h after fabrication.
Embodiment 2
[0303] Example 2 - Plotting Water-Ethanol Mixtures: DA Monomer Ratio
[0304] As a first step to using paper-based PDA sensors in the context of alcoholic beverages, the effect of ethanol (EtOH) in water on the RGB color change has to be considered.
[0305] Different paper-based PDA sensors were fabricated from 1 mM H, P, and T and their mixtures (H / T, P / H, and T / P, 3:1, 1:1, and 1:3 volume ratios). These arrays were evaluated after exposure to 100% EtOH, 10% EtOH, and 100% ultrapure water (H 2 O) RGB color change before and after. Scanned images of the sensor show a strong red shift for 100% EtOH in all cases. Further, only sensors containing H were exposed to 10% EtOH and 100% H 2 O showed a visible color change. Specific RGB intensity plots confirm that 100% EtOH causes the largest changes in red and blue for all tested sensors, while the H-containing sensor was exposed to 10% EtOH and 100% H 2 The variation of O is dominant (Fig. 2a to Fig. 2c).
[0306] Effective...
Embodiment 3
[0307] Example 3 - Plotting Water-Ethanol Mixtures: DA Monomer Concentration
[0308] Next, to further improve the sensitivity and selectivity of the sensor array assembled from T and P, the DA concentration used for its fabrication was decreased stepwise from 100 mM to 10 mM. We hypothesized that lower amounts of PDA on paper might exhibit more sensitive responses when exposed to different solutions. Since the response from the sensor composed of H (moiety) showed a visible color shift from blue to red when 100 mM DA was used during fabrication, lower concentrations were not tested for this component.
[0309] Sensor arrays fabricated from different concentrations of T, T / P (1:1 volume ratio), and P were exposed to 100% EtOH, 10% EtOH, and 100% H 2 Scanned images before and after O revealed a visible color shift from blue to red that varied according to different DA concentrations. Specific RGB intensity maps supported this qualitative assessment (Fig. 3a to 3c). Specifi...
PUM
 Abstract
Description
Claims
Application Information
 - Generate Ideas
- Intellectual Property
- Life Sciences
- Materials
- Tech Scout
- Unparalleled Data Quality
- Higher Quality Content
- 60% Fewer Hallucinations
Browse by: Latest US Patents, China's latest patents, Technical Efficacy Thesaurus, Application Domain, Technology Topic, Popular Technical Reports.
© 2025 PatSnap. All rights reserved.Legal|Privacy policy|Modern Slavery Act Transparency Statement|Sitemap|About US| Contact US: help@patsnap.com


