


Quick Research
Generate reliable direction feasibility study reports for your R&D in just a few steps.

Technical Q&A
Discover and master advanced knowledge NOW. Basics, ideas, possibilities, all at once.

Find Solutions
As an expert in R&D theories, this can generate solutions to your technical problems instantly.

Evaluate Feasibility
Analyze your overall solution with one click, know your potential R&D risks in advance.

Monitor Landscape
Get weekly tech updates, stay abreast of the latest tech innovations and key insights.
Lithium iron phosphate power battery life prediction method
A power battery and life prediction technology, applied in the direction of measuring electricity, measuring devices, measuring electric variables, etc., can solve the difficulties of capacity prediction, cycle life prediction, and increase the difficulty of cycle life prediction of lithium iron phosphate power batteries, etc., to achieve The effect of high practical value
- Summary
- Abstract
- Description
- Claims
- Application Information
AI Technical Summary
Problems solved by technology
Method used
Image


Examples
Embodiment 1
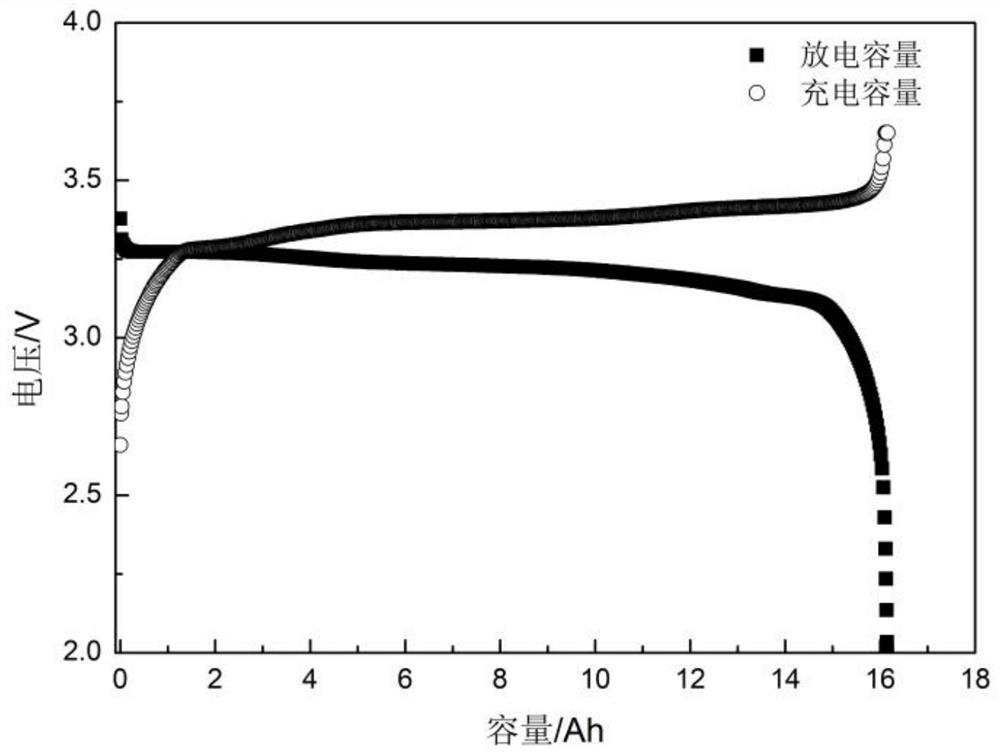
[0025] Carry out the life test of lithium iron phosphate power battery under real vehicle conditions, record the statistical data of charging capacity and discharging capacity during the cycle; use the statistical data to study the relationship between the charging capacity and discharging capacity of the battery, that is, the sample capacity during the entire life process Efficiency changes, such as image 3 shown.
[0026] from image 3 It can be seen that the Coulombic efficiency of the sample remains unchanged throughout the cycle test, and the decay curves of the charge capacity and discharge capacity basically coincide. Therefore, it is feasible to replace the discharge capacity with the charge capacity.
Embodiment 2
[0028] Comparative analysis of the changing law of the charging capacity and the changing law of the discharging capacity in different voltage ranges. In this example, different charging voltage intervals are selected, including four voltage intervals [3.0-3.3], [3.3-3.4], [3.4-3.6], and [3.3-3.6], and the focus is on analyzing different voltage intervals during the cycle. The change law of the charging capacity corresponding to the interval, such as Figure 4 shown.
[0029] from Figure 4 It can be seen from the figure that the voltage range is different, and the variation law is quite different. The capacity of individual intervals shows a fluctuating upward trend, and the capacity of individual intervals fluctuates in the early stage and slowly declines in the later stage. However, the selection of the voltage range used for life prediction should meet two conditions: continuous decay and high resolution. Therefore, the charging capacity in the voltage range [3.3-3.6] ...
Embodiment 3
[0031] Using the discharge capacity as the life characterization index, analyze the life prediction model, such as Figure 5 shown. Using interval charging capacity as the life characterization index, analyze the life prediction model, such as Image 6 shown. from Figure 5 , Image 6 It can be seen from the figure that the discharge capacity and interval charge capacity of the battery whose capacity retention rate decays to 65% both show a two-stage decay law, with the 880th cycle (capacity retention rate between 85%-90%) as the dividing line. In the first stage, there is a linear decay trend. In the second stage, it is a nonlinear attenuation, and the attenuation law conforms to a quadratic polynomial.
[0032] The actual values of the discharge capacity and interval charge capacity are respectively used as the true value of the life characterization index to analyze the accuracy of the prediction model, as shown in the table below.
[0033]
[0034]
[0035] I...
PUM
 Abstract
Description
Claims
Application Information
 - R&D Engineer
- R&D Manager
- IP Professional
- Industry Leading Data Capabilities
- Powerful AI technology
- Patent DNA Extraction
Browse by: Latest US Patents, China's latest patents, Technical Efficacy Thesaurus, Application Domain, Technology Topic, Popular Technical Reports.
© 2024 PatSnap. All rights reserved.Legal|Privacy policy|Modern Slavery Act Transparency Statement|Sitemap|About US| Contact US: help@patsnap.com