Load curve data visualization method based on combination of supervised and unsupervised algorithms

A technology of curve data and load curve, applied in the field of load data processing on the user side of smart grid, can solve the problems of classification result influence, low accuracy of label data, etc., to achieve the effect of optimizing internal parameters, high accuracy of data processing, and improving fitness

Pending Publication Date: 2019-10-11
SHANGHAI UNIVERSITY OF ELECTRIC POWER
View PDF5 Cites 5 Cited by
  • Summary
  • Abstract
  • Description
  • Claims
  • Application Information

AI Technical Summary

Problems solved by technology

However, the existing literature generally only considers the distance similarity criterion in the process of obtaining label data, and the accuracy of the obtained label data is low, which will have a certain impact on the final classification results.

Method used


Image

  • Load curve data visualization method based on combination of supervised and unsupervised algorithms
  • Load curve data visualization method based on combination of supervised and unsupervised algorithms
  • Load curve data visualization method based on combination of supervised and unsupervised algorithms

Examples


Embodiment

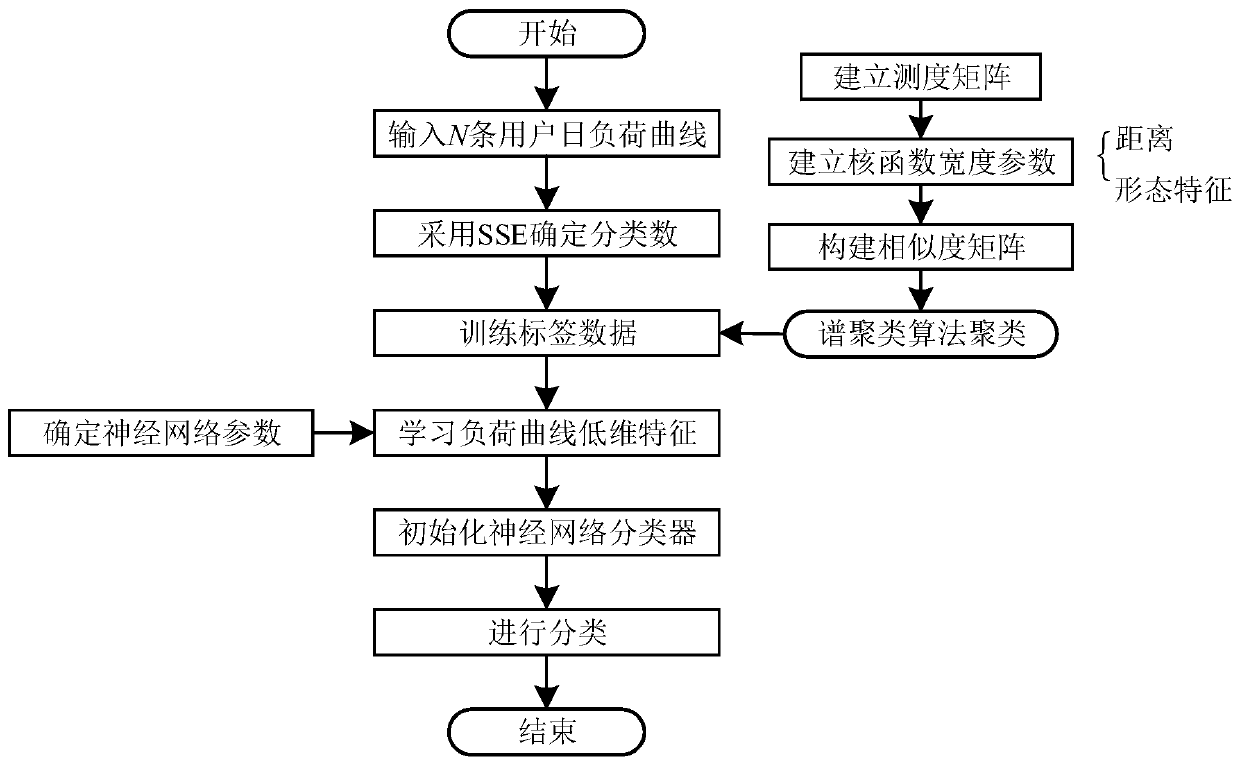
[0054] Such as figure 1 Shown is the specific flow diagram of the load curve data visualization method based on the combination of supervised and unsupervised algorithms in the present invention, which specifically includes the following steps:

[0055] 1) Determine the optimal number of clusters K by sum of squared error (SSE);

[0056] 2) Select partial load curves and cluster them by bi-scale spectral clustering to obtain category label data;

[0057] 21) Distance similarity measure:

[0058] Euclidean distance is used to judge the distance similarity between curves. Euclidean distance refers to the real distance between two points in m-dimensional space. Load curve x i with y i The Euclidean distance between is defined as:

[0059]

[0060] In the formula, a i,j Indicates the Euclidean distance between two user power load curve data i and j, m represents the dimension, k, i and j are natural numbers, x i,k and x j,k Respectively represent the data values ​​corr...


PUM


Abstract

The invention relates to a load curve data visualization method based on the combination of supervised and unsupervised algorithms, and the method comprises the steps: firstly obtaining the precise label data of a load curve through employing an unsupervised optimization spectral clustering algorithm based on the double-scale similarity measurement of distance and curve form; secondly, learning intrinsic characteristics of a large-scale to-be-classified load curve by adopting a sparse automatic encoder neural network to obtain a hidden layer weight matrix, namely an optimized initial parameterof the neural network; and finally, based on the obtained label data, training a support vector machine neural network classifier to realize supervised classification of the large-scale to-be-classified load curves. Supervised and unsupervised algorithms are combined, so that more accurate load curve category label data can be obtained, and the problem of relatively low calculation efficiency caused by big data is improved to a certain extent.

Description

technical field [0001] The invention relates to a user-side load data processing method of a smart grid, in particular to a load curve data visualization method based on a combination of supervised and unsupervised algorithms. Background technique [0002] With the increasing requirements of power grid users on the use of electric energy in many aspects, the society has gradually exposed problems such as resource shortages. In order to cope with the energy shortage problem, the country has further opened up the electricity sales market while accessing a high proportion of renewable energy, so that users have more freedom in choosing electricity. The resulting high degree of freedom at the user end leads to more diversified load curves. There are certain potential rules in the electricity consumption behavior of users in terms of seasons and time periods. Using clustering or classification technology to analyze the load curve is an important means to understand the characte...

Claims


Application Information

Patent Timeline
IPC IPC(8): G06F16/28G06N3/04G06Q10/06G06Q50/06
CPCG06F16/285G06N3/04G06Q10/0637G06Q50/06Y04S10/50
Inventor 林顺富顾乡刘持涛颜昕昱
Owner SHANGHAI UNIVERSITY OF ELECTRIC POWER
Why Eureka
Try Eureka