Color image color consistency description method
A color image, consistent technology, applied in image enhancement, image analysis, image data processing, etc., can solve the problem of different image appearance
- Summary
- Abstract
- Description
- Claims
- Application Information
AI Technical Summary
Problems solved by technology
Method used
Image
Examples
Embodiment 1
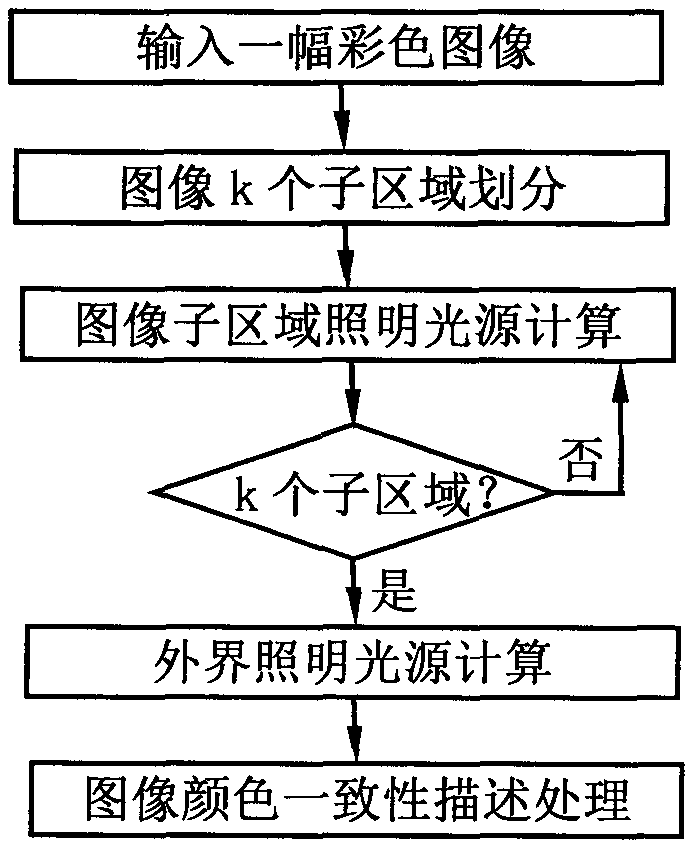
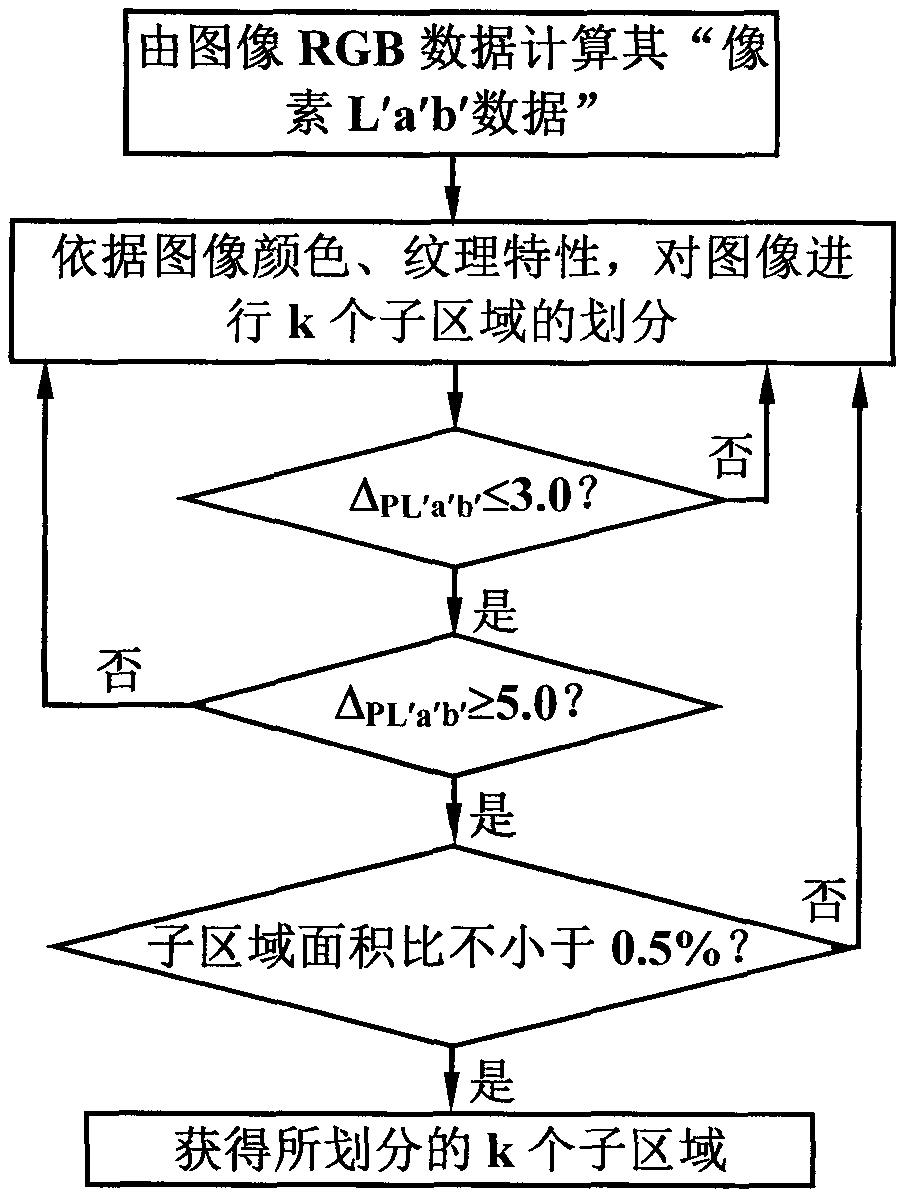
[0069] Image 6 (a) is a color image captured by a digital acquisition device, the overall tone of the image is reddish, the size of the image is 3328×2496 pixels, and the range of color values of image pixels R, G, and B is 0-255, Ω =255. see Figure 1-4 And steps 1-4, using the R, G, B data of the image and the technical solution provided by the present invention to obtain the L', a', b' data of the image and carry out cluster analysis of k sub-region divisions on the image, preferably , select the "K-means" method for clustering, and obtain the sub-regional division image of the "k sub-regional division" of the image, and its display effect is as follows Image 6 As shown in (b), the k sub-regions are all geometric shapes that do not have a square or a rectangle, and the conditions for dividing the image sub-regions are as follows: the ratio of the pixel area of the smallest sub-region to the total area of the image is 0.55%, within the sub-region Δ PL′a′b′ The ma...
Embodiment 2
[0072] Figure 7 (a) is a color image captured by a digital acquisition device, the R, G, and B color values of the image range from 0 to 1024, Ω=1024, the size of the image is 3328×2496 pixels, and the overall tone of the image Weak, dark. see Figure 1-4 And steps 1-4, using the R, G, B data of the image and the technical solution provided by the present invention to obtain the L', a', b' data of the image and carry out cluster analysis of k sub-region divisions on the image, preferably , select the "K-means" method for clustering, and obtain the sub-regional division image of the "k sub-regional division" of the image, and its display effect is as follows Figure 7 As shown in (b), the k sub-regions are all geometric shapes that do not have a square or a rectangle, and the conditions for dividing the image sub-regions are as follows: the ratio of the pixel area of the smallest sub-region to the total area of the image is 1.5%, within the sub-region Δ PL′a′b′ The m...
Embodiment 3
[0076] Figure 8 (a) is a color image captured by a digital acquisition device, the overall tone of the image is greenish, the size of the image is 3328×2496 pixels, and the range of color values of image pixels R, G, and B is 0-255, Ω =255. see Figure 1-4 And steps 1-4, using the R, G, B data of the image and the technical solution provided by the present invention to obtain the L', a', b' data of the color image, and carry out the cluster analysis of k sub-region divisions to the image, Preferably, the "K-means" method is selected for clustering, and the sub-region division image of "k sub-region division" of the image is obtained, and the display effect diagram is as follows Figure 8 As shown in (b), two of the k sub-regions are square or rectangular geometric shapes, and the image division conditions adopted are: the ratio of the pixel area of the smallest sub-region to the total image area is 0.5%, and the Δ PL′a′b′ The maximum value of is 3.0, and the Δ between...
PUM
 Abstract
Description
Claims
Application Information
 - Generate Ideas
- Intellectual Property
- Life Sciences
- Materials
- Tech Scout
- Unparalleled Data Quality
- Higher Quality Content
- 60% Fewer Hallucinations
Browse by: Latest US Patents, China's latest patents, Technical Efficacy Thesaurus, Application Domain, Technology Topic, Popular Technical Reports.
© 2025 PatSnap. All rights reserved.Legal|Privacy policy|Modern Slavery Act Transparency Statement|Sitemap|About US| Contact US: help@patsnap.com


