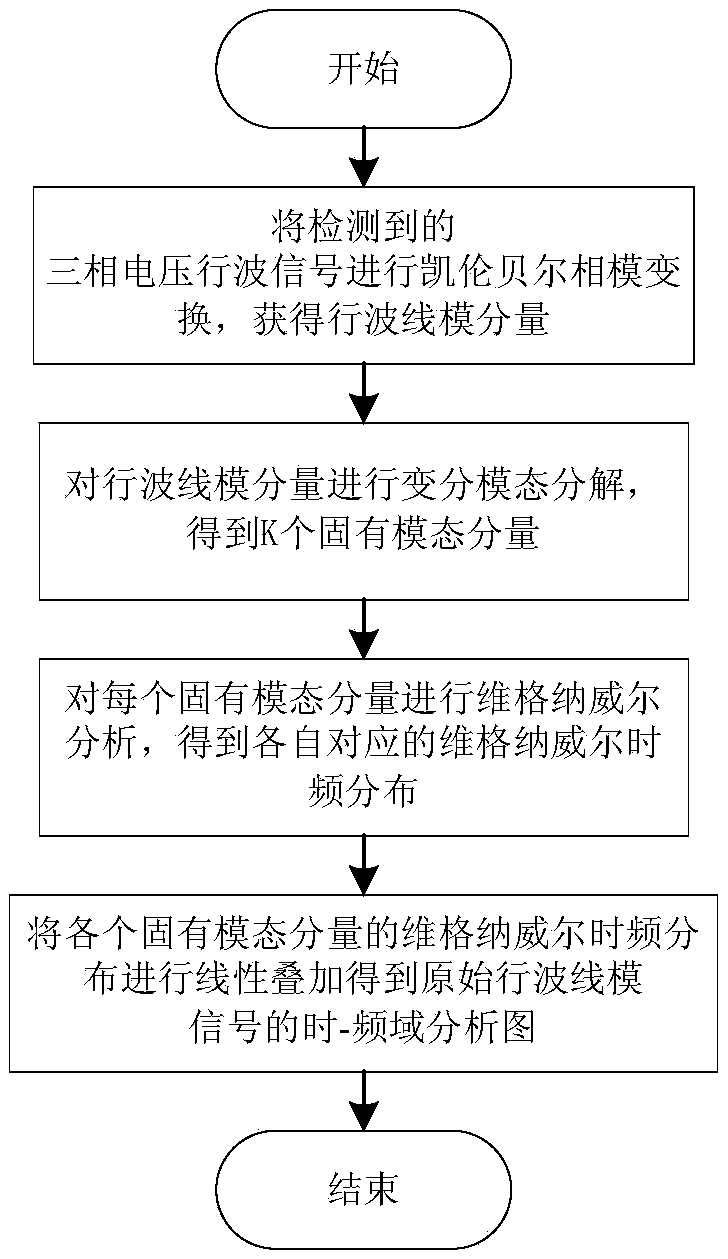
Traveling wave time-frequency analysis method based on variational mode decomposition and Wigner-ville distribution
A technology of variational mode decomposition and time-frequency analysis, applied in the field of power system, can solve the problems of high-frequency signal attenuation, no traveling wave time-frequency analysis method, insufficient fault information, etc.
- Summary
- Abstract
- Description
- Claims
- Application Information
AI Technical Summary
Problems solved by technology
Method used
Image
Examples
Embodiment 1
[0128] Embodiment 1: Time-Frequency Analysis of Simulated Traveling Wave Signal
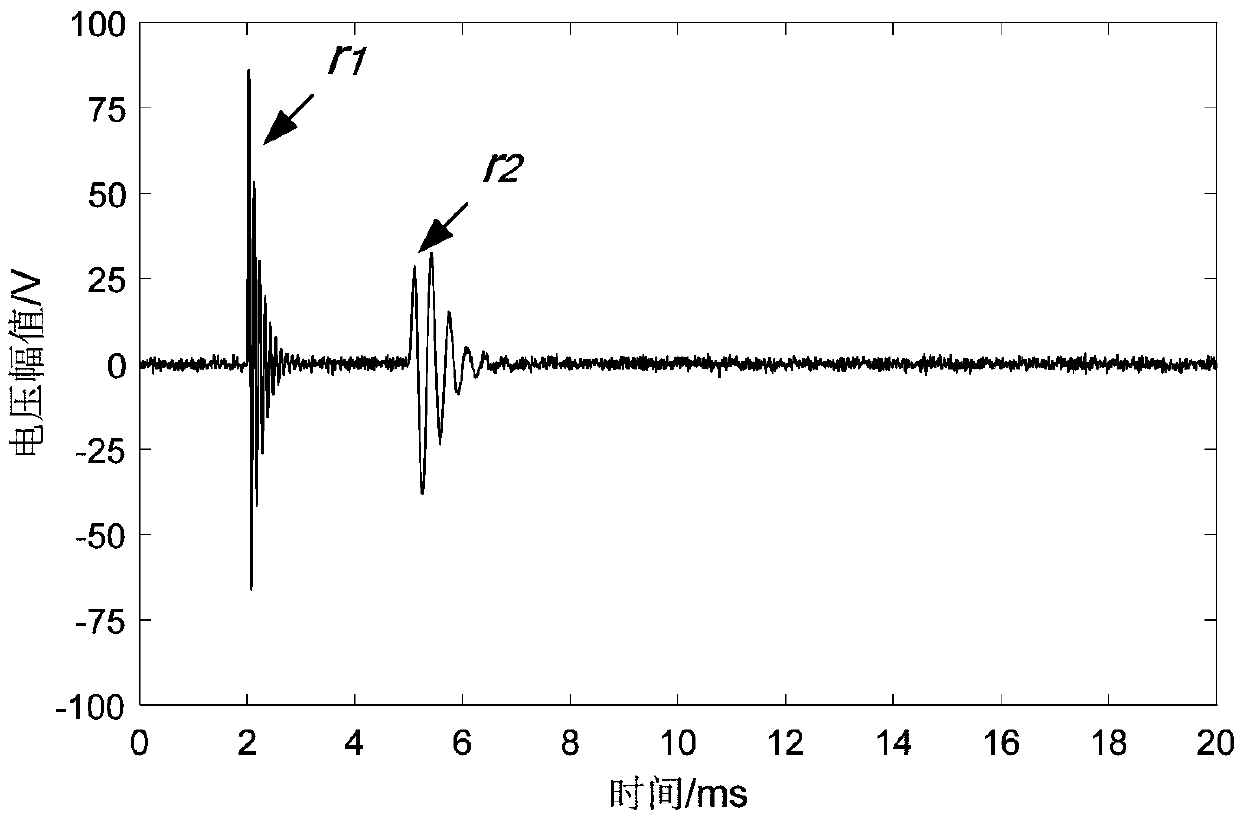
[0129] In order to verify the effectiveness of this method for the time-frequency analysis of fault traveling wave signals, a fault traveling wave simulation signal is constructed according to the mathematical model of fault traveling waves. Botou r 1 、r 2 and Gaussian distributed noise v k Composition, as shown in formula (1):
[0130]
[0131] In the formula, t represents time, z k To simulate the analog traveling wave signal, r 1 、r 2 It is a single-exponential and double-exponential attenuation oscillation function, which is used to simulate the high-frequency initial traveling wave and subsequent traveling wave reflection. Considering the dispersion phenomenon in the initial traveling wave transmission and transmission process, f 1 and f 2 Take different frequencies: 10kHz and 3kHz; A 1 and A 2 is traveling wave botou r 1 、r 2 the amplitude of v k is noise, it obeys Gaussian d...
Embodiment 2
[0137] Embodiment 2: Time-Frequency Analysis of Actual Fault Traveling Wave Signal
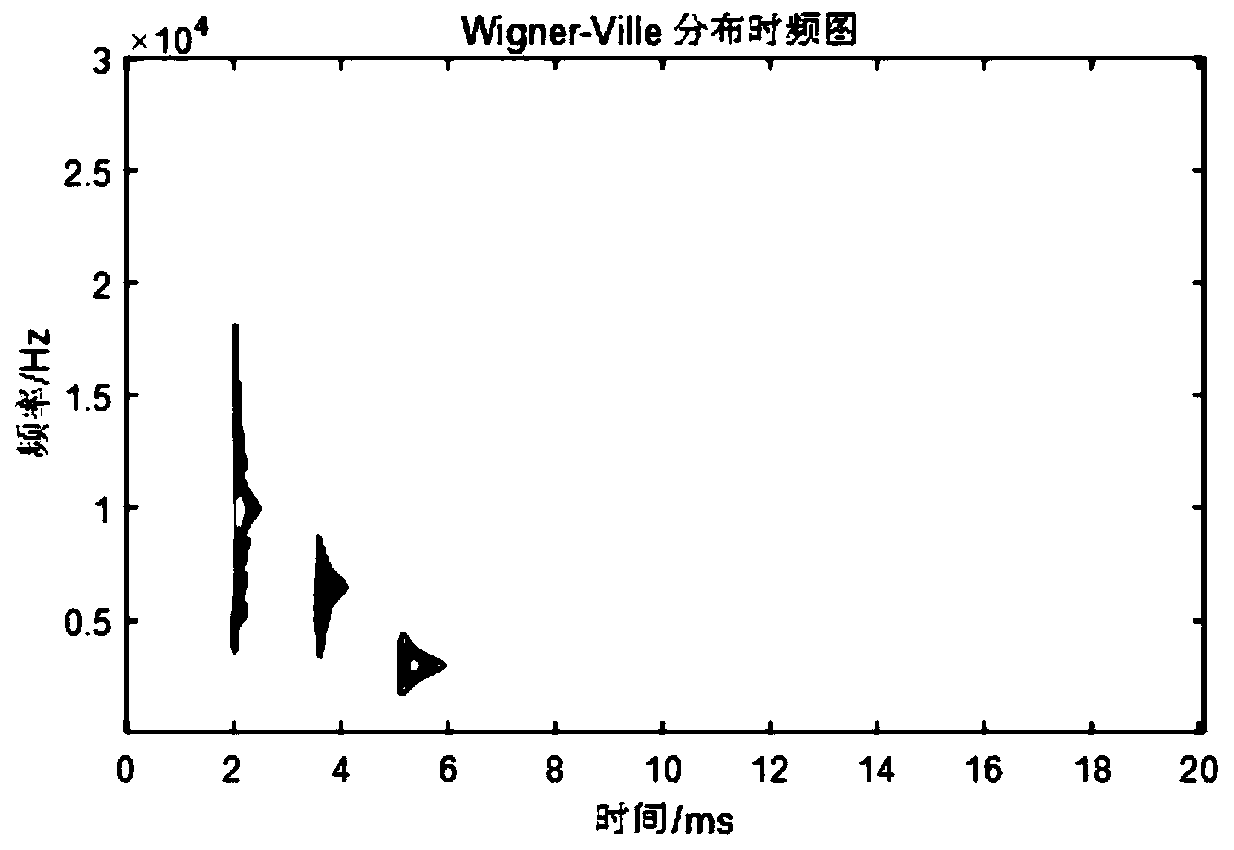
[0138] Figure 5 A 500kV high-voltage transmission line is shown, at a position f 25km away from the detection point M 1 A single phase-to-ground fault occurs (the transition resistance is R k is 50Ω / fault initial phase angle δ° is 90°), fault component U aF It is opposite to the direction in which the voltage is equal and opposite in the normal load state at this point, and the sampling rate is 0.1MHz. The actual fault traveling wave waveform detected at the detection point M is as follows Figure 6 shown. right Figure 6 VMD and Wigner-Ville distribution analysis of fault traveling wave shown in time domain is carried out to obtain Figure 7 The time-frequency distribution diagram of the actual fault traveling wave based on VMD and Wigner-Ville distribution is shown. From the time-frequency analysis diagram, the time-frequency joint distribution of the fault traveling wave can be clear...
PUM
 Abstract
Description
Claims
Application Information
 - R&D Engineer
- R&D Manager
- IP Professional
- Industry Leading Data Capabilities
- Powerful AI technology
- Patent DNA Extraction
Browse by: Latest US Patents, China's latest patents, Technical Efficacy Thesaurus, Application Domain, Technology Topic, Popular Technical Reports.
© 2024 PatSnap. All rights reserved.Legal|Privacy policy|Modern Slavery Act Transparency Statement|Sitemap|About US| Contact US: help@patsnap.com


