
Fine line loss analysis system

A technology for analyzing system and line loss, applied in the field of low-voltage distribution network, which can solve the problems of complex power supply environment, random migration of meters, and difficulty in troubleshooting.

Active Publication Date: 2019-04-12
STATE GRID HUNAN ELECTRIC POWER +2
View PDF10 Cites 23 Cited by
  • Summary
  • Abstract
  • Description
  • Claims
  • Application Information

AI Technical Summary

Problems solved by technology

[0003] 1. Statistical management: If the basic data of the station area is not perfect, the line loss assessment lacks authenticity, including the CCS system does not match the site, public change files are not entered into the CCS system, there are households without meters, and meters are relocated at will. And the GIS system does not match the site, and the GIS system data cannot be updated in time according to the site changes, resulting in various situations such as the inconsistency between the CCS and the GIS system
[0004] 2. Incorrect household relationship: For example, the phenomenon of private connection and random connection left over from the history of the old station area leads to the complexity of the power supply environment and the untimely handover of the newly added public transformer. Electricity is used, but the system has not yet entered user information for meter reading, resulting in different periods of billing electricity in the total score meter, resulting in an abnormal line loss rate in the station area
However, this type of method can only roughly determine the line loss of the entire station area, and cannot determine the cause and specific location of the line loss. However, due to the large number of users in the station area, the usual topological structure and complex lines in the station area, the above statistical management aspects, Errors in user relationship, metering device failure, and user electricity theft will make troubleshooting more difficult. Once an abnormal line loss area is found, it will be difficult to accurately locate the fault point and reduce line loss in many branch lines. chemical analysis

Method used


Image

  • Fine line loss analysis system
  • Fine line loss analysis system
  • Fine line loss analysis system

Examples


Embodiment Construction

[0029] The present invention will be further described below in conjunction with the accompanying drawings and specific preferred embodiments, but the protection scope of the present invention is not limited thereby.

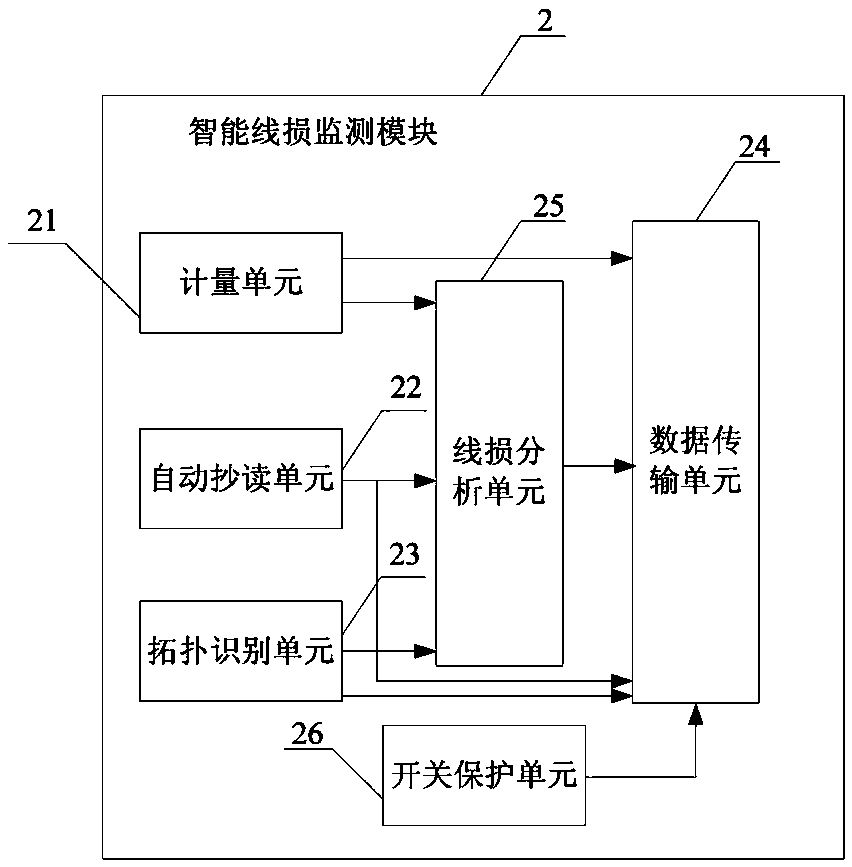
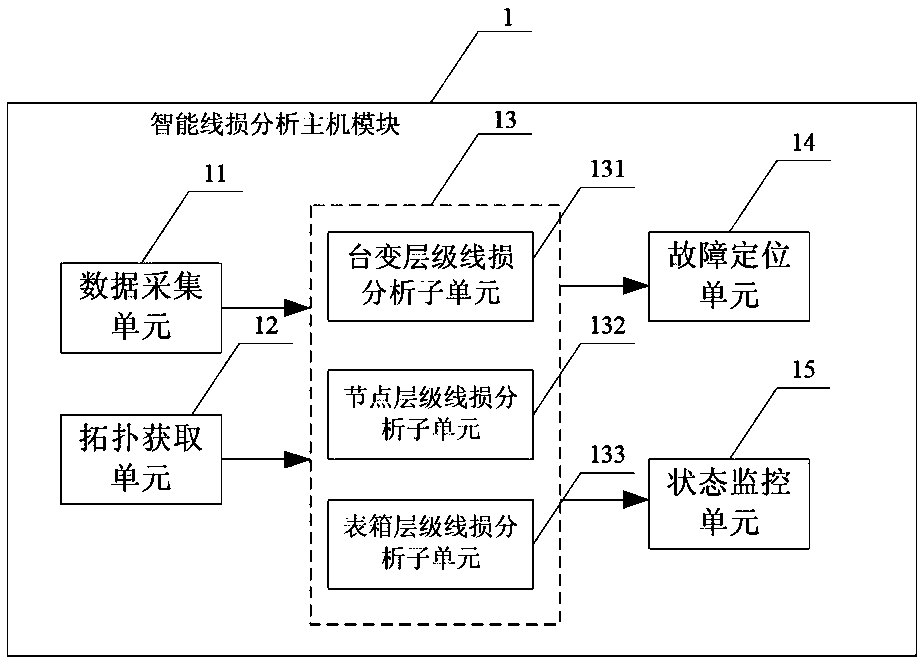
[0030] like figure 1 As shown, the fine line loss analysis system of this embodiment includes an intelligent line loss analysis host module 1 and a plurality of monitoring modules 2 connected to the intelligent line loss analysis host module 1. At the branch node of each low-voltage branch line and the side of each user meter box, to monitor the distribution transformer side, the branch node of each low-voltage branch line, the metering data of each user meter box side, and each branch in each user meter box The metering data of the household meter, the intelligent line loss analysis host module 1 respectively collect the total meter data of the station area and the metering data monitored by each monitoring module 2 in real time, and compare the received meteri...


PUM


Abstract

The invention discloses a fine line loss analysis system, which comprises an intelligent line loss analysis host module and a plurality of monitoring modules connected to the intelligent line loss analysis host module. The monitoring modules are respectively arranged at a side of a distribution transformer of a station area, branch nodes of each low-voltage branch line, and the side of each user meter box. The monitoring modules are used for separately monitoring the distribution transformer side, the branch nodes of each low-voltage branch line, the metering data of each user meter box, and the metering data of each branch household meter in each user meter box. The intelligent line loss analysis host module collects the total area data of the station area and the measurement data monitored by each monitoring module in real time, and compares the received measurement data according to a hierarchical structure of a distribution network of the station area to obtain and output the lineloss analysis result. According to the fine line loss analysis system, the fine line loss analysis of the station area can be realized. The method has advantages of simple realization, low cost, highprecision, stability and reliability, and the like.

Description

technical field [0001] The invention relates to the technical field of low-voltage distribution networks, in particular to a fine line loss analysis system. Background technique [0002] The line loss of the low-voltage distribution transformer area is the power loss and loss generated from the output of the distribution transformer to the user's electric energy meter during the power supply process. The line loss can reflect the balance between supply and sales of the distribution network, resulting in a Line loss mainly has the following reasons: [0003] 1. Statistical management: If the basic data of the station area is not perfect, the line loss assessment lacks authenticity, including the CCS system does not match the site, public change files are not entered into the CCS system, there are households without meters, and meters are relocated at will. And the GIS system does not match the site, and the GIS system data is not updated in time according to the site changes...

Claims


Application Information

Patent Timeline
Patent Type & Authority Applications(China)
IPC IPC(8): G01R21/00G01R31/08
CPCG01R21/00G01R31/085
Inventor 熊德智陈向群刘小平杨茂涛唐运朱军雁郭丁荧
Owner STATE GRID HUNAN ELECTRIC POWER
Learn More