
Method for performing frequency analysis and synchronously drawing frequency curve in Excel

A frequency curve and frequency analysis technology, applied in the field of mathematics and engineering design, can solve the problem of time-consuming, uneditable frequency curve graph, etc., to achieve the effect of shortening the working time

Inactive Publication Date: 2018-08-24
蒋沛漪
View PDF2 Cites 1 Cited by
  • Summary
  • Abstract
  • Description
  • Claims
  • Application Information

AI Technical Summary

Problems solved by technology

[0004] The shortcoming of prior art mainly contains two aspects: (1) for given frequency, when calculating its design value, need look up attached table, the time spent is more; (2) existing is executable VB program, not VBA When applied in Excel, the frequency curve graph generated after the visual line fitting cannot be edited

Method used

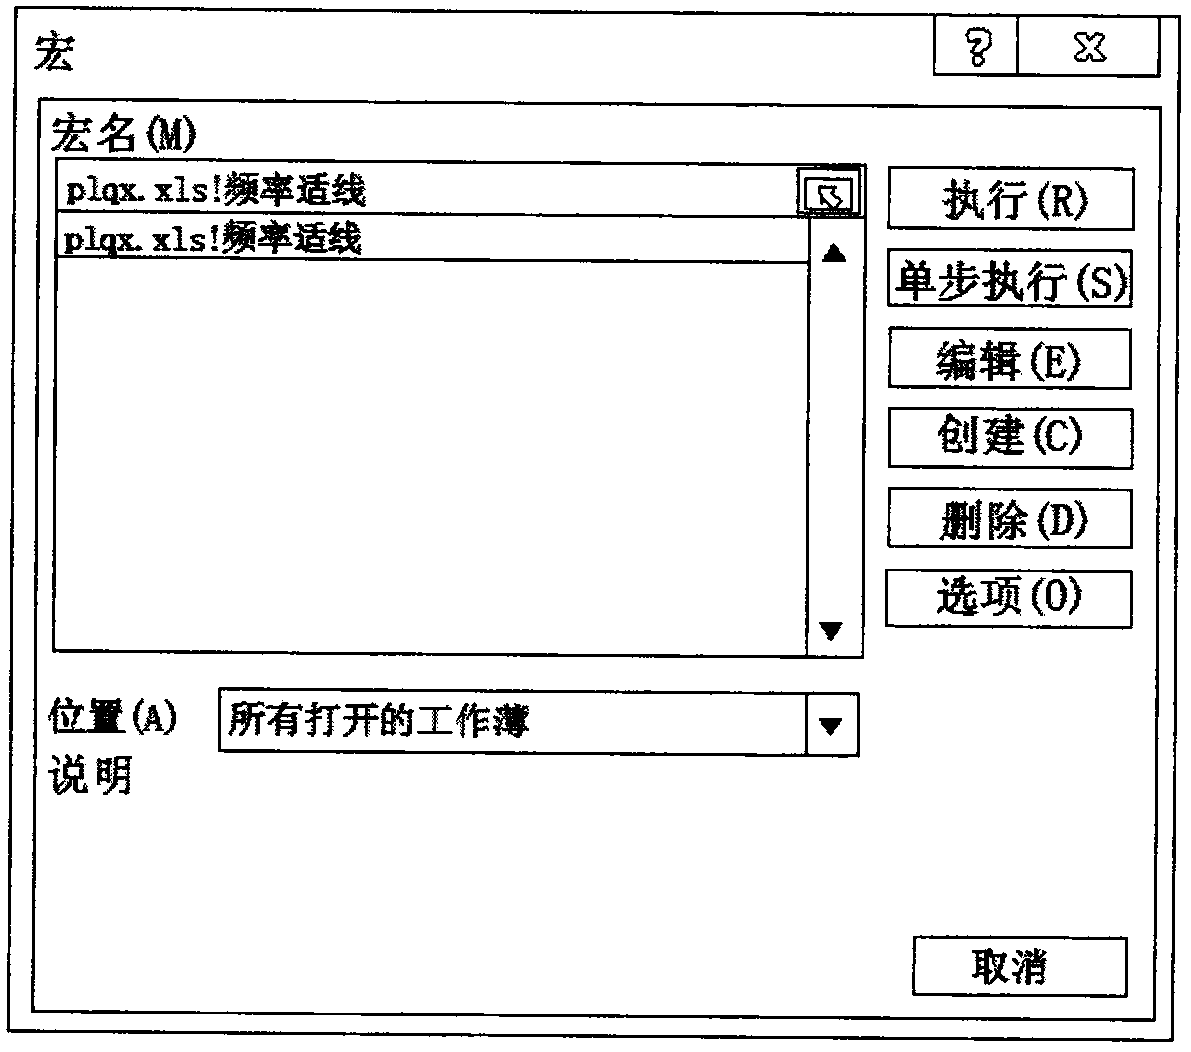
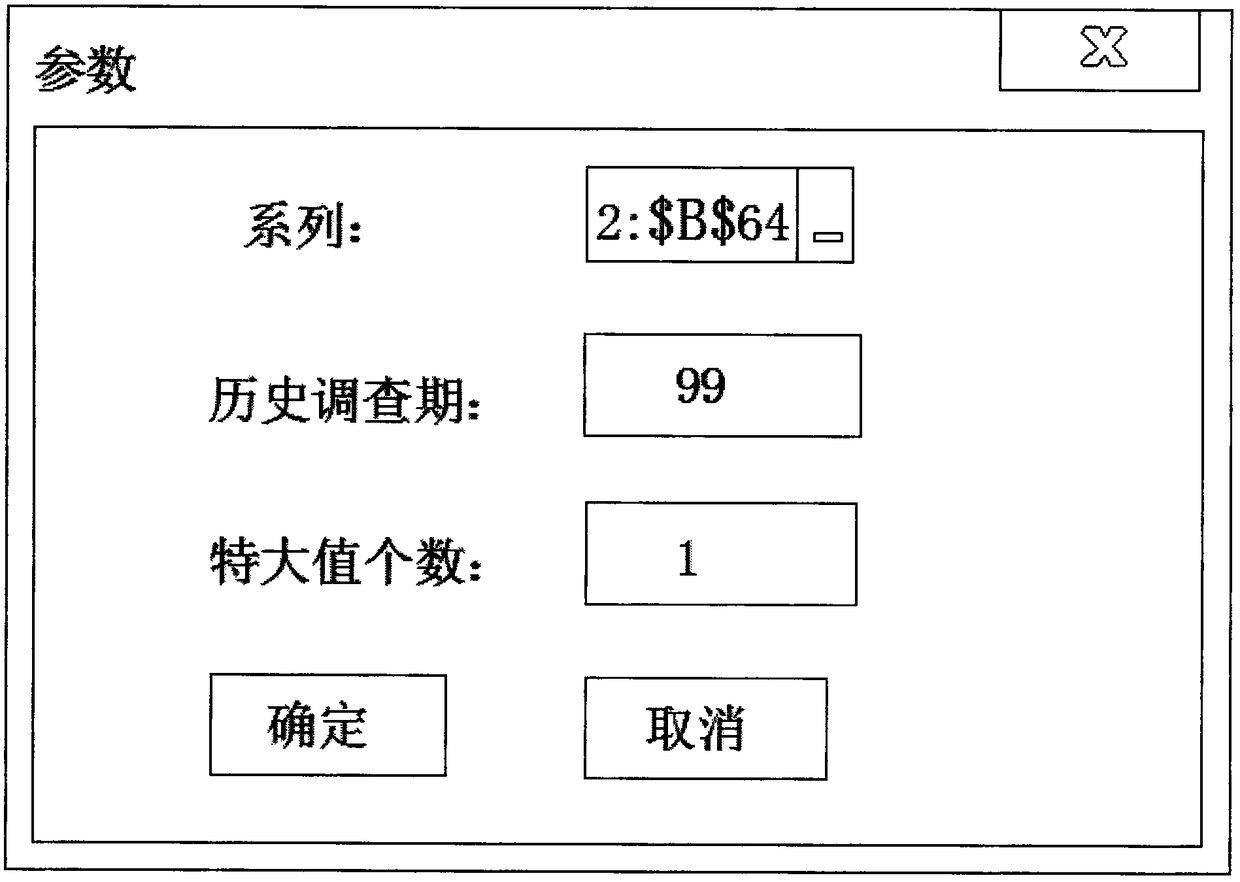

Image

  • Method for performing frequency analysis and synchronously drawing frequency curve in Excel
  • Method for performing frequency analysis and synchronously drawing frequency curve in Excel
  • Method for performing frequency analysis and synchronously drawing frequency curve in Excel

Examples


Embodiment

[0073] The method of using macro to draw frequency curve in Excel has a wide range of applications.

[0074] This method can be used when it is necessary to calculate the design standard and recurrence period of the project in the planning, design, operation and management of water conservancy and hydropower projects, civil engineering, and municipal engineering.

[0075] It is as small as analyzing the distribution of scores in various subjects of students in a school. For example, calculate the score distribution of all students in different grades of one subject (or one topic) in one test: high grade (P≤12.5%, that is, the top eighth), high grade (P=12.5%~37.5%, 1 / 4), average segment (P=37.5%-52.5%, the middle quarter), low segment (P=52.5%-87.5%, 1 / 4), low segment ( P≥87.5%, that is, the last eighth), etc., so as to judge the difficulty of the topic and the degree of mastery of the students.


PUM


Abstract

The invention discloses a method for performing frequency analysis and synchronously drawing a frequency curve in Excel and is applicable to the technical fields of mathematics and engineering design.The method comprises the specific steps that first, a formula is derived; second, a normal probability paper coordinate system is drawn in Excel; and third, a P-III frequency curve is drawn. Throughthe method for performing frequency analysis and synchronously drawing the frequency curve in Excel, working time is greatly shortened, a program directly runs in a series of files to be subjected tofrequency analysis, and it is not needed to copy the series into text files and then open the files one by one; and after a macro command is run, any series contained in a result graph can be displayed in the graph without the need for adding the series one by one, drawing of the P-III frequency curve is realized, and a generated frequency curve graph meets the requirement of a formal publicationformat.

Description

technical field [0001] The invention relates to the technical field of mathematics and engineering design, in particular to a method for performing frequency analysis and synchronously drawing frequency curves in Excel. Background technique [0002] The P-III curve was proposed by the British biologist Pearson. It is an asymmetric unimodal and positively skewed curve with a finite end and an infinite end. It is called the Gamma distribution in mathematics. The purpose of the frequency calculation is to determine the design value xp corresponding to a given design frequency p. [0003] The reciprocal of the design frequency is called the return period. The return period is a design standard widely used in the planning, design, operation and management of water conservancy and hydropower projects, civil engineering, etc. It is mainly determined according to the importance of the project and the damage results of hydrological events to the project. [0004] The shortcoming of...

Claims


Application Information

Patent Timeline
IPC IPC(8): G06F17/24G06T11/20
CPCG06T11/206G06F40/174
Inventor 蒋沛漪
Owner 蒋沛漪
Learn More