
Method and device for data complementation based on time tendency graph

A time trend and trend technology, applied in the field of data processing, can solve the problem that the trend graph cannot truly reflect the corresponding relationship of the indicator data, the trend graph cannot reflect the number of playback data, and the indicator data is incoherent.

Inactive Publication Date: 2018-05-22
BEIJING GRIDSUM TECH CO LTD
View PDF5 Cites 0 Cited by
  • Summary
  • Abstract
  • Description
  • Claims
  • Application Information

AI Technical Summary

Problems solved by technology

However, when the interface display terminal acquires indicator data from the data terminal, the required indicator data is a set of continuous indicator data corresponding to the time period. However, the data terminal generally only Save the indicator data, and mark the corresponding time data on the indicator data, instead of continuously recording the indicator data according to the unit time interval. Playing time, the number of playing times in a certain hour is counted and recorded, and if there is no playing in a certain hour, it will not be recorded
This leads to the incoherence of the indicator data obtained by the interface display terminal, and when generating the trend graph, these time points without indicator data will be ignored, or the indicator data corresponding to the time point will be corresponding to its previous and subsequent time points The indicator data is calculated and derived, so that the trend chart cannot truly reflect the corresponding relationship between the indicator data and time
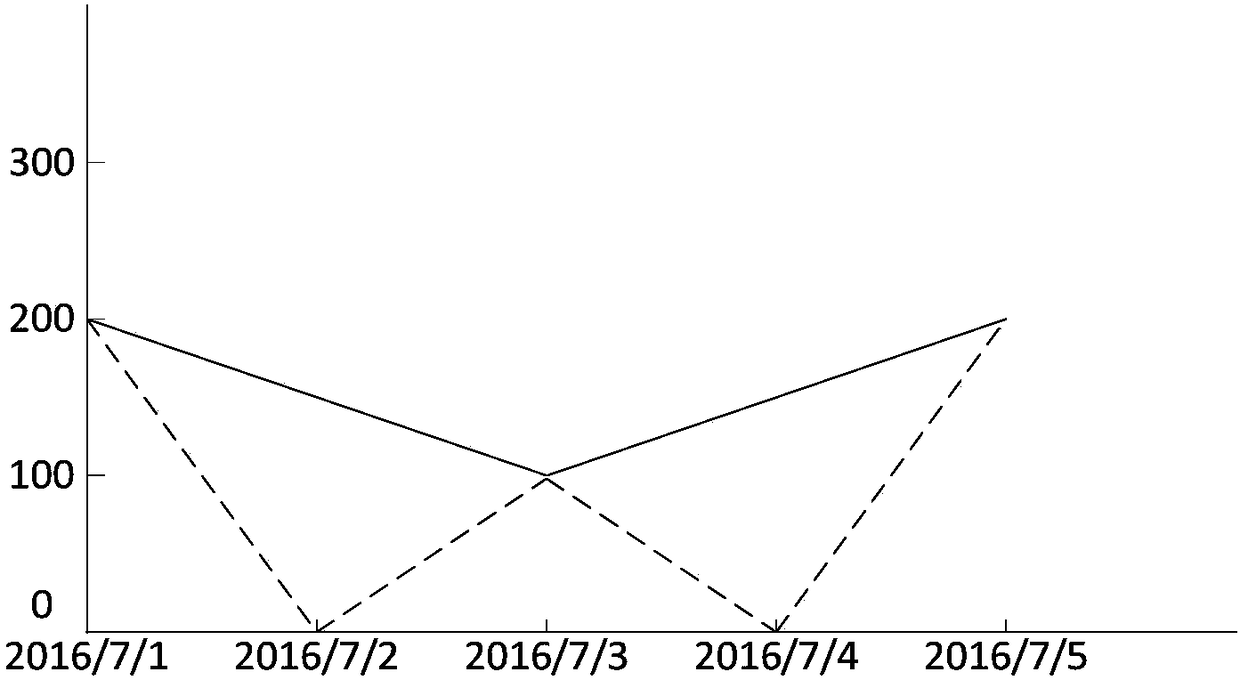
like figure 1 As shown in the figure, it is assumed that the statistics in the figure are a trend graph of the number of times a video was played from July 1, 2016 to July 5, 2016. / 7 / 3 is 100 times, 2016 / 7 / 5 is 200 times, 2016 / 7 / 2 and 2016 / 7 / 4 are not played, and when the interface display terminal generates the trend graph, due to 2016 / 7 / 2 and 2016 / 7 / 4 has no data. Based on the previous and subsequent data, a trend graph with a solid line in the figure will be generated, but the actual trend graph should be a trend graph represented by a dotted line in the figure. It can be seen that the realized trend graph cannot reflect the real one at all. Play count data

Method used


Image

  • Method and device for data complementation based on time tendency graph
  • Method and device for data complementation based on time tendency graph
  • Method and device for data complementation based on time tendency graph

Examples


Embodiment Construction

[0054] Exemplary embodiments of the present invention will be described in more detail below with reference to the accompanying drawings. Although exemplary embodiments of the present invention are shown in the drawings, it should be understood that the invention may be embodied in various forms and should not be limited to the embodiments set forth herein. Rather, these embodiments are provided for more thorough understanding of the present invention and to fully convey the scope of the present invention to those skilled in the art.

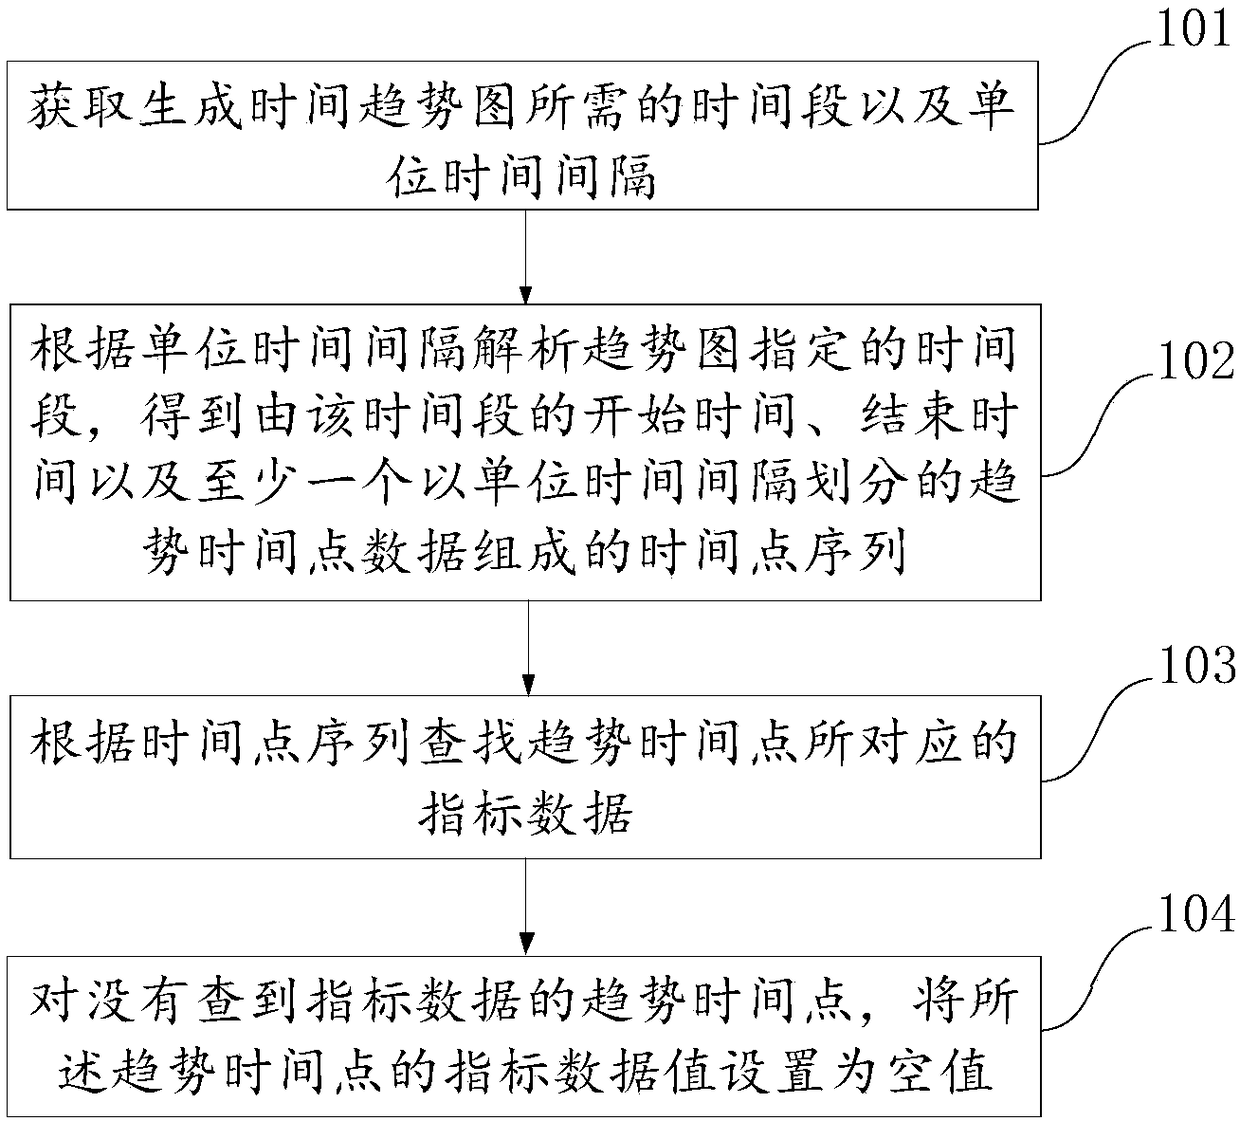
[0055] An embodiment of the present invention provides a data completion method based on a time trend graph, such as figure 2 As shown, the method is mainly used to detect the index data required for generating the trend graph, and complete the missing index data. For this, the embodiment of the present invention provides the following specific steps:

[0056] 101. Obtain the time period and unit time interval required to generate the time tre...


PUM


Abstract

The invention discloses a method and a device for data complementation based on time tendency graphs, and relates to the technical field of data process. Main objectives of the invention are to improve accuracy of tendency graph reflected index data with time changing trends through complementing index data corresponding to time. The main technical scheme comprises: obtaining time periods and unitinterval required by generating a time tendency graph, the unit interval being positive integer times of minimum time interval for labeling index data; according to the unit interval, analyzing the time periods, to obtain a point-in-time sequence formed by start time and end time of the time periods, and at least a trend point-in-time data divided by the unit interval; according to the point-in-time sequence, searching the index data corresponding to trend point-in-time; for the trend point-in-time which has not searched the index data, setting an index data value of the trend point-in-time as a null value. The method and the device are mainly used to complement index data missing in a tendency graph.

Description

technical field [0001] The invention relates to the technical field of data processing, in particular to a data completion method and device based on a time trend graph. Background technique [0002] A trend chart, also known as a trend chart, is used to display indicator data obtained within a certain time interval (such as a day, a week, or a month). It is a graph drawn with the value of the indicator data on the vertical axis and time on the horizontal axis. Trend chart is a very intuitive data visualization chart, which is widely used in data display in the interface. [0003] At present, when the interface display terminal displays the trend graph, the displayed time interval is generally set by the user through the interface display terminal, and the interface display terminal obtains the index data corresponding to the time period from the data terminal according to the set time period , resulting in a trend graph. However, when the interface display terminal acqui...

Claims


Application Information

Patent Timeline
IPC IPC(8): G06F17/30
CPCG06F16/2474G06F16/248
Inventor 魏智华
Owner BEIJING GRIDSUM TECH CO LTD
Learn More