Time frequency decomposition and reconstruction method of generalized S transform signals for synchronous extrusion
A technology of synchronous extrusion and time-frequency decomposition, applied in the field of signal processing, can solve problems such as the inability to automatically adjust the resolution, suboptimal spectrum resolution, and poor non-stationary signal processing effect
- Summary
- Abstract
- Description
- Claims
- Application Information
AI Technical Summary
Problems solved by technology
Method used
Image
Examples
Embodiment 1
[0083] Embodiment 1: see figure 1 , a method for time-frequency decomposition and reconstruction of a synchronously squeezed generalized S-transform signal, comprising the following steps:
[0084] (1) Acquire signal x(t);
[0085] (2) Carry out four-parameter generalized S-transformation on the signal x(t) using the following formula,
[0086]
[0087] Wherein, the four parameters are: basic wavelet amplitude A, energy decay rate α (α>0), energy delay time β, basic wavelet video frequency f 0 ; f is the frequency of the four-parameter generalized S-transform, and b is the time-axis displacement parameter of the four-parameter generalized S-transform;
[0088] (3) For the four-parameter generalized S-transform result GST x (f, b) modulo, to obtain the energy of each time-frequency point, so as to obtain the generalized S-transform time spectrum,
[0089] S GST =|GST x (f,b)|;
[0090] (4) Based on the four-parameter generalized S-transform result GST obtained in step...
Embodiment 2
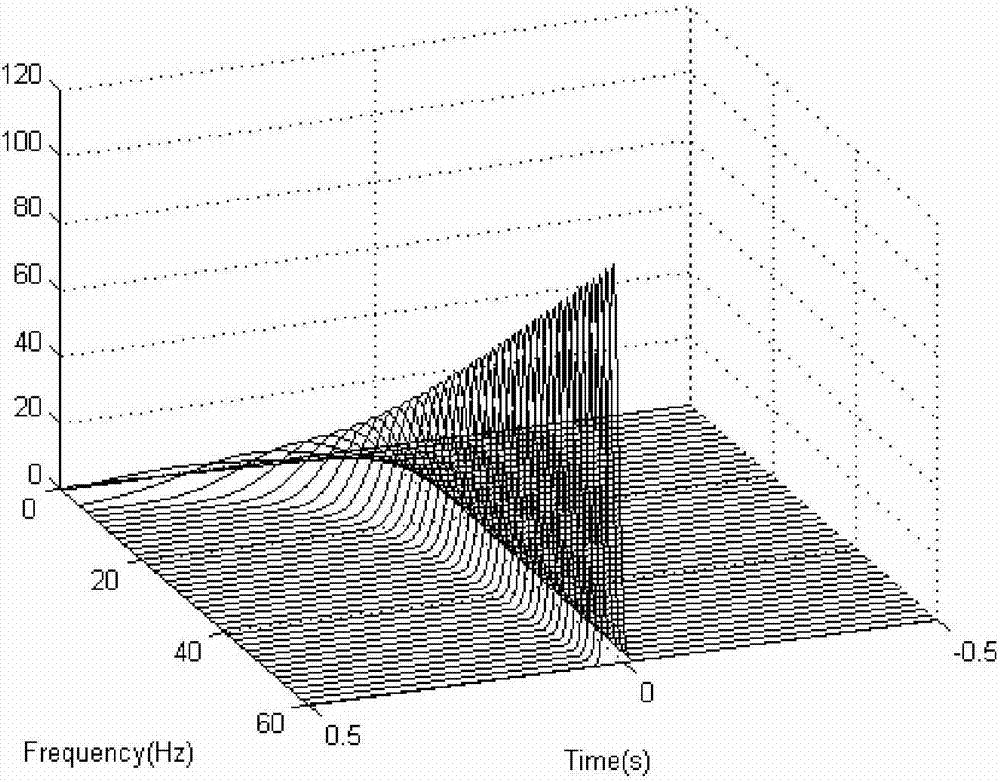
[0098] Example 2: see figure 2 — Figure 8 , the synchronous extrusion generalized S-transform can adjust the change trend of the basic wavelet function by adjusting the four parameters in the generalized S-transform according to the actual needs, so as to adapt to the analysis and processing of specific signals. The four parameters are basic wavelet amplitude, energy decay rate, energy delay time and basic wavelet video frequency. Figure 2-Figure 8 , shows the generalized S-transform window function of parameters A, α, β under different value conditions, and illustrates the specific role of each parameter.
[0099] figure 2 The selected parameters are A=2, α=0.5, β=1, image 3 The selected parameters are A=2, α=2, β=1. Comparing the two, we can see that the value of α determines the window size of the window function, and the size of the window is inversely proportional to the value of α. The smaller the value of α, the larger the window, and the value of α The larger ...
Embodiment 3
[0101] Embodiment 3: see Figure 9 — Figure 20 .
[0102] The FM signal is a recognized model for testing the time-frequency aggregation performance of the time-frequency distribution. Figure 12 The composite signal shown is composed of Figure 9 , Figure 10 The 2 FM signals shown and Figure 11 The signal-to-noise ratio shown is the superposition of 6dB Gaussian white noise, so we will Figure 12 The composite signal shown in is used as the signal x(t) in step (1), and the specific implementation method is as follows:
[0103] (1) Obtain signal x(t), said x(t) is a composite signal, by Figure 9 , Figure 10 The 2 FM signals shown and Figure 11 The signal-to-noise ratio shown is the superposition of 6dB Gaussian white noise;
[0104] (2) Carry out four-parameter generalized S-transformation on the signal x(t) using the following formula,
[0105]
[0106] Wherein, the four parameters are: basic wavelet amplitude A, energy decay rate α (α>0), energy delay time...
PUM
 Abstract
Description
Claims
Application Information
 - R&D
- Intellectual Property
- Life Sciences
- Materials
- Tech Scout
- Unparalleled Data Quality
- Higher Quality Content
- 60% Fewer Hallucinations
Browse by: Latest US Patents, China's latest patents, Technical Efficacy Thesaurus, Application Domain, Technology Topic, Popular Technical Reports.
© 2025 PatSnap. All rights reserved.Legal|Privacy policy|Modern Slavery Act Transparency Statement|Sitemap|About US| Contact US: help@patsnap.com


