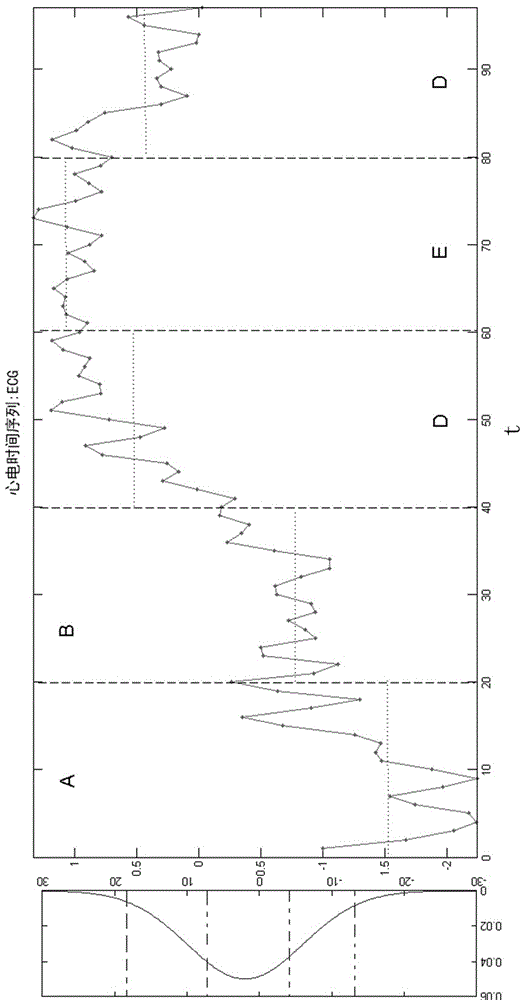
Visualization representing method for time series data

A time series and data technology, applied in other database browsing/visualization, electronic digital data processing, other database retrieval and other directions, can solve the problems of original time series accuracy deviation, decline in data classification ability, loss of classification information, etc., to achieve visualization effect Good, concise and intuitive visualization effect, the effect of improving the efficiency of visualization work

Inactive Publication Date: 2016-12-07
ZHENGZHOU UNIV +1
View PDF1 Cites 14 Cited by
  • Summary
  • Abstract
  • Description
  • Claims
  • Application Information

AI Technical Summary

Problems solved by technology

However, many feature compression algorithms will lead to the loss of classification information, resulting in the decline of data classification ability after dimensionality reduction
The quantile method is used to discretize the time series, and then to perform visual representation. The idea is simple and intuitive, but the problem is that the information loss is large on the one hand, and the KL distance is relatively large on the other hand, that is, in reflecting the original time series. Accuracy is biased

Method used


Image

  • Visualization representing method for time series data
  • Visualization representing method for time series data
  • Visualization representing method for time series data

Examples


Embodiment Construction

[0023] The present invention will be described in further detail below in conjunction with the accompanying drawings and specific embodiments.

[0024] In the representation method of time series data, symbolic representation is an effective method for dimensionality reduction of discretized time series. Because character data can well describe some problems that are difficult to express using specific quantitative data, and because character strings have specific data structures and many relatively mature algorithms, researchers have begun to study the symbolic representation of time series in recent years. Do your research and follow. Among them, the SAX (Symbolic Aggregate approximation) method proposed by Lin et al. is considered to be the most typical symbolic representation method. This method is based on the PAA (Piecewise Aggregate Approximation, piecewise aggregation approximation) method. The time series is segmented and averaged, and then these averages are convert...


PUM


Abstract

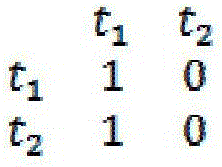
The invention discloses a visualization representing method for time series data. On the basis that time series feature representations of an SAX-based method are adopted as the visualization basis of time series data, the signifying character representations are converted into a Markov transfer matrix, then, a complex network is used for building time series graphic representations, and time series data visualization representations are obtained. The SAX-based discretization method is adopted for time series Markov matrix conversion for the first time, a corresponding Markov transfer matrix obtained after time series discretization is adopted, and time series statistical characteristics can be better extracted; compared with quantile discretization, SAX discretization can better extract time series statistical characteristics, under certain conditions, the complex network visualization result is frequently better than the quantile discretization result on a benchmark data set, the approximation accuracy is closer to that of original data distribution, and the visualization effect is better.

Description

technical field [0001] The invention relates to a visual representation method of time series data. Background technique [0002] Time series data widely exists in the fields of scientific research, production process, and financial services. Especially in recent years, with the application and development of information technology, time series data has also shown an explosive growth trend. Massive data processing and application work increasing day by day. Time series data usually has high-dimensional characteristics, and due to the influence of environmental factors in the production process, it is easy to have certain noise. Therefore, research on such complex data to effectively mine and acquire information and knowledge has important value and significance for both scientific theoretical research and social production practice. [0003] In a large number of problems related to time series data, people try to study the process of physical phenomena changing dynamically...

Claims


Application Information

Patent Timeline
Patent Type & Authority Applications(China)
IPC IPC(8): G06F17/30
CPCG06F16/904
Inventor 宋伟张帆叶阳东宋玉张青张世勋沈军范明
Owner ZHENGZHOU UNIV
Why Eureka
Try Eureka