Calculation Method of Traffic Congestion Index in Viaduct Section Based on Microwave Vehicle Detector

A technology of traffic congestion index and vehicle detector, which is applied in the traffic control system of road vehicles, traffic flow detection, traffic control system, etc., and can solve the problem of difficult to distinguish the main road of the viaduct and the downlink auxiliary road, the accuracy of data collection is not accurate, Complicated calculation process and other problems, to achieve the effect of guaranteed collection accuracy, high accuracy, and simple calculation process

Active Publication Date: 2018-01-19
ANHUI SUN CREATE ELECTRONICS
View PDF6 Cites 0 Cited by
  • Summary
  • Abstract
  • Description
  • Claims
  • Application Information

AI Technical Summary

Problems solved by technology

The above-mentioned traditional calculation method is not only complicated in the calculation process, but also highly subjective in judgment; at the same time, when the above-mentioned floating vehicle technology is used to collect and detect viaduct traffic information, it is also difficult to distinguish the viaduct main road from the downlink auxiliary road due to GPS positioning deviation. Road, resulting in extremely inaccurate data collection accuracy

Method used


Image

  • Calculation Method of Traffic Congestion Index in Viaduct Section Based on Microwave Vehicle Detector
  • Calculation Method of Traffic Congestion Index in Viaduct Section Based on Microwave Vehicle Detector
  • Calculation Method of Traffic Congestion Index in Viaduct Section Based on Microwave Vehicle Detector

Examples


Embodiment 1

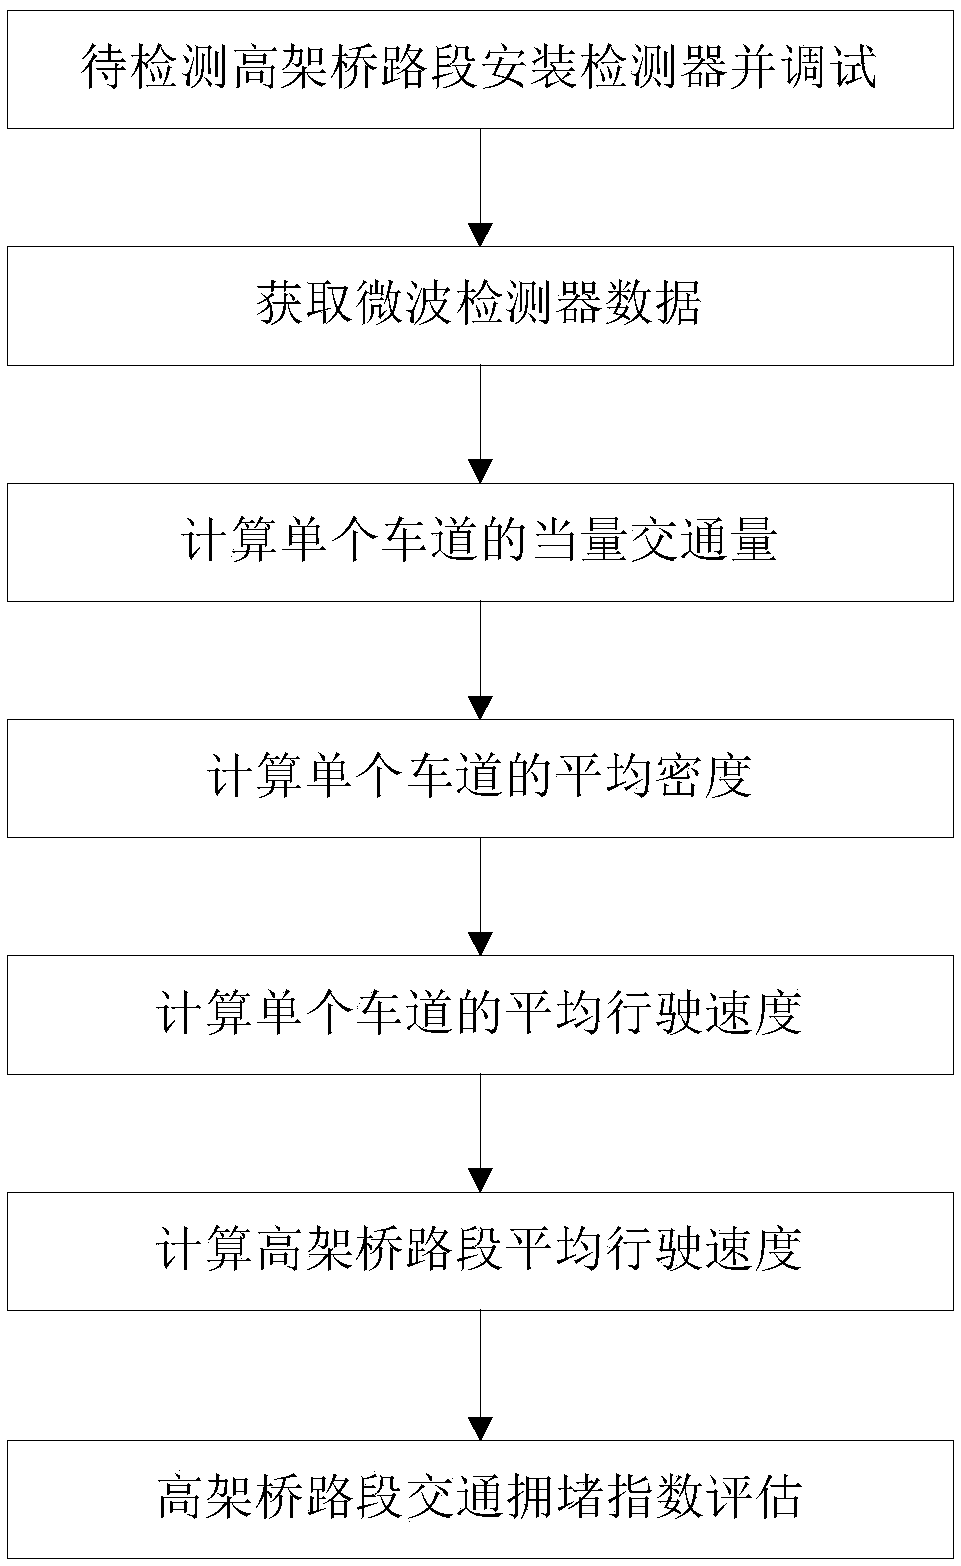
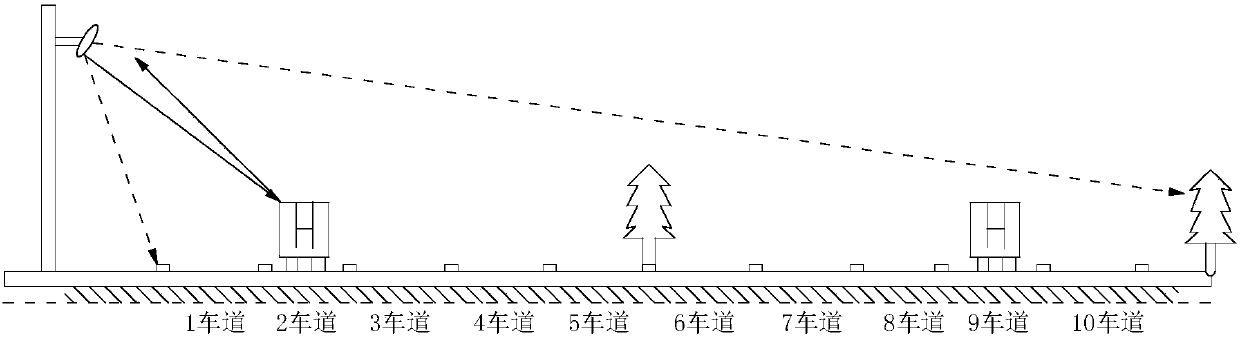
[0075] 1) Install and debug microwave vehicle detectors on the selected section of the north-south elevated highway in Hefei;

[0076] 2) Obtain the data measured by the microwave vehicle detector for a certain period of time

[0077] Lane 1: the number of vehicles of model 1 is 98; the number of vehicles of model 2 is 2; the number of vehicles of model 3 is 0; the number of vehicles of model 4 is 0; the time occupancy rate is 31%.

[0078] Lane 2: the number of vehicles of model 1 is 63; the number of vehicles of model 2 is 0; the number of vehicles of model 3 is 0; the number of vehicles of model 4 is 0; the time occupancy rate is 19%.

[0079] Lane 3: the number of vehicles of model 1 is 76; the number of vehicles of model 2 is 0; the number of vehicles of model 3 is 0; the number of vehicles of model 4 is 0; the time occupancy rate is 23%.

[0080] 3) Calculate the equivalent traffic volume of a single lane:

[0081] Lane 1: Equivalent traffic volume Q L1 =∑Q i E. i =...

Embodiment 2

[0098] 1) Install and debug microwave vehicle detectors on the selected section of the north-south elevated highway in Hefei;

[0099] 2) Obtain the data measured by the microwave vehicle detector for a certain period of time:

[0100] Lane 1: the number of vehicles of model 1 is 150; the number of vehicles of model 2 is 4; the number of vehicles of model 3 is 0; the number of vehicles of model 4 is 0; the time occupancy rate is 71%.

[0101] Lane 2: the number of vehicles of model 1 is 122; the number of vehicles of model 2 is 1; the number of vehicles of model 3 is 0; the number of vehicles of model 4 is 0; the time occupancy rate is 58%.

[0102] Lane 3: the number of vehicles of model 1 is 90; the number of vehicles of model 2 is 0; the number of vehicles of model 3 is 0; the number of vehicles of model 4 is 0; the time occupancy rate is 33%.

[0103] 3) Calculate the equivalent traffic volume of a single lane:

[0104] Lane 1: Equivalent traffic volume Q L1 =∑Q i E. ...


PUM


Abstract

The invention belongs to the technical field of urban viaduct information collection and processing, and in particular relates to a method for calculating traffic congestion index of a viaduct section based on a microwave vehicle detector. Each step of the present invention is as follows: 1), microwave vehicle detector is installed and debugged on the viaduct section to be detected; 2), obtains the data measured by microwave vehicle detector; 3), calculates the equivalent traffic volume QLj of single lane; 4) , calculate the average density KLj of a single lane; 5), calculate the average driving speed VLj of a single lane; 6), calculate the average driving speed of the viaduct section 7), calculate the traffic congestion index TCI of the viaduct section. The invention has the advantages of convenient maintenance, no damage to the road surface and no influence on traffic, and can simultaneously realize the online high-precision measurement function, and finally enables real-time and accurate evaluation of the traffic congestion state of the urban viaduct road section.

Description

technical field [0001] The invention belongs to the technical field of urban viaduct information collection and processing, and in particular relates to a method for calculating traffic congestion index of a viaduct section based on a microwave vehicle detector. Background technique [0002] The traffic congestion index refers to the relative number after quantifying the congestion intensity of a single road section, a road of a certain level, or the overall road network at a specific moment in a specific area. This index value can reflect the traffic operation status and congestion intensity from a single road section to the overall road network , and reflect its running quality. The size of the index value represents different traffic operation status and congestion intensity. The larger the value, the worse the road operation status and the greater the congestion intensity during the evaluation period; conversely, the better the road operation status, the lighter the cong...

Claims


Application Information

Patent Timeline
Patent Type & Authority Patents(China)
IPC IPC(8): G08G1/01G08G1/065
Inventor 邹娇孙晓静董婉丽林家骐杨灿彭柱徐戚胡涛李鹏
Owner ANHUI SUN CREATE ELECTRONICS
Why Eureka
Try Eureka