Dispersion phase compensation method based on peak evolution distortion elimination in high-resolution frequency scanning interferometer
A technology of frequency scanning interference and phase compensation, applied in the field of dispersion compensation of scanning interferometers, can solve the problems of low measurement resolution and large ranging error
- Summary
- Abstract
- Description
- Claims
- Application Information
AI Technical Summary
Problems solved by technology
Method used
Image
Examples
specific Embodiment approach 1
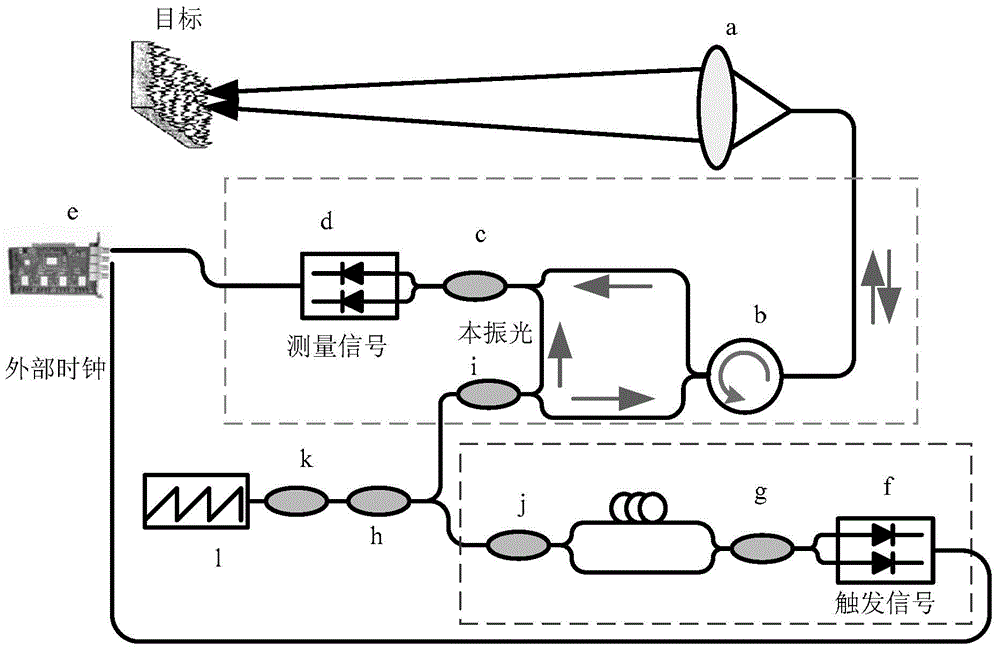
[0086] Specific implementation manner 1: A dispersion phase compensation method based on peak evolution and distortion reduction in a high-resolution frequency scanning interferometer includes the following steps:
[0087] The signal after the nonlinearity is corrected by the frequency sampling method of the optical fiber Machzide interferometer can be expressed as formula (14)
[0088]
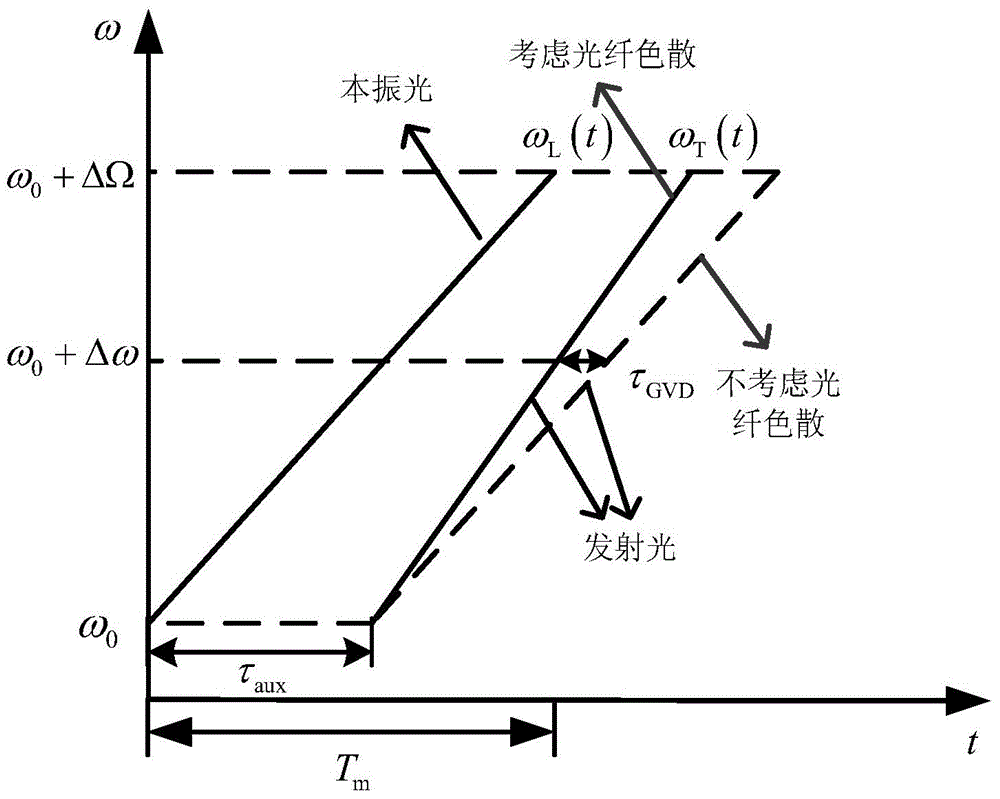
[0089] Where I b To measure the signal, A T Is the signal energy reflected by the target, A R Is the energy of the local oscillator optical signal; η H Is the interference efficiency, n is the sampling point number; Is the distortion phase of the sampled signal, which is mainly caused by the fiber dispersion of the auxiliary interferometer; σ disp Is the phase distortion coefficient; τ and τ aux Respectively indicate the corresponding time delay of the measuring interferometer and auxiliary interferometer in the high-resolution frequency scanning interferometer;
[0090] Expressing formula (14) as a...
specific Embodiment approach 2
[0099] Specific implementation manner 2: The selected phase compensation coefficient α comp , Make -πσ disp n 2 +πα comp n 2 Minimum, get the measured signal I after dispersion phase compensation b , To complete the compensation for the influence of the frequency scanning interferometer's dispersion; including the following steps:
[0100] Analyze the characteristics of the signal function after sampling, and express the frequency spectrum amplitude square of the sampled signal as formula (17):
[0101] | S I b ( f ) | 2 = 1 8 σ d i s p [ F r e s n e l c ( ξ 1 ) - F r e s n e l c ( ξ 1 + 2 σ d i s p T 2 ) ] 2 + 1 8 σ d i s p [ F r e s n e l s ( ξ 1 ) - F r e s n e l s ( ξ 1 + 2 σ d i s p T 2 ) ] 2 - ...
Embodiment
[0110] The simulation process is as follows: Assume that the beat frequencies of the measurement signal formed by four point targets are 5500Hz, 5800Hz, 5900Hz, 6000Hz, in order to explain the principle and increase the contrast effect, the corresponding maximum distortion coefficients are set to 4.88×10 4 , 5×10 4 , 5.04×10 4 , 5.08×10 4 , The time-domain diagram and frequency-domain diagram of the measured signal are shown in Figure 6(a) and Figure 6(b) respectively. From Figure 6(b), it can be seen that the signal has severe spectral interference and false peaks are generated. Point targets cannot be distinguished and measured. In order to eliminate this effect, the sampled signal and Multiply and set the compensation coefficient α respectively comp = 48800, α comp = 50000, α comp =50400,α comp =50800, and then Fourier transform is performed on the compensated signal, and the frequency spectrum is shown in Figure 7.
[0111] Compared Figure 7(a)-Figure 7(d) As shown in Fi...
PUM
 Abstract
Description
Claims
Application Information
 - R&D
- Intellectual Property
- Life Sciences
- Materials
- Tech Scout
- Unparalleled Data Quality
- Higher Quality Content
- 60% Fewer Hallucinations
Browse by: Latest US Patents, China's latest patents, Technical Efficacy Thesaurus, Application Domain, Technology Topic, Popular Technical Reports.
© 2025 PatSnap. All rights reserved.Legal|Privacy policy|Modern Slavery Act Transparency Statement|Sitemap|About US| Contact US: help@patsnap.com


