
Calculating method of visual salience drawing

A calculation method, a remarkable technology, applied in calculation, image analysis, image data processing, etc., can solve problems such as easily lost contour information, and achieve the effects of clear visual saliency, improved calculation efficiency, and accurate positioning

Active Publication Date: 2015-06-10
SUZHOU UNIV
View PDF2 Cites 14 Cited by
  • Summary
  • Abstract
  • Description
  • Claims
  • Application Information

AI Technical Summary

Problems solved by technology

On the other hand, because the Itti model uses cross-scale combination to generate feature saliency maps, it is easy to lose contour information including edges and corners in the saliency map, but the target contour in the image is usually a high-contrast area, which also contains important salient information

Method used


Image

  • Calculating method of visual salience drawing
  • Calculating method of visual salience drawing
  • Calculating method of visual salience drawing

Examples


Embodiment 1

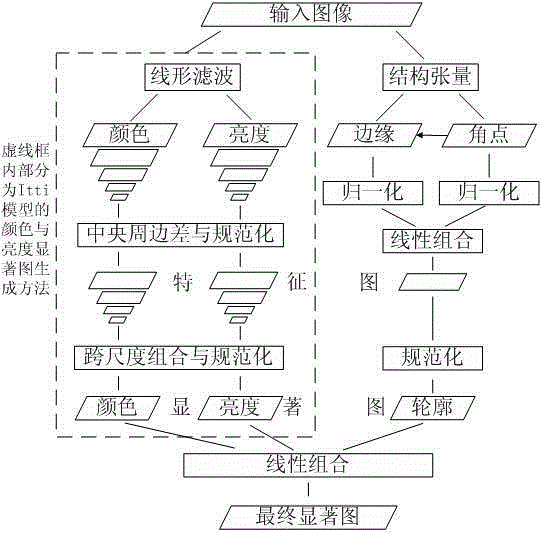
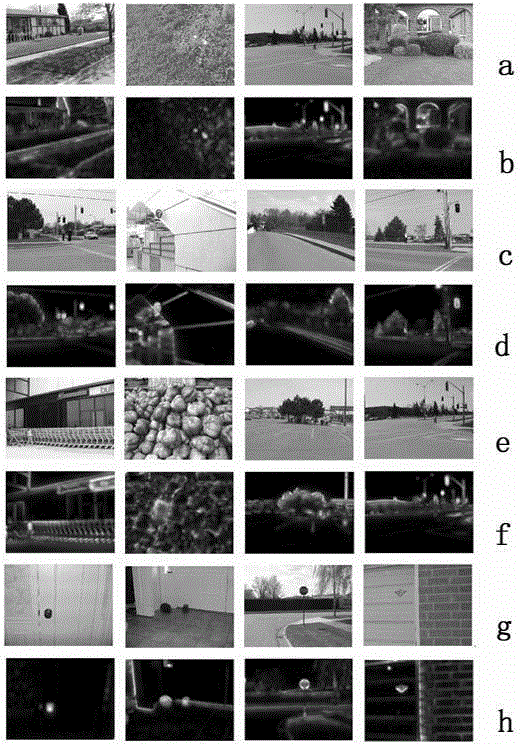
[0034] Embodiment one: see figure 1 As shown, a calculation method of a visual saliency map has the following steps:

[0035] Step 1: For the input image Using the calculation method of the color channel and brightness channel in the Itti model, the color saliency map and brightness saliency map of the image are obtained;

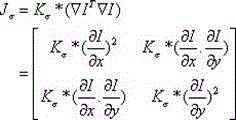
[0036] Step 2: For a given image Scale, transform its size to the size of the desired saliency map, and calculate the linear structure tensor matrix for each position in the scaled image , its concrete form is:

[0037]

[0038] in, is the standard deviation of The Gaussian kernel function of For convolution operations, for color images, the linear structure tensor matrix is ​​defined as:

[0039]

[0040] in, Represent the image of the three color channels respectively, and any linear structure tensor matrix Expressed as form, find its eigenvalues ,

[0041]

[0042] By pairing the eigenvalues The linear combination and nor...


PUM


Abstract

The invention discloses a calculating method of a visual salience drawing. The method comprises the steps of adopting an Itti model to generate a color salience drawing and a brightness salience drawing of a drawing; effectively extracting an edge salience drawing and an angular point salience drawing by using structure tensors; generating an outline salience drawing through linear combination; and finally carrying out a normalized and linear combination through characteristic salience drawing to obtain a final salience drawing. According to the calculating method provided by the invention, the visual salience drawing obtained is clearer, a significant target is more accurate to locate, and the efficiency calculating aspect can be improved.

Description

technical field [0001] The invention relates to a computer vision algorithm, in particular to a calculation method of a visual saliency map. Background technique [0002] Visual saliency is the basis of human visual attention mechanism. Humans always focus on salient object areas when observing images. Therefore, the research on salient object detection and visual attention mechanism is often closely related. Visual saliency analysis has broad application prospects in the fields of mobile robots, surveillance, fast object recognition, defect detection, image stitching, video compression, etc., and the visual saliency map is the result of visual saliency analysis. Existing computational models of visual saliency maps can be roughly divided into two categories: bottom-up models and top-down models. This is mainly due to the fact that cognitive psychologists and neurobiologists have always divided the human visual attention mechanism into two stages: (1) bottom-up, data-driven...

Claims


Application Information

Patent Timeline
IPC IPC(8): G06T7/00G06T3/40
Inventor 何志勇王晨孙立宁左保齐翁桂荣胡佳娟
Owner SUZHOU UNIV
Learn More