Marker site Satt557 related to soybean hundred-grain weight hereditary characteristic and application thereof
A technology for marking loci and genetic characteristics, applied in the field of soybean genetics, can solve the problems of limited means and methods of selection, and achieve the effect of shortening the breeding cycle and improving the efficiency of breeding
- Summary
- Abstract
- Description
- Claims
- Application Information
AI Technical Summary
Problems solved by technology
Method used
Image
Examples
Embodiment 1
[0033] 1. Selection of germplasm resources
[0034] Selected 251 soybean germplasm resources, based on the QTL mapping of 100-seed weight of soybean and meta-analysis results of QTL of 100-seed weight, identified 30 SSR marker loci related to 100-seed weight, and verified the 30 marker loci in the resources. Banding characteristics of PCR products to detect the correlation between different banding patterns and 100-seed weight. Further verify the relationship between the marker band type and 100-seed weight through genetic population. Statistics and experiments prove that when the PCR product of Satt557 is 520bp, the soybean germplasm contains a genetic background that reduces 100-seed weight. The selected 251 soybean germplasm resources are shown in the following table:
[0035] Table 1 Names of 251 soybean germplasm resources
[0036]
[0037]
[0038]
[0039] 2. Main experimental methods
[0040] 1 Reagents used in the experiment
[0041] 1) Reagents for extracting soybean genom...
Embodiment 2
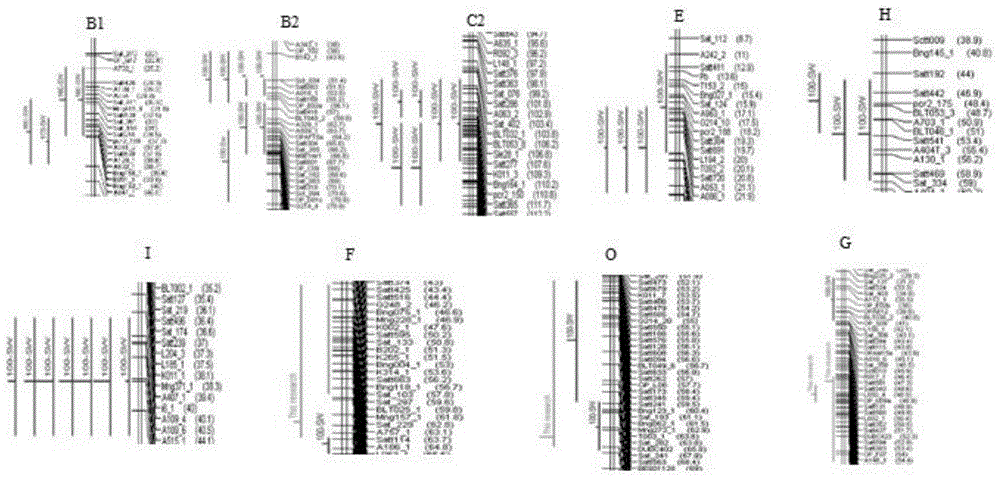
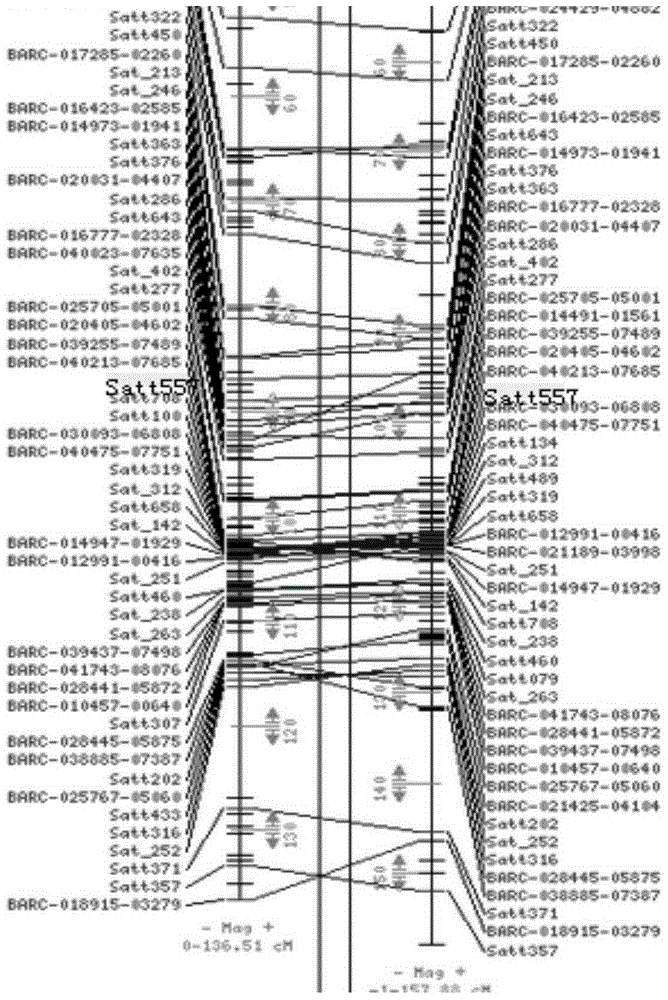
[0069] Use tools-Meta-analysis in BioMercator2.1 software to analyze the QTL clusters of each linkage group. Among the five analysis models, the model with the smallest AIC value is selected to determine a "general QTL". After Meta analysis, 15 “universal QTLs” with 100-seed weight and their interval markers were obtained, mainly located on LG B1, B2, C1, C2, D2, E, H, I, K, M and O. The genetic contribution rate is in Between 4.76%-20.82%, the maximum confidence interval is 13.62cM, and the minimum confidence interval is 1.52cM. Refer to Table 2. figure 1 . The marker Satt557 is located on linkage group C2 ( figure 2 ).
[0070] Table 2 Meta-analysis results of 100-seed weight QTLs of soybean
[0071]
[0072]
Embodiment 3
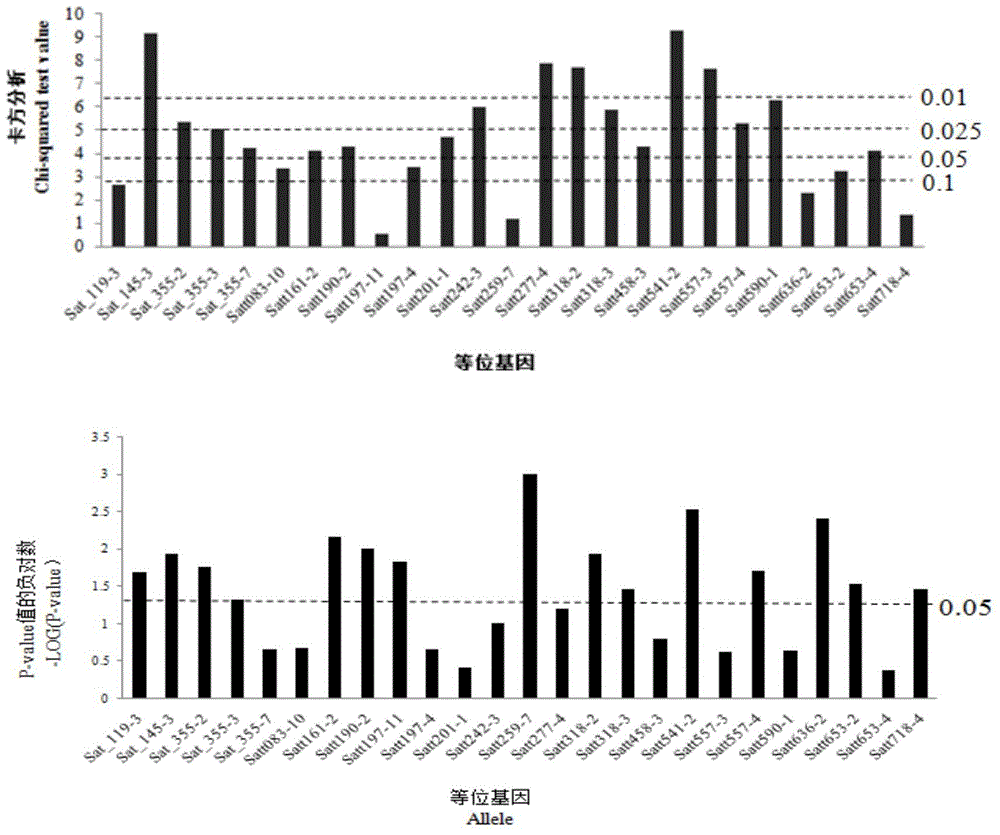
[0074] Chi-square analysis was used to analyze the significance of the phenotypic data. With alpha=0.01, 0.025, 0.05 and 0.1 as the stratification threshold, the markers obtained from the Meta analysis were divided into five levels. When the test P value was less than 0.01, the The site is a major site, and when the P value is greater than 0.1, it is considered a minor site, see image 3 . Obtained 5 key alleles at the 0.01 level: Satt541-2, Sat_145-3, Satt277-4, Satt318-2 and Satt557-3. 6 key alleles at the 0.025 level: Satt590-1, Satt242- 3. Satt318-3, Sat_355-2, Satt557-4, Sat_355-3. 6 key allele loci at the 0.05 level: Satt201-1, Satt190-2, Satt458-3, Sat_355-7, Satt161-2, Satt653 -4. 0.1 level alleles 3: Satt197-4, Satt083-10, Satt653-2. The rest are minor genes with small genetic effects below the 0.1 level, image 3 The significance of alleles for markers not listed in is 0. The T-test has 15 alleles with a P-value less than 0.05.
PUM
 Abstract
Description
Claims
Application Information
 - Generate Ideas
- Intellectual Property
- Life Sciences
- Materials
- Tech Scout
- Unparalleled Data Quality
- Higher Quality Content
- 60% Fewer Hallucinations
Browse by: Latest US Patents, China's latest patents, Technical Efficacy Thesaurus, Application Domain, Technology Topic, Popular Technical Reports.
© 2025 PatSnap. All rights reserved.Legal|Privacy policy|Modern Slavery Act Transparency Statement|Sitemap|About US| Contact US: help@patsnap.com


