A visualization method for massive location check-in data

A data-mass technology, applied in digital data processing, structured data retrieval, geographic information database, etc., can solve problems such as sign-in data visualization, and achieve the effect of reducing data volume, beautiful visualization effect, and simple method

Inactive Publication Date: 2017-12-22
HOHAI UNIV
View PDF4 Cites 0 Cited by
  • Summary
  • Abstract
  • Description
  • Claims
  • Application Information

AI Technical Summary

Problems solved by technology

However, there is no method in the existing technology to efficiently visualize massive check-in data

Method used


Image

  • A visualization method for massive location check-in data
  • A visualization method for massive location check-in data
  • A visualization method for massive location check-in data

Examples


Embodiment Construction

[0039] The implementation of the present invention will be further described below in conjunction with the accompanying drawings and examples, but the implementation and inclusion of the present invention are not limited thereto.

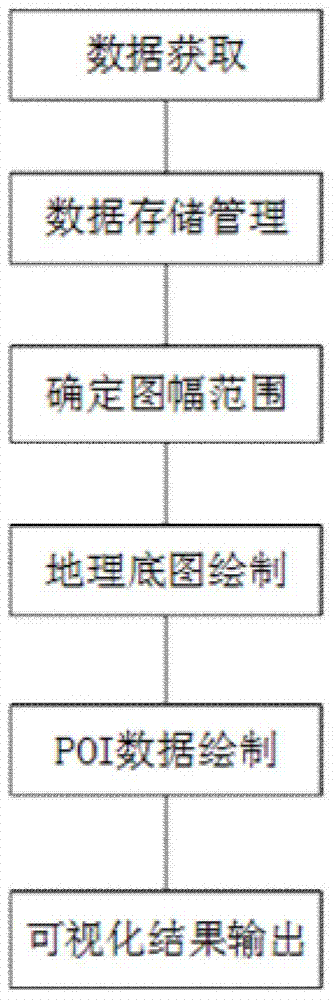
[0040] Such as figure 1 As shown, the visualization method of massive location data provided by the present invention includes the following steps: wherein, the present invention uses Sina Weibo point of interest (hereinafter referred to as POI) check-in data as experimental data.

[0041] Step 1: data acquisition; this step includes the following steps:

[0042] Step 101: Grab the POI check-in data of Sina Weibo. During specific implementation, write a crawler program according to Sina Weibo, wherein the API is an application programming interface to grab all POI data nationwide;

[0043] Step 102: Store the data in the MongoDB database. Choose any database with spatial data engine function to store captured POI data.

[0044] Step 2: Data manag...


PUM


Abstract

The invention discloses a mass position check-in data visualization method which comprises the steps that 1, position check-in data are captured from a data collection terminal, and the collected data are stored into a database; 2, the position check-in data collected in the step 1 are managed; 3, the map extent is determined according to the geographical range needing to be collected; 4, the NodeCanvas technology is adopted for drawing a geographical map; 5, the collected position check-in data are drawn on the geographical map obtained in the step 4; 6, a result picture is output. According to the mass position check-in data visualization method, visualization can be carried out according to different measuring scales, the visualization effect is attractive, and the data distribution rule is visually reflected; meanwhile, the mass position check-in data visualization method can operate data more flexibly, effectively achieves big data visualization data reading, can achieve mass data visualization more easily, and is high in drawing efficiency, easy to implement, good in effect and capable of drawing complex graphs.

Description

technical field [0001] The invention relates to the field of geographic information visualization processing, in particular to a visualization method for massive location check-in data. technical background [0002] Data visualization originated in computer graphics in 1960. Computers are used to create graphics and charts, and various attributes and variables of data are presented through visualization. With the development of computer hardware such as data acquisition equipment and data storage equipment, and the need to create more complex and larger digital models, data acquisition equipment and data storage equipment have been developed, requiring more advanced computer graphics technology and methods to create these massive datasets. With the expansion of the data visualization platform, the increase of the application field, the continuous change of the form of expression, and the addition of functions such as real-time dynamic effects and user interaction, the bound...

Claims


Application Information

Patent Timeline
Patent Type & Authority Patents(China)
IPC IPC(8): G06F17/30
CPCG06F16/29
Inventor 李正学许捍卫徐静波金文韬王海君
Owner HOHAI UNIV
Why Eureka
Try Eureka