
A method for automatic analysis of flow cytometer data

A flow cytometer and automatic analysis technology, which is applied in the field of automatic clustering algorithm of flow cytometer data, can solve the problems of high misjudgment rate of clustering results, over-fitting of clustering result models, and low accuracy of results. , to achieve the effect of improving repeatability and accuracy, wide application fields, and low misjudgment rate of results

Inactive Publication Date: 2017-10-31
SANITARY EQUIP INST ACAD OF MILITARY MEDICAL SCI PLA
View PDF3 Cites 0 Cited by
  • Summary
  • Abstract
  • Description
  • Claims
  • Application Information

AI Technical Summary

Problems solved by technology

Due to the subjectivity of the artificial door method, the results of the analysis are usually not reproducible
Moreover, the method of manually drawing gates cannot meet the needs of high-throughput data analysis, and will also cause a huge waste of human resources
[0004] Common flow cytometry data clustering algorithms, such as k-means algorithm, although the calculation speed is relatively fast, the accuracy of the analysis results is usually relatively low
At present, the more advanced change point detection algorithm based on k-means can improve the accuracy of data clustering results, but when there are high outliers in the data, the clustering results usually appear model overfitting phenomenon
Another data clustering method is the spectral clustering method. Although the accuracy of this method has been improved, because the method is based on the matrix product to estimate the results, the calculation time is very long when the sample size is large.
Aiming at this problem, a pre-sampling spectral clustering algorithm is currently proposed. This method solves the problem of long calculation time caused by large sample size. However, due to the pre-processing of the data, some biological information contained in the data may be processed. lost in process
In addition, when the analyzed data contains highly outlier values, the clustering results of this method usually have a high misjudgment rate

Method used


Image

  • A method for automatic analysis of flow cytometer data
  • A method for automatic analysis of flow cytometer data
  • A method for automatic analysis of flow cytometer data

Examples


Embodiment Construction

[0059] see Figure 6 , a flow cytometer data automatic analysis method, comprising the following steps:

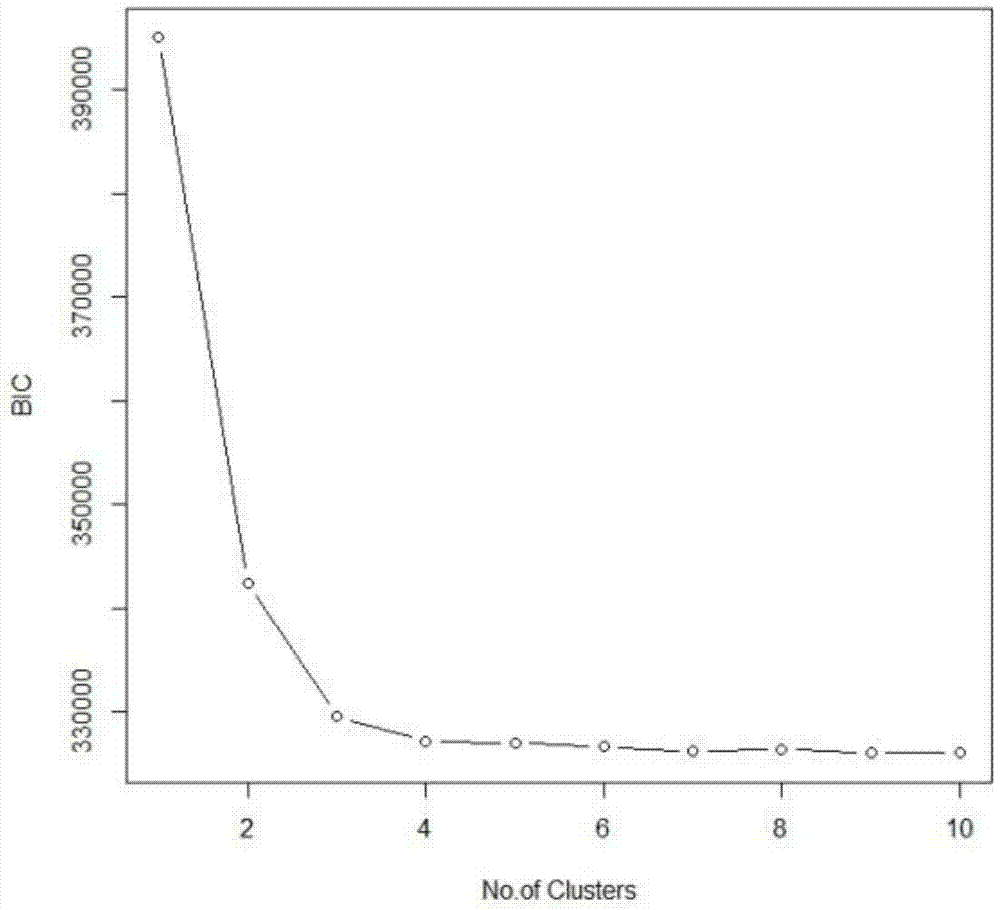
[0060] 1) Use the BIC method to automatically identify the taxa on the data, and obtain the number of taxa contained in the data

[0061]In order to accurately identify the number of groups in the flow cytometry data, the present invention proposes to adopt the BIC method. This method is based on the idea of ​​stochastic modeling, and with the help of information theory, the order of the model is determined by making the model reach the minimum value. It is defined as:

[0062] BIC=-2log+klogn (1)

[0063] Among them: L is the logarithmic value of the maximum value of the likelihood estimation of the mixed model, k is an independent parameter of the mixed model, and n represents the sample size, that is, the total number of sample particles. By calculating the BIC value corresponding to each component value k (value range is 1~g), select the k value corresponding to th...


PUM


Abstract

The invention discloses an automatic data analysis method of a flow cytometer. The automatic data analysis method of the flow cytometer comprises the following steps that (1) automatic cluster identification is carried out on data through a BIC method, and the number of clusters contained in the data is obtained; (2) after the number of the clusters contained in the data is obtained, automatic clustering is carried out on the data through a deflection t mixing model. The automatic data analysis method of the flow cytometer can carry out automatic and rapid analysis of the data of the flow cytometer through computer software, has good compatibility for a high outlier, can improve the repeatability and accuracy of data analysis, reduces influence on the analysis result from artificial subjective factors, has high accuracy of the cluster information analysis result of samples in the data, has a low error judgment rate of data analysis results of the flow cytometer and is wide in application range.

Description

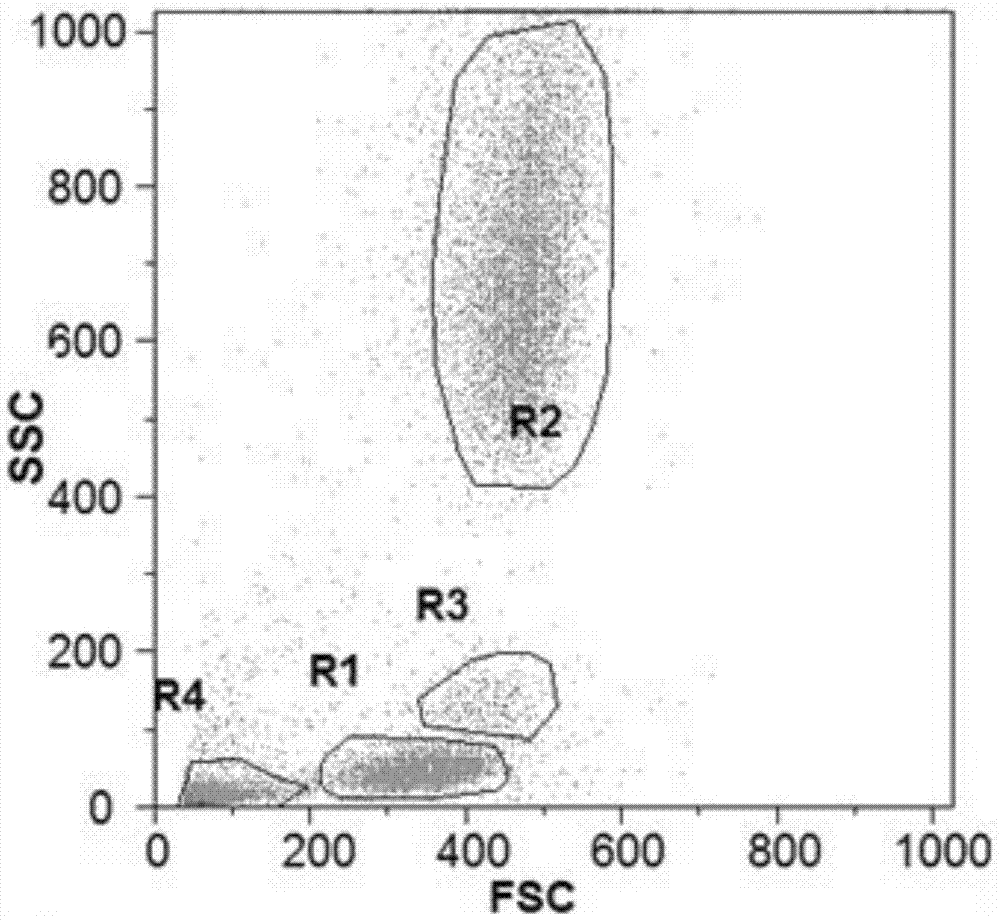
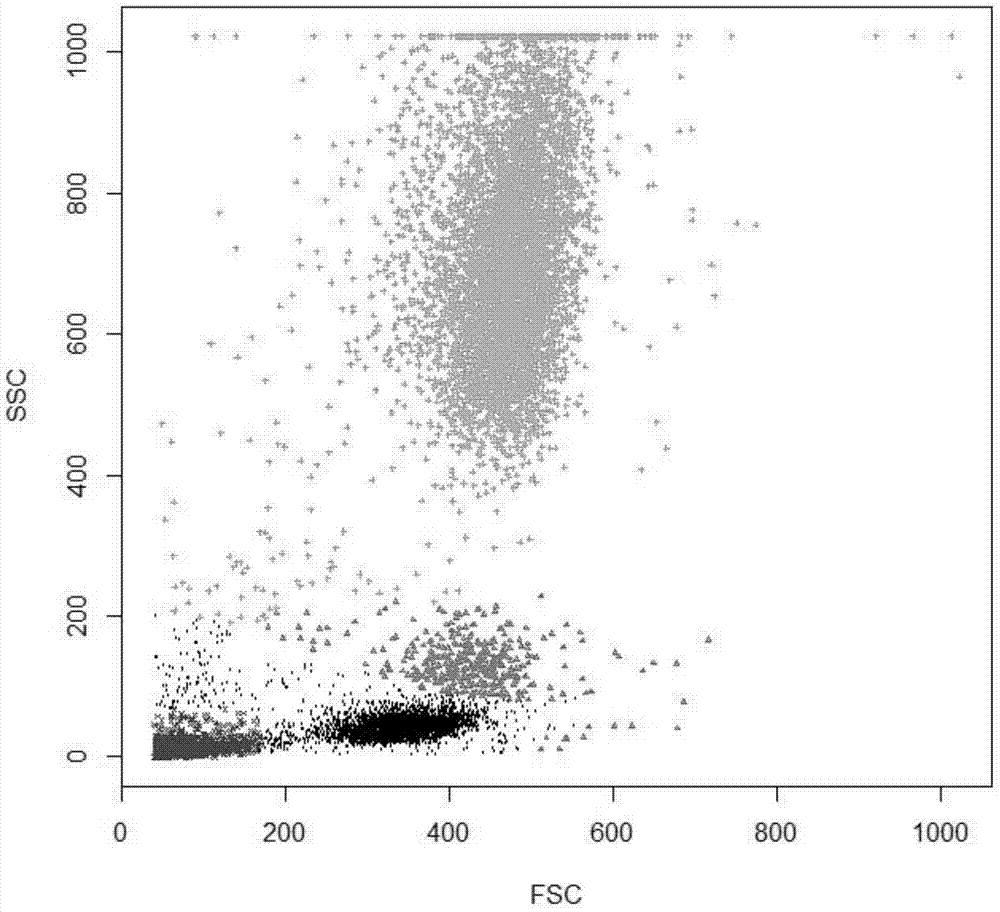
technical field [0001] The invention relates to an automatic analysis technology of flow cytometer data, in particular to an automatic clustering algorithm of flow cytometer data. technical background [0002] Flow cytometry is a technique that can accurately and quickly perform multi-parameter quantitative analysis of the physicochemical and biological properties of biological cells and sort specific cell groups. In recent years, flow cytometry has developed rapidly and has been widely used in many fields. Flow cytometry has developed towards multi-laser and high-throughput, and has the ability to quickly detect a large number of samples in a relatively short period of time. However, due to the lack of a mature and parallel data automatic analysis platform, flow cytometry is far from realizing its great potential to realize the automatic analysis of samples. [0003] The main process of flow cytometry data analysis is the group identification of the sample, that is, to fi...

Claims


Application Information

Patent Timeline
Patent Type & Authority Patents(China)
IPC IPC(8): G06F19/00G01N35/00G01N15/10
Inventor 王先文程智陈锋杜耀华暴洪涛李辰宇吴太虎
Owner SANITARY EQUIP INST ACAD OF MILITARY MEDICAL SCI PLA
Learn More