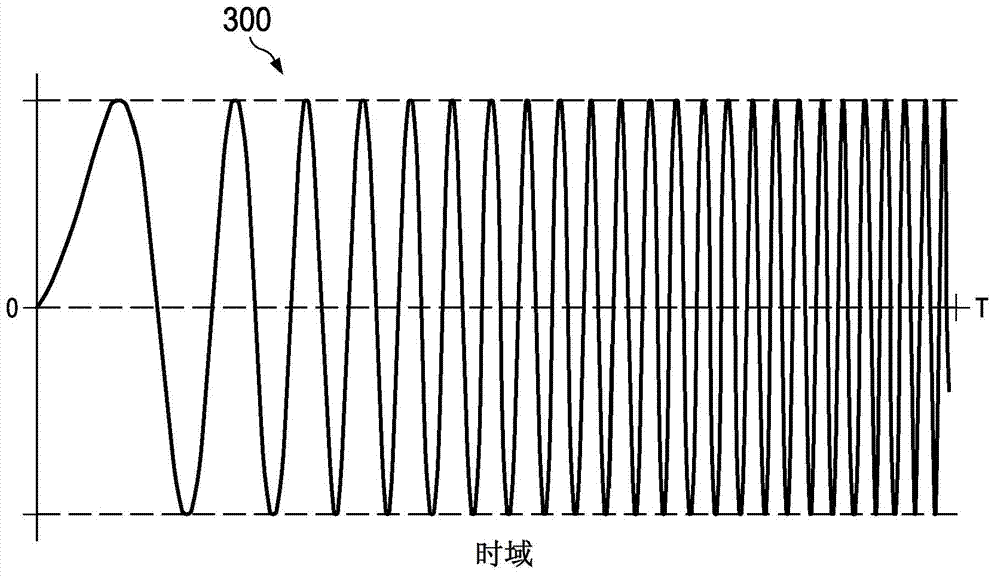
System frequency response test using continuous sweep frequencies

A technology of chirp frequency and system under test, applied in the field of accurate analysis, can solve problems such as poor resolution, and achieve the effect of improving resolution

Active Publication Date: 2013-07-10
TEXAS INSTR INC
View PDF4 Cites 4 Cited by
  • Summary
  • Abstract
  • Description
  • Claims
  • Application Information

AI Technical Summary

Problems solved by technology

Therefore, the resolution of the filter bandwidth test provided by the existing test system is poor

Method used


Image

  • System frequency response test using continuous sweep frequencies
  • System frequency response test using continuous sweep frequencies
  • System frequency response test using continuous sweep frequencies

Examples


Embodiment Construction

[0018] FIG. 1 illustrates a conventional single tone test system 100 . The sine wave generator 101 is coupled to the input of a system under test 102, which may be, for example, a filter. A digitizer 103 acquires and digitizes the output of the system under test 102 and then transmits it to a fast Fourier transform (FFT) circuit 104 which computes the discrete Fourier transform (DFT) of the acquired output signal. In system 100, digitizer 103 acquires once for each frequency from sine wave generator 101, and FFT circuit 104 generates a DFT data point for each acquired signal. Of all the FFT data, only one DFT data point is required, which is not a time efficient use. Testing narrowband filters, such as bandpass or bandstop filters, using system 100 may be difficult due to the practical trade-off of long test times and low data points. The more data points required to measure the response of a narrowband filter, the longer the measurement time. In addition, it is difficult f...


PUM


Abstract

A system and method for measuring the frequency response of a system under test using a single swept-frequency chirp signal. A tapered chirp-frequency test signal is created with a bandwidth defined by first and second frequencies (1101). The test signal is routed to a calibration path (1102), and the output of the calibration path is routed to a digitizer (1103). The output of the calibration path is digitized (1104), and a Fourier Transform of the calibration path output is generated (1105). The test signal is then routed to a test system (1106), and the output of the test system is coupled to the digitizer (1107). The output of the test system is digitized (1108), and a Fourier Transform of the test system output is generated (1109). A normalized frequency- domain representation of the test system is created by dividing the Fourier Transform of the test system output by the Fourier Transform of the calibration path output (1110).

Description

technical field [0001] Embodiments of the present invention generally relate to testing the frequency response of a hardware system, and more particularly to providing accurate analysis of a system under test using a continuously scanned input signal. Background technique [0002] Testing the frequency response of a filter is a time-consuming task, especially when testing a wide frequency range in the filter. In existing systems, a sinusoidal waveform generator is coupled to the filter under test and generates a single-tone (ie, single-frequency) test signal. The output signal is acquired as the sinusoidal waveform generator inputs test signals of different frequencies into the filter one at a time. When a sufficient number of signals of different frequencies are input and the associated output signals are acquired, the frequency response of the filter can be measured. When multiple filters must be tested over a wide frequency range, such as in a production-test environmen...

Claims


Application Information

Patent Timeline
Patent Type & Authority Applications(China)
IPC IPC(8): G01R23/16
CPCG01R31/2837G01R31/2839
Inventor T·J·探戈
Owner TEXAS INSTR INC
Why Eureka
Try Eureka