Method and system for facilitating control of an industrial system

a technology for industrial systems and display systems, applied in the field of industrial systems, can solve the problems of presenting a challenge to an operator, affecting the operation of the system, so as to achieve the effect of facilitating the operation of the operator

Active Publication Date: 2014-12-30
HITACHI ENERGY LTD
View PDF8 Cites 2 Cited by
  • Summary
  • Abstract
  • Description
  • Claims
  • Application Information

AI Technical Summary

Benefits of technology

[0011]A general object of the present invention is to provide a method and control system which facilitates for an operator of an industrial system to monitor and control the industrial system.
[0016]Thereby, the at least one object may be displayed in a depth layer which may facilitate for a user to detect when a state of an element or equipment in the industrial system changes such that it should be brought to the attention of an operator monitoring the industrial system.
[0020]The step of mapping comprises mapping the at least one object to a depth layer in a near field of the three-dimensional view when the parameter value deviates from a criterion associated with a corresponding element in the industrial system. By mapping the parameter value to a near field depth layer and displaying the object in the said near field depth layer, an operator monitoring the industrial system via the display device will easily detect deviations in the behavior of the corresponding element or equipment in the industrial system.
[0023]The step of displaying may comprise visually moving the at least one object from the depth layer to the another depth layer. Thereby it may be easier for an operator to detect an event such as a change in a state of an element or equipment in the industrial system.

Problems solved by technology

However the exemplary process diagram of a two-dimensional representation for a part of a power network control system is still somewhat cluttered.
A great number of numerical displays of states and values are often arranged in one single process diagram, presenting a challenge to an operator as being difficult both to absorb an overview as well as to focus on one or more values or equipment states in particular.
However for the purposes of supervision and control of computer controlled power distribution systems as well as some other industrial processes and automation, there exist drawbacks with known display systems and methods.

Method used


Image

  • Method and system for facilitating control of an industrial system
  • Method and system for facilitating control of an industrial system
  • Method and system for facilitating control of an industrial system

Examples


Embodiment Construction

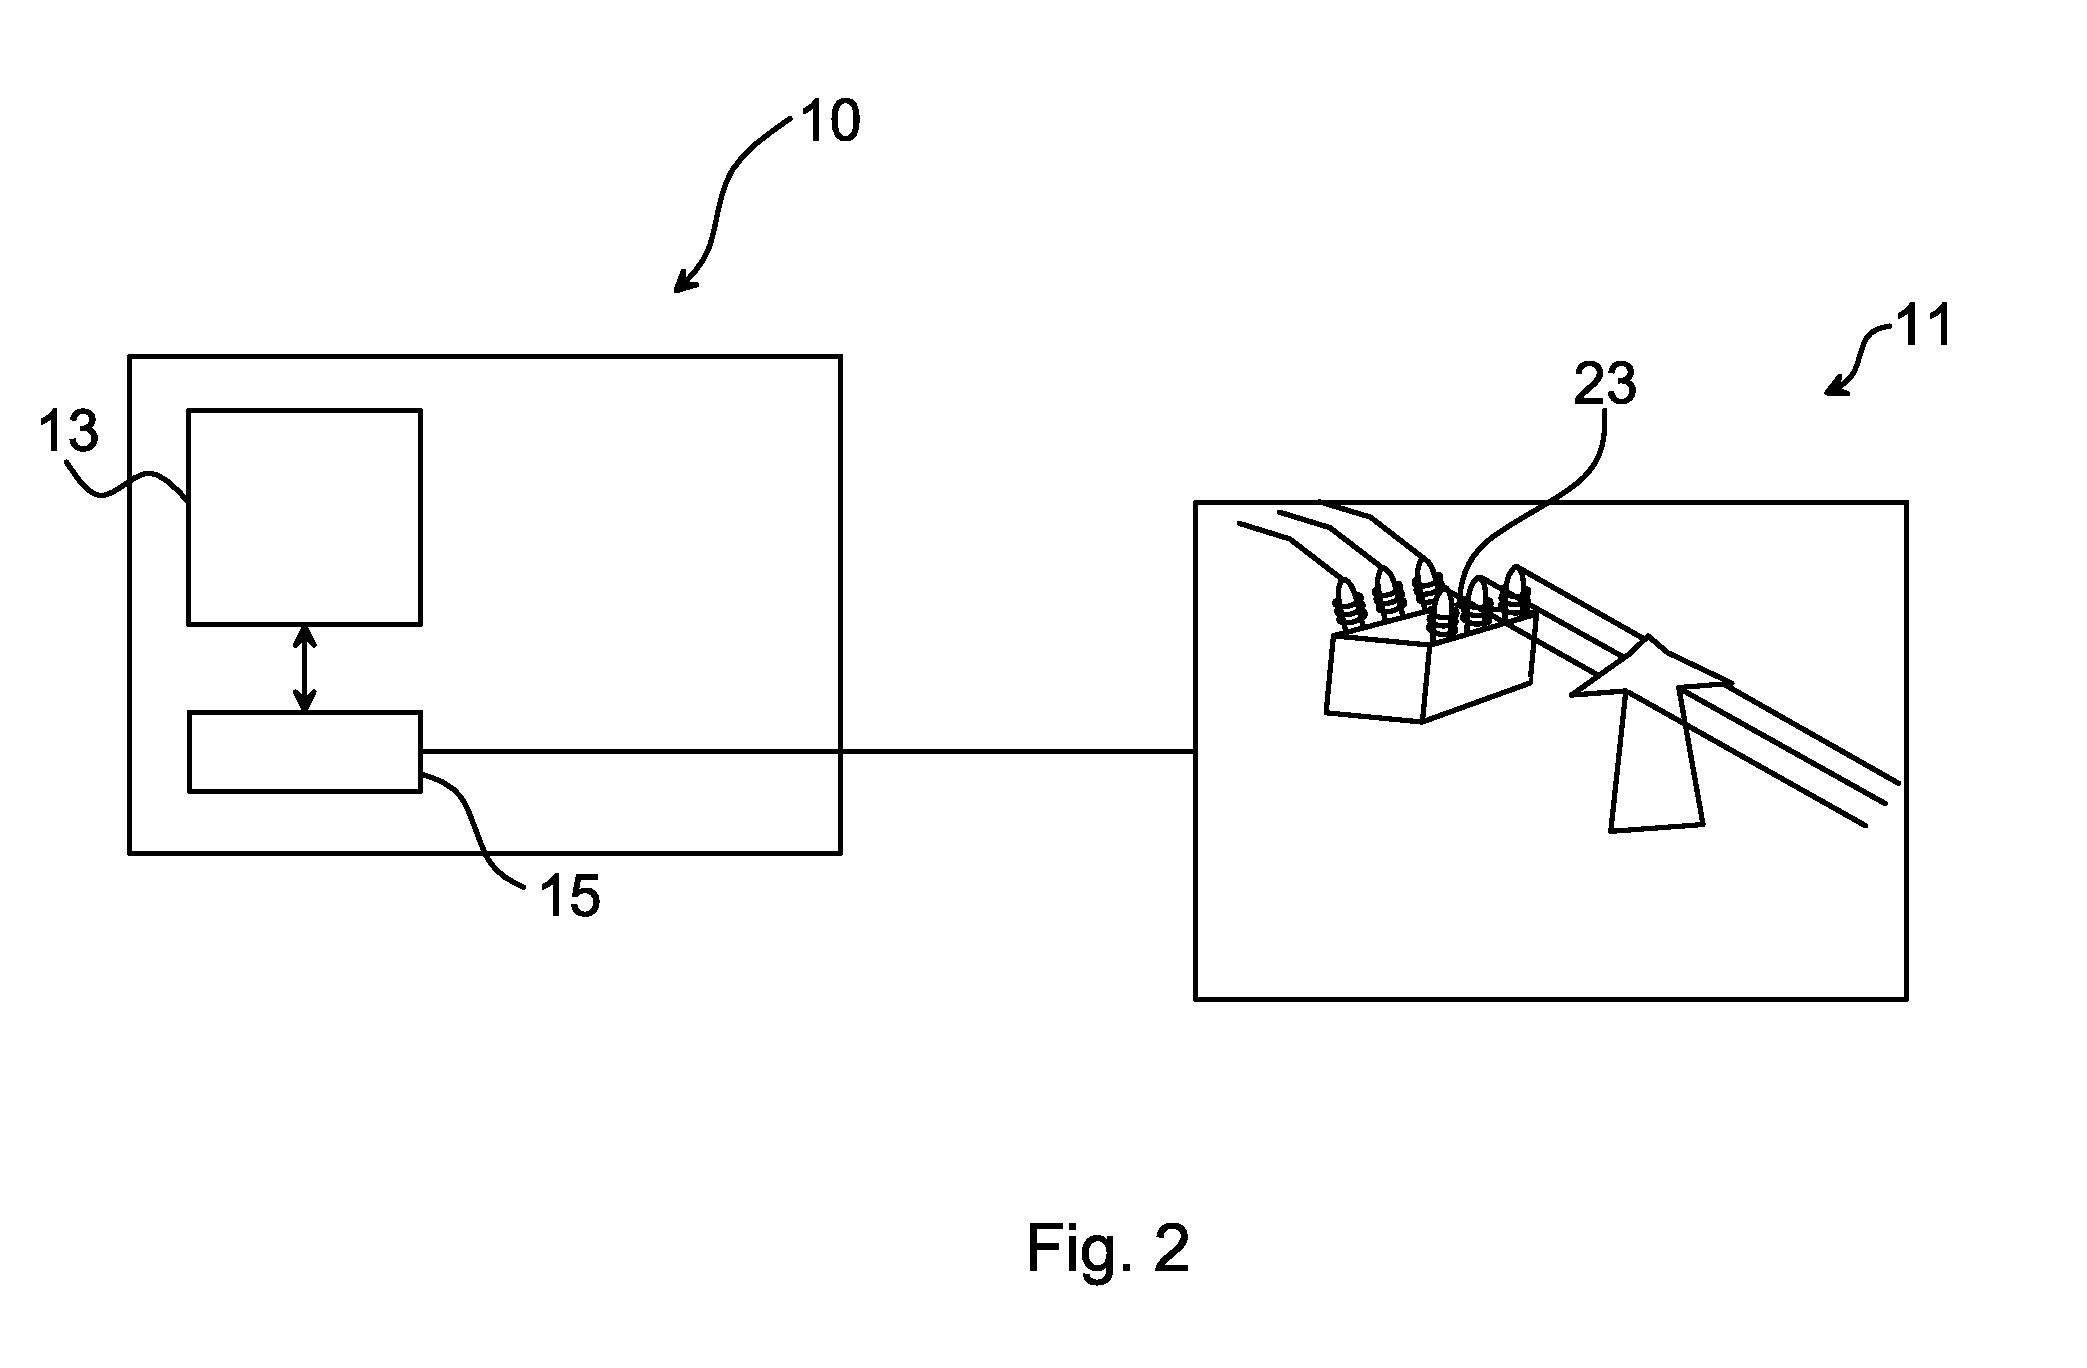
[0042]FIG. 2 shows an example of a control system 10 connected to an industrial system 11. An industrial system may be any kind of industrial system, such as a power plant, an automated process in a factory, a local electrical distribution network, or a larger part of an electrical grid.

[0043]The control system 10 comprises a display device 13 and a processor 15 connected to the display device 13. The processor 15 adapted to receive data from the industrial system 11. Typically, the processor 15 may be connected to the industrial system 11 by means of an interface comprising a data input unit suitable for communicating data from the industrial system 11 to the processor 15. Such devices would be apparent to the skilled person and will therefore not be elaborated further herein.

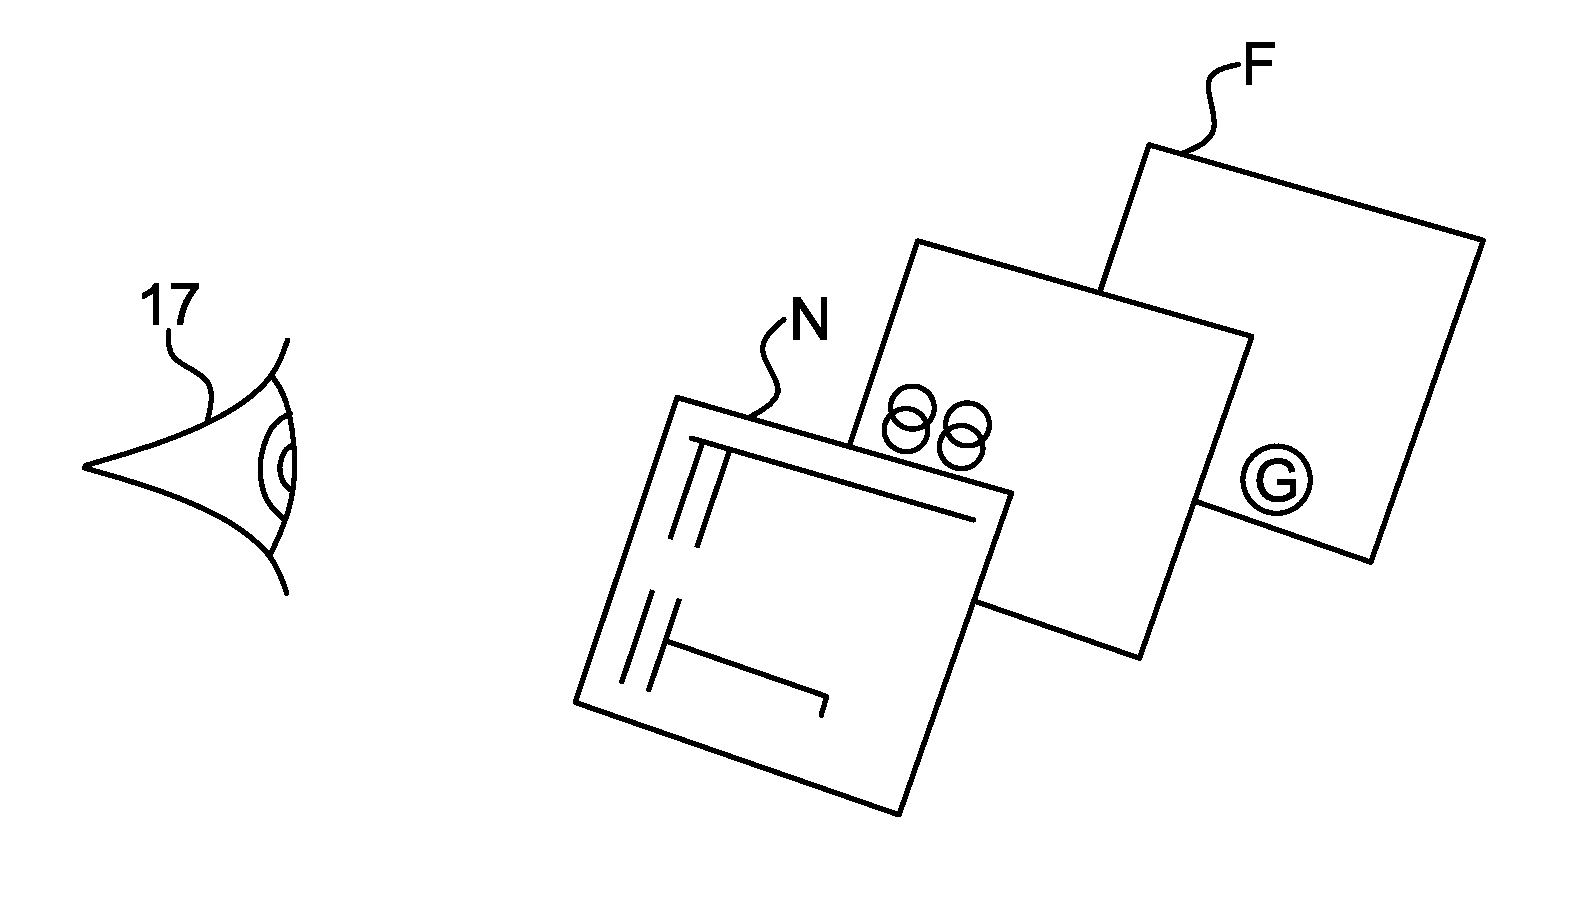
[0044]The display device 13 may typically be a computer screen or similar device able to graphically present data. In a preferred embodiment, the display device is a stereoscopic display of the kind currently ...


PUM


Abstract

A method for displaying a two-dimensional image in a three-dimensional view. The two-dimensional image is formed by a plurality of objects representing elements of an industrial system. The three-dimensional view is displayed on a display of a control system of the industrial system, wherein at least one object is associated with a parameter value pertaining to a state of a corresponding element in the industrial system. The method includes determining the parameter value for the object; mapping the parameter value to a depth layer, which depth layer defines part of the three-dimensional view; and displaying the object in the depth layer. A corresponding control system is also presented herein.

Description

FIELD OF THE INVENTION[0001]The invention generally relates to industrial systems and in particular to display techniques for monitoring and controlling an industrial system.BACKGROUND OF THE INVENTION[0002]Displays for industrial control systems, process control systems, Supervisory Control and Data acquisition (SCADA) systems and the like are used to display a graphic diagram of the industrial system to operators monitoring the industrial system.[0003]Operators may thereby be able to recognize an alarm or a trend in the industrial system and, as a result, take measures to solve the problem giving rise to the alarm or trend.[0004]FIG. 1 shows an example of a single line diagram of part of a distribution system 1 in a power grid. There is a lot of different information in the single line diagram relating to the distribution system that it represents. Some elements or equipment is presented in a different color to indicate a different type of information.[0005]The diagram shows two b...

Claims


Application Information

Patent Timeline
Patent Type & Authority Patents(United States)
IPC IPC(8): G06T15/00G05B15/00G05B23/02
CPCG05B23/0267G05B15/00
Inventor MIKKELSEN, CHRISTINE
Owner HITACHI ENERGY LTD
Why Eureka
Try Eureka