User-configurable network performance monitors

a network performance monitor and user-configurable technology, applied in the field of network analysis, can solve the problems of increasing the cost of developing or modifying a tool to satisfy many diverse requirements, consuming substantial development time for the development of a new output format, and becoming increasingly difficult to anticipate their needs or desires for tools. to achieve the effect of reducing development costs

Active Publication Date: 2013-11-05
RIVERBED TECH LLC
View PDF7 Cites 2 Cited by
  • Summary
  • Abstract
  • Description
  • Claims
  • Application Information

AI Technical Summary

Benefits of technology

[0009]It would be advantageous to reduce development costs by allowing users to customize the display of a network analysis tool. It would also be advantageous to allow a user to define criteria for distinguishing among messages and displaying the distinguished messages. It would also be advantageous to allow a user to augment a network analysis tool with user-definable programs to distinguish among messages. It would also be advantageous to label distinguished messages, and to allow a user to control the labeling.
[0010]These advantages, and others, can be realized by a network analysis system that provides for a user-definable display of information related to messages communicated on the network. The network analysis system includes one or more display formats that provide a display of message exchanges between nodes of a network, and a display augmenter that provides additional information on the display based on a user-defined visualization. The user defined visualization includes augmenting the display based on user-defined message characteristics and / or augmenting the display with user-defined labels and / or user-configured labelings. To further facilitate user control of the augmentation of the display, the system accepts user-defined programs for discriminating among messages, for controlling the labeling of messages, and for controlling the coloring of messages and labels. Commonly used user-defined characteristics and labels are stored in a library, for use via a selection from among the library entries.

Problems solved by technology

As the use of network analysis tools increases, the diversity of the users of the tools increases, and it becomes increasingly difficult to anticipate their needs or desires for the tools.
Even when the needs and desires are defined, the cost of developing or modifying a tool to satisfy many diverse requirements increases exponentially.
These development costs are particularly sensitive to tasks related to the “look and feel” of a tool, as user preferences are highly subjective, yet often determinative with regard to whether a user chooses to purchase the tool.
If a different graphic output is required to provide a display that illustrates the particular characteristics of interest for this group, the development of the new output format generally consumes substantial development time.
In like manner, if a particular ‘favored’ customer expresses a desire for a customized graphic output that illustrates different and / or additional characteristics, relative to the default output format(s), a substantial amount of development time may be consumed developing such a customized format.

Method used


Image

  • User-configurable network performance monitors
  • User-configurable network performance monitors
  • User-configurable network performance monitors

Examples


Embodiment Construction

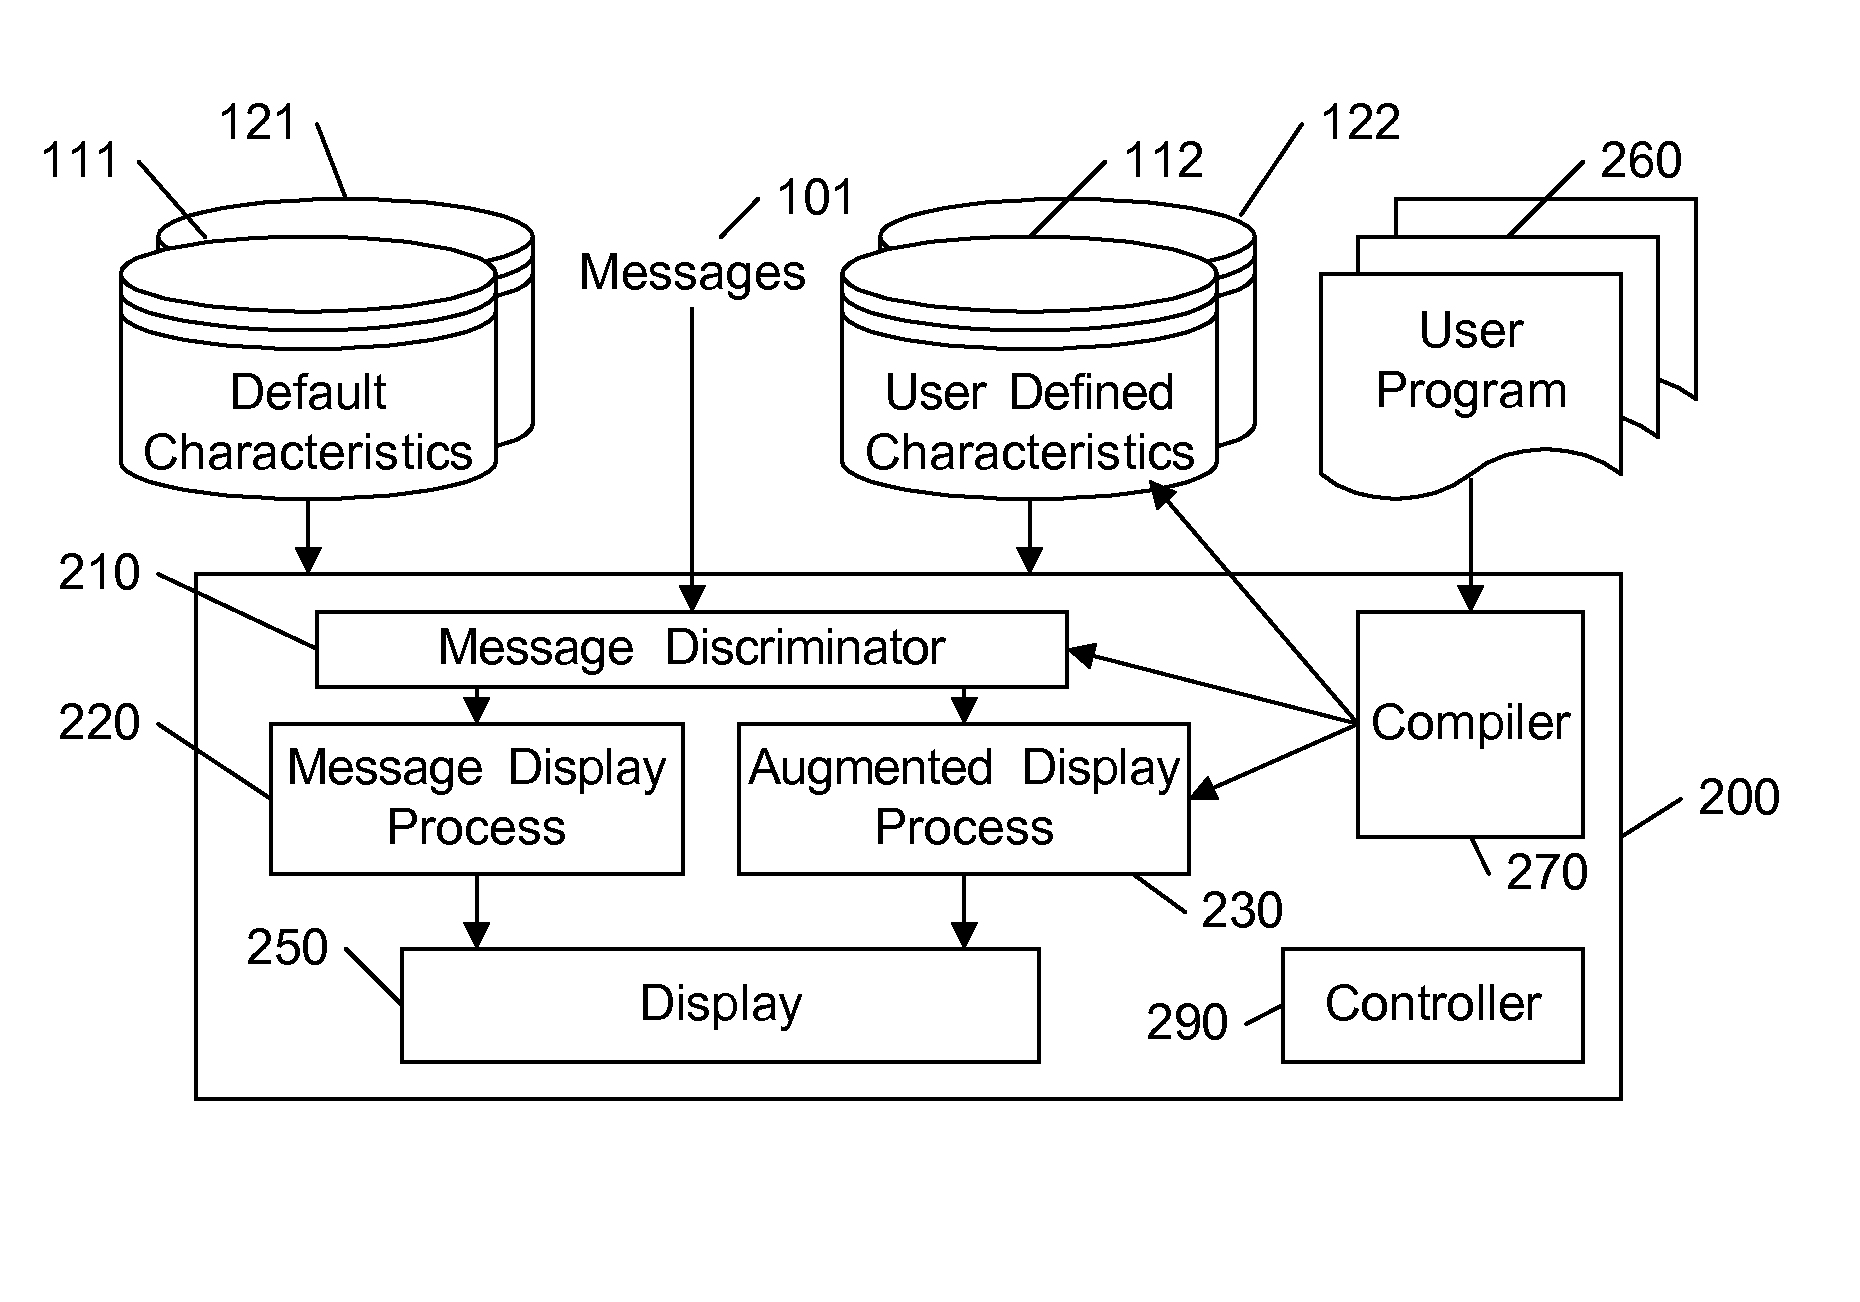
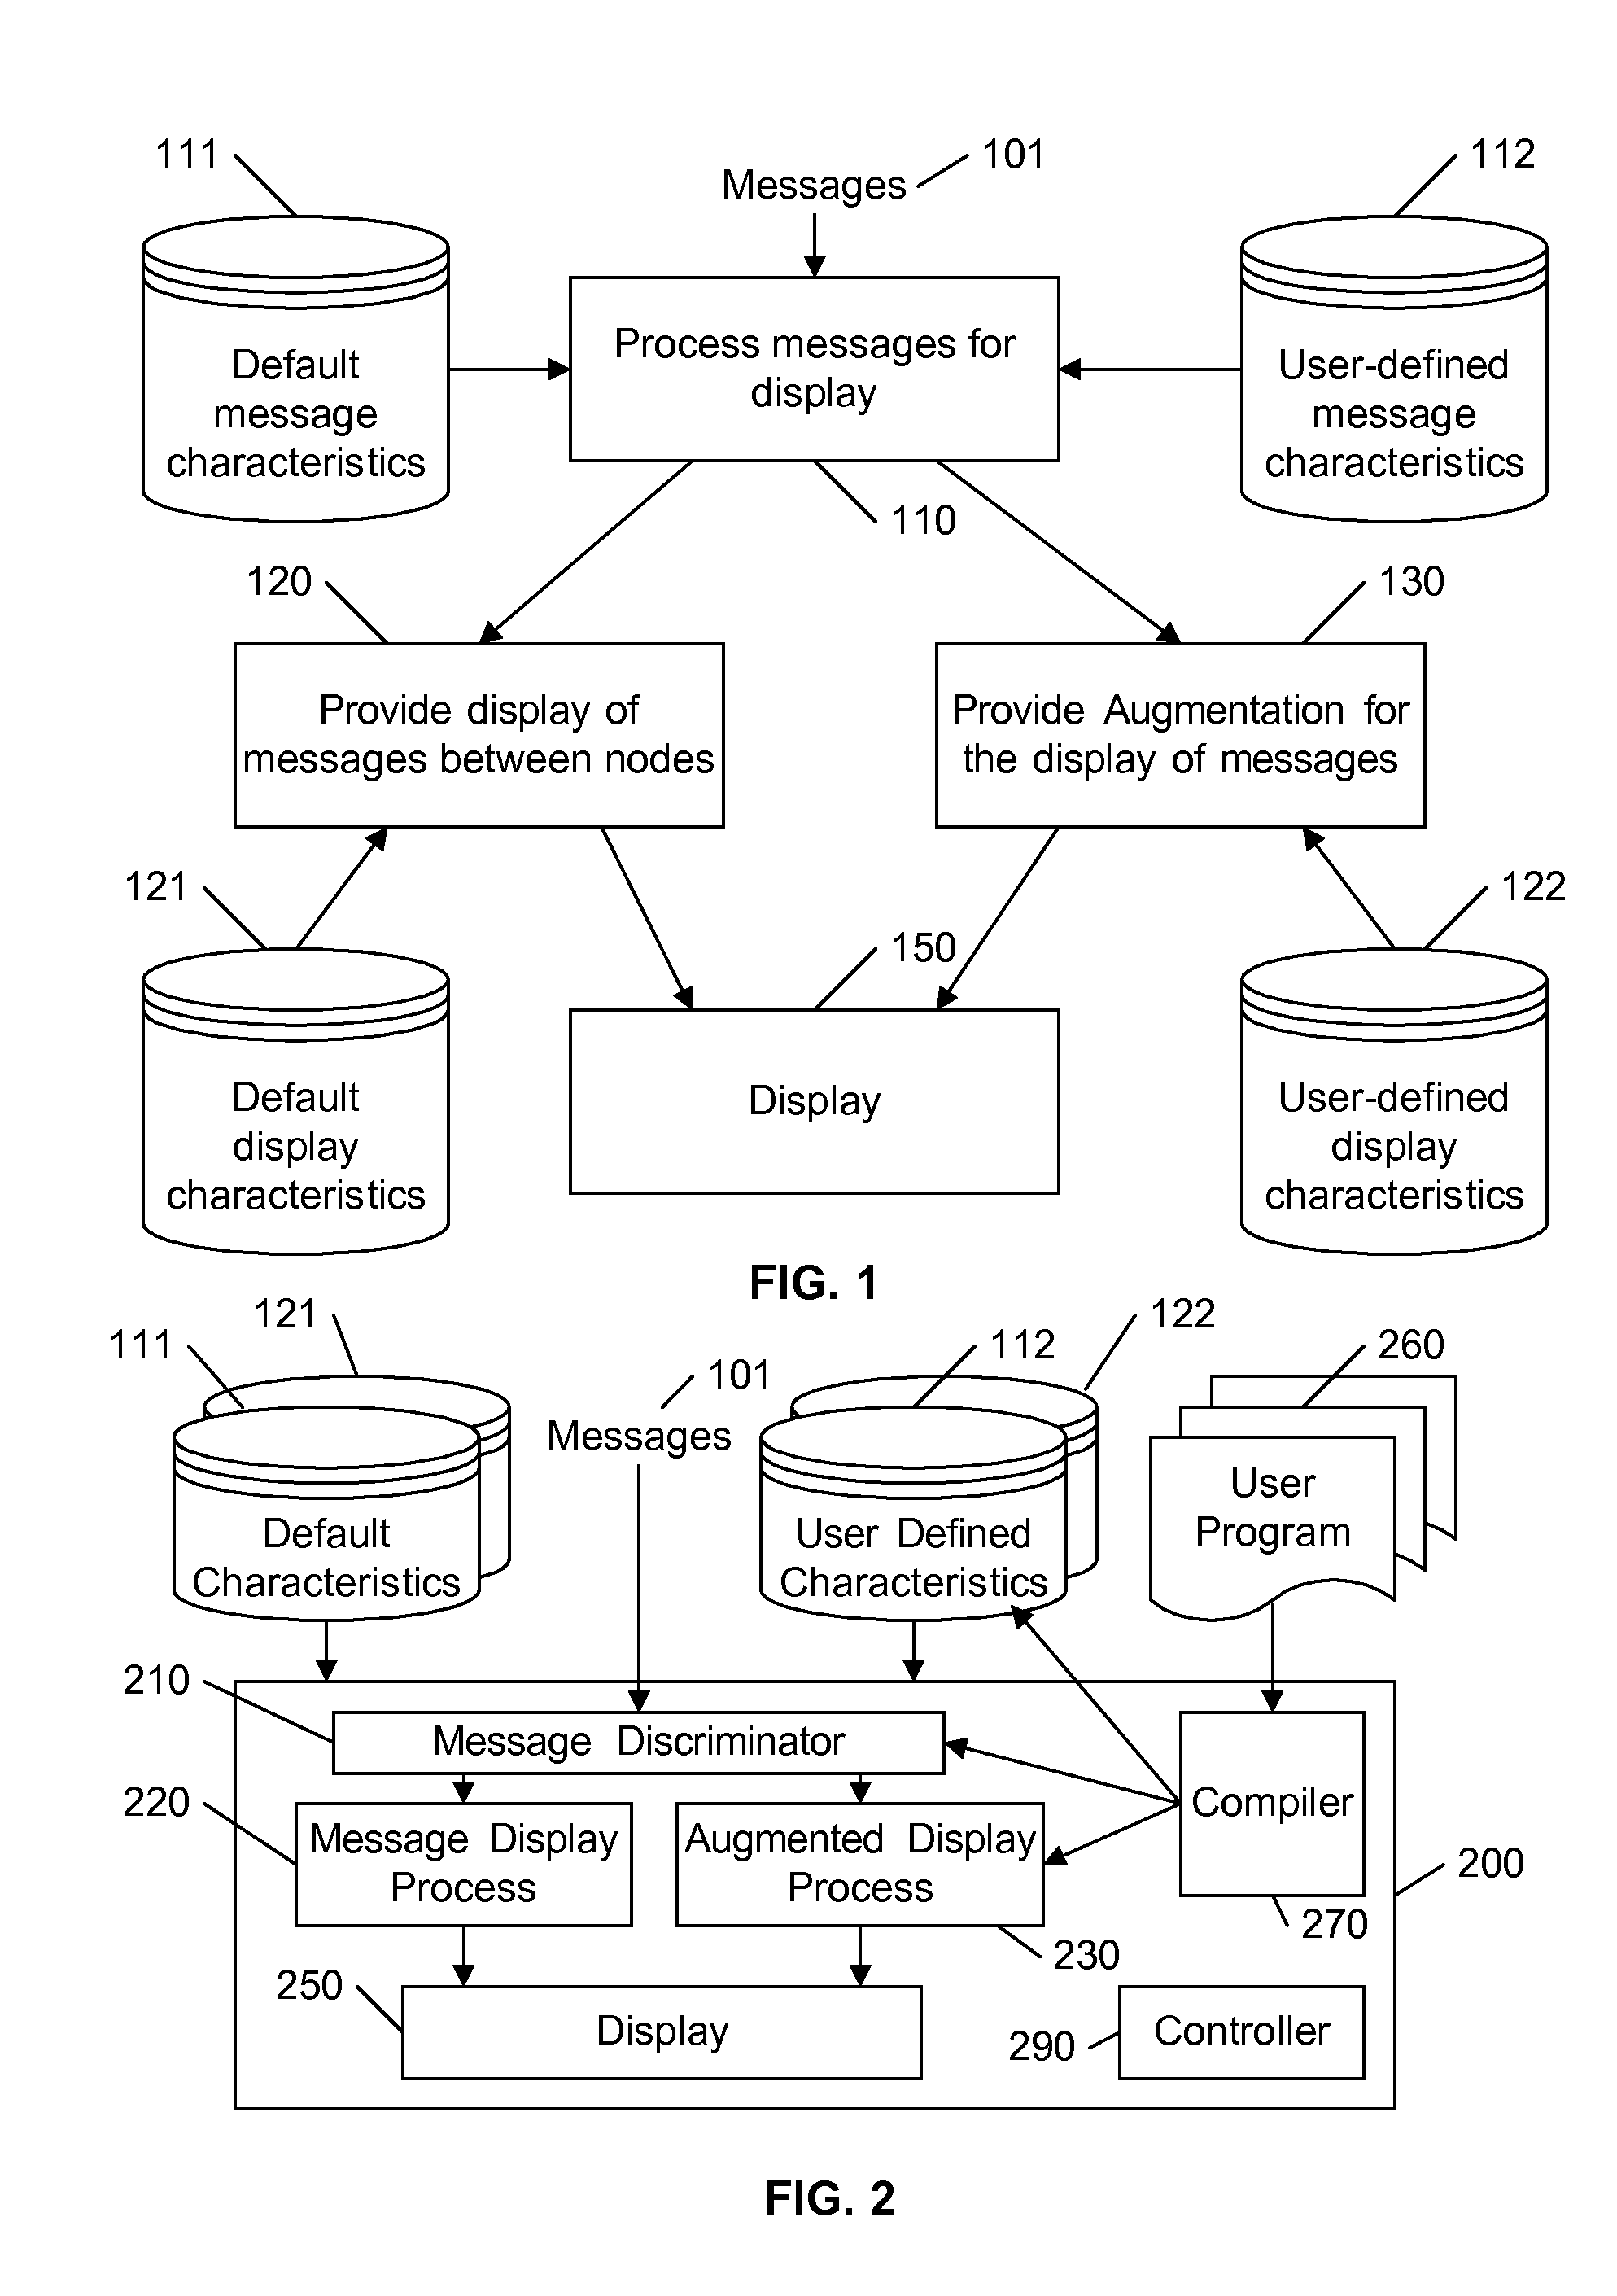
[0019]In the following description, for purposes of explanation rather than limitation, specific details are set forth such as the particular architecture, interfaces, techniques, etc., in order to provide a thorough understanding of the concepts of the invention. However, it will be apparent to those skilled in the art that the present invention may be practiced in other embodiments, which depart from these specific details. In like manner, the text of this description is directed to the example embodiments as illustrated in the Figures, and is not intended to limit the claimed invention beyond the limits expressly included in the claims. For example, the invention is presented in the context of packets of data being transmitted between nodes, although one of ordinary skill in the art will recognize that the concepts of this invention are not limited to packet-based networks. For purposes of simplicity and clarity, detailed descriptions of well-known devices, circuits, and methods ...


PUM


Abstract

A network analysis system provides for a user-definable display of information related to messages communicated on the network. The network analysis system includes one or more display formats that provide a display of message exchanges between nodes of a network, and a display augmenter that provides additional information on the display based on a user-defined visualization. The user defined visualization includes augmenting the display based on user-defined coloring characteristics and / or augmenting the display with user-defined labels. To further facilitate user control of the augmentation of the display, the system accepts user-defined programs for discriminating among messages, for controlling the labeling of messages, and for controlling the coloring of messages and labels. Commonly used user-defined characteristics and labels are stored in a library, for use via a selection from among the library entries.

Description

[0001]This application claims the benefit of U.S. Provisional Patent Application 60 / 778,140, filed 1 Mar. 2006.BACKGROUND AND SUMMARY OF THE INVENTION[0002]This invention relates to the field of network analysis, and in particular to user-configurable visualizations for network application performance tools.[0003]More and more applications are designed to be “network-enabled”, and the demands for efficient network performance continue to escalate. With increased reliance upon network communications, the demands for network analysis tools also continue to escalate.[0004]To remain competitive, providers of network analysis tools strive to achieve market distinction. Such market distinction is generally achieved by providing inherent analysis capabilities that other providers do not provide, or by providing a user interface that is preferable to the intended user. Significant market research is devoted to identifying the intended users of a tool and the expectations of these users.[000...

Claims


Application Information

Patent Timeline
Patent Type & Authority Patents(United States)
IPC IPC(8): G06F15/16
CPCH04L41/22H04L43/045H04L43/10
Inventor MALLOY, PATRICK J.DUNN, ANTOINESTROHM, JOHN WILSONNIEMCZYK, STEVEN
Owner RIVERBED TECH LLC
Why Eureka
Try Eureka