Deriving central aortic systolic pressure and analyzing arterial waveform data to derive central aortic systolic pressure values
a technology of central aortic systolic pressure and analysis of arterial waveform data, which is applied in the field ofderiving the analyzing arterial waveform data to derive central aortic systolic pressure values, can solve the problems of introducing errors in central aortic pressure readings on patients, and heart disease is a serious health problem
- Summary
- Abstract
- Description
- Claims
- Application Information
AI Technical Summary
Benefits of technology
Problems solved by technology
Method used
Image
Examples
first embodiment
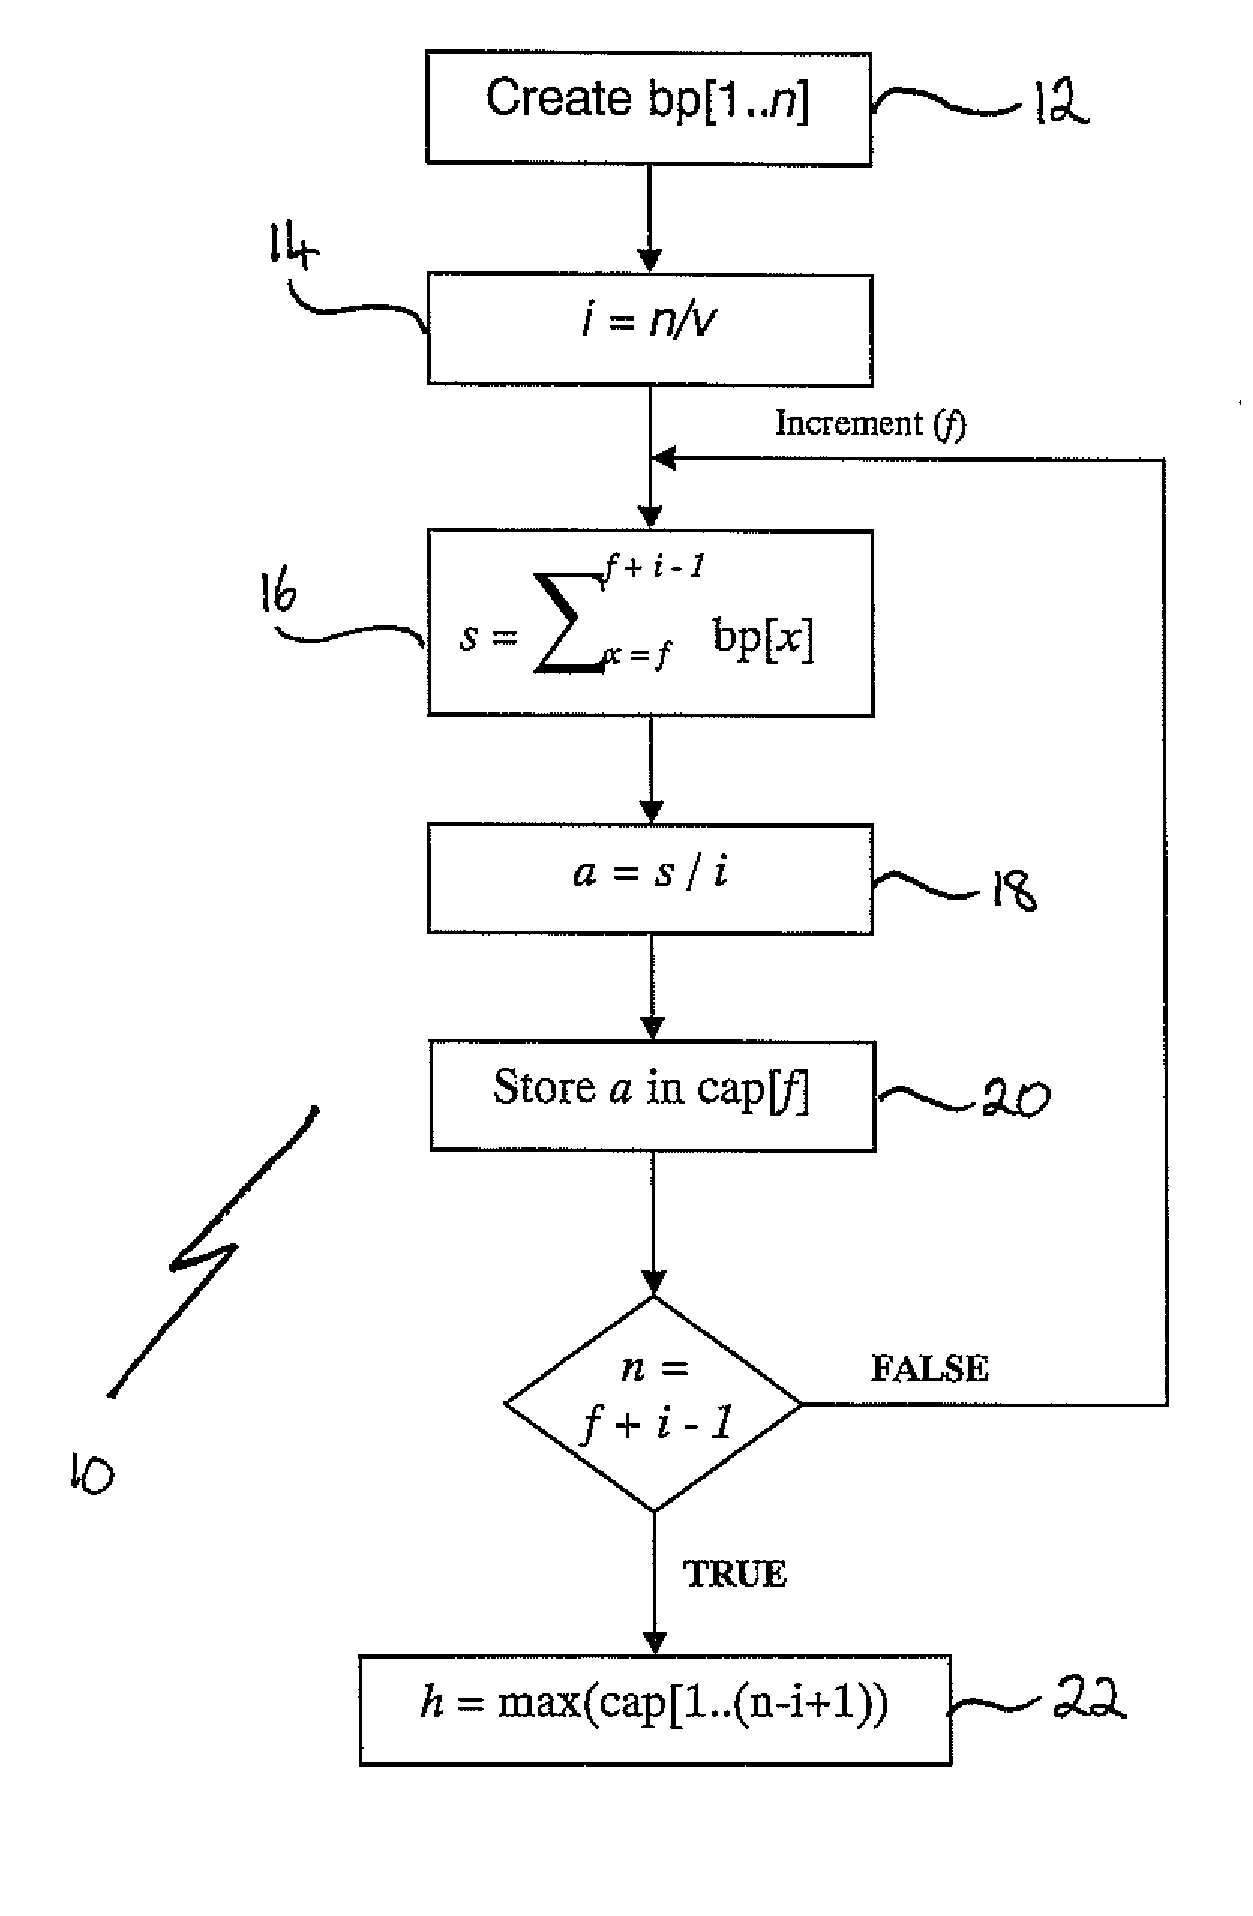
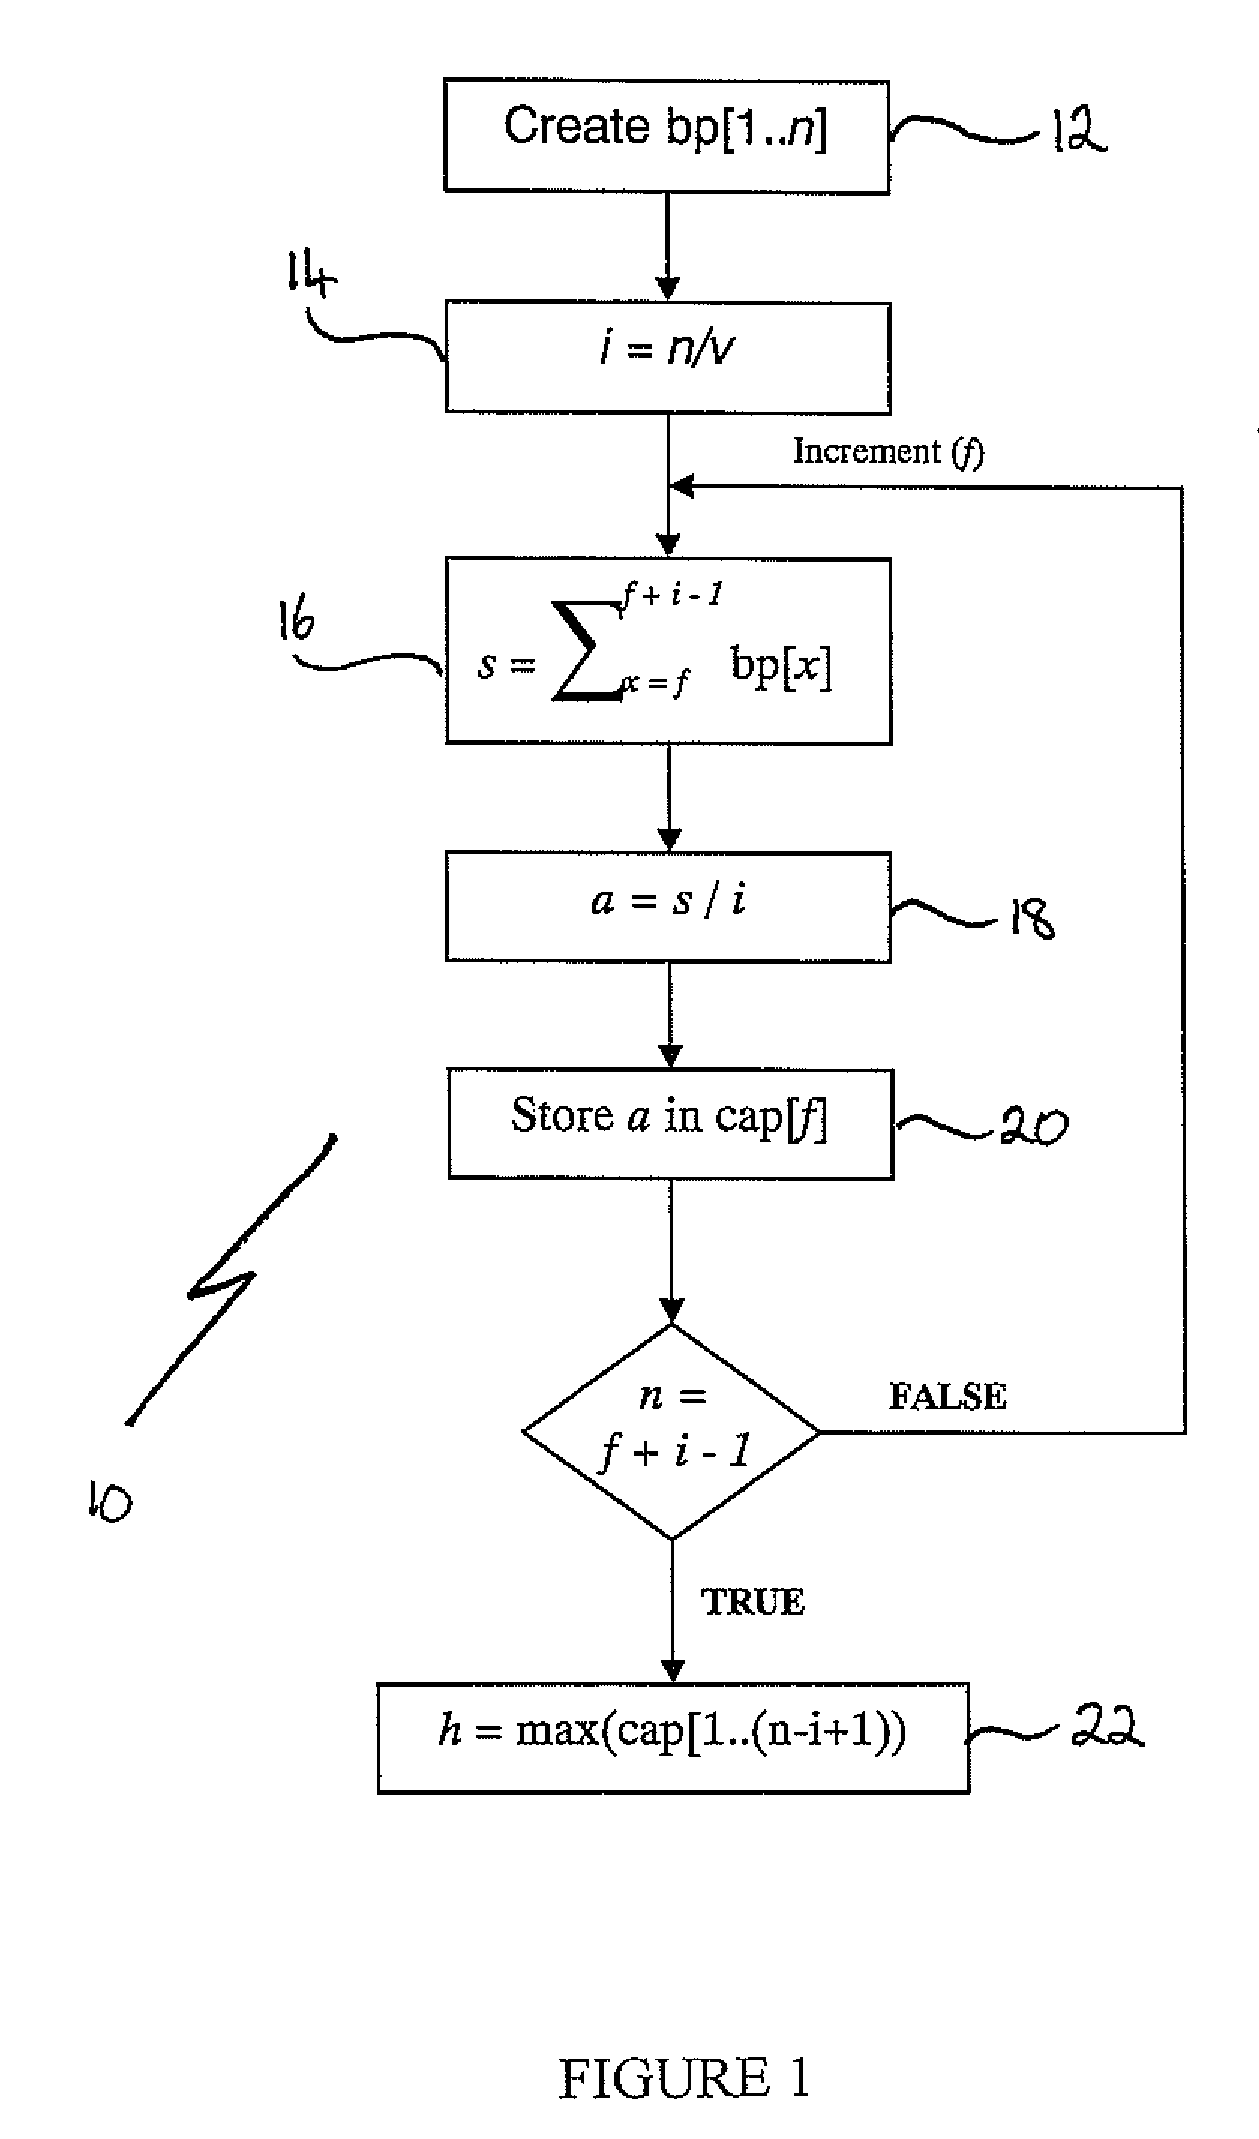
[0069]In accordance with the invention there is a method of determining central aortic pressure 10. The method 10 is illustrated in flow chart form in FIG. 1.
[0070]As shown in FIG. 1, the method 10 commences by the creation of a set of blood pressure measurements from a living body representative of an arterial waveform (step 12). The set of blood pressure measurements has a predetermined number of measurements (n). At step 14, the predetermined number n is divided by a preset value (v) to determine an integer interval value (i). In this manner, the integer interval value (i) may be subjected to an absolute or rounding mathematical function.
[0071]The following steps are then repeated, commencing with a first blood pressure measurement bp[(f)]:[0072]The blood pressure measurements {bp[f], bp[f+1], bp[f+2], bp[f+3], . . . , bp[f+i−1]} are summed (step 16) to form a value s;[0073]The summed value s be divided by the interval value i to form an average blood pressure value (a) (step 18)...
second embodiment
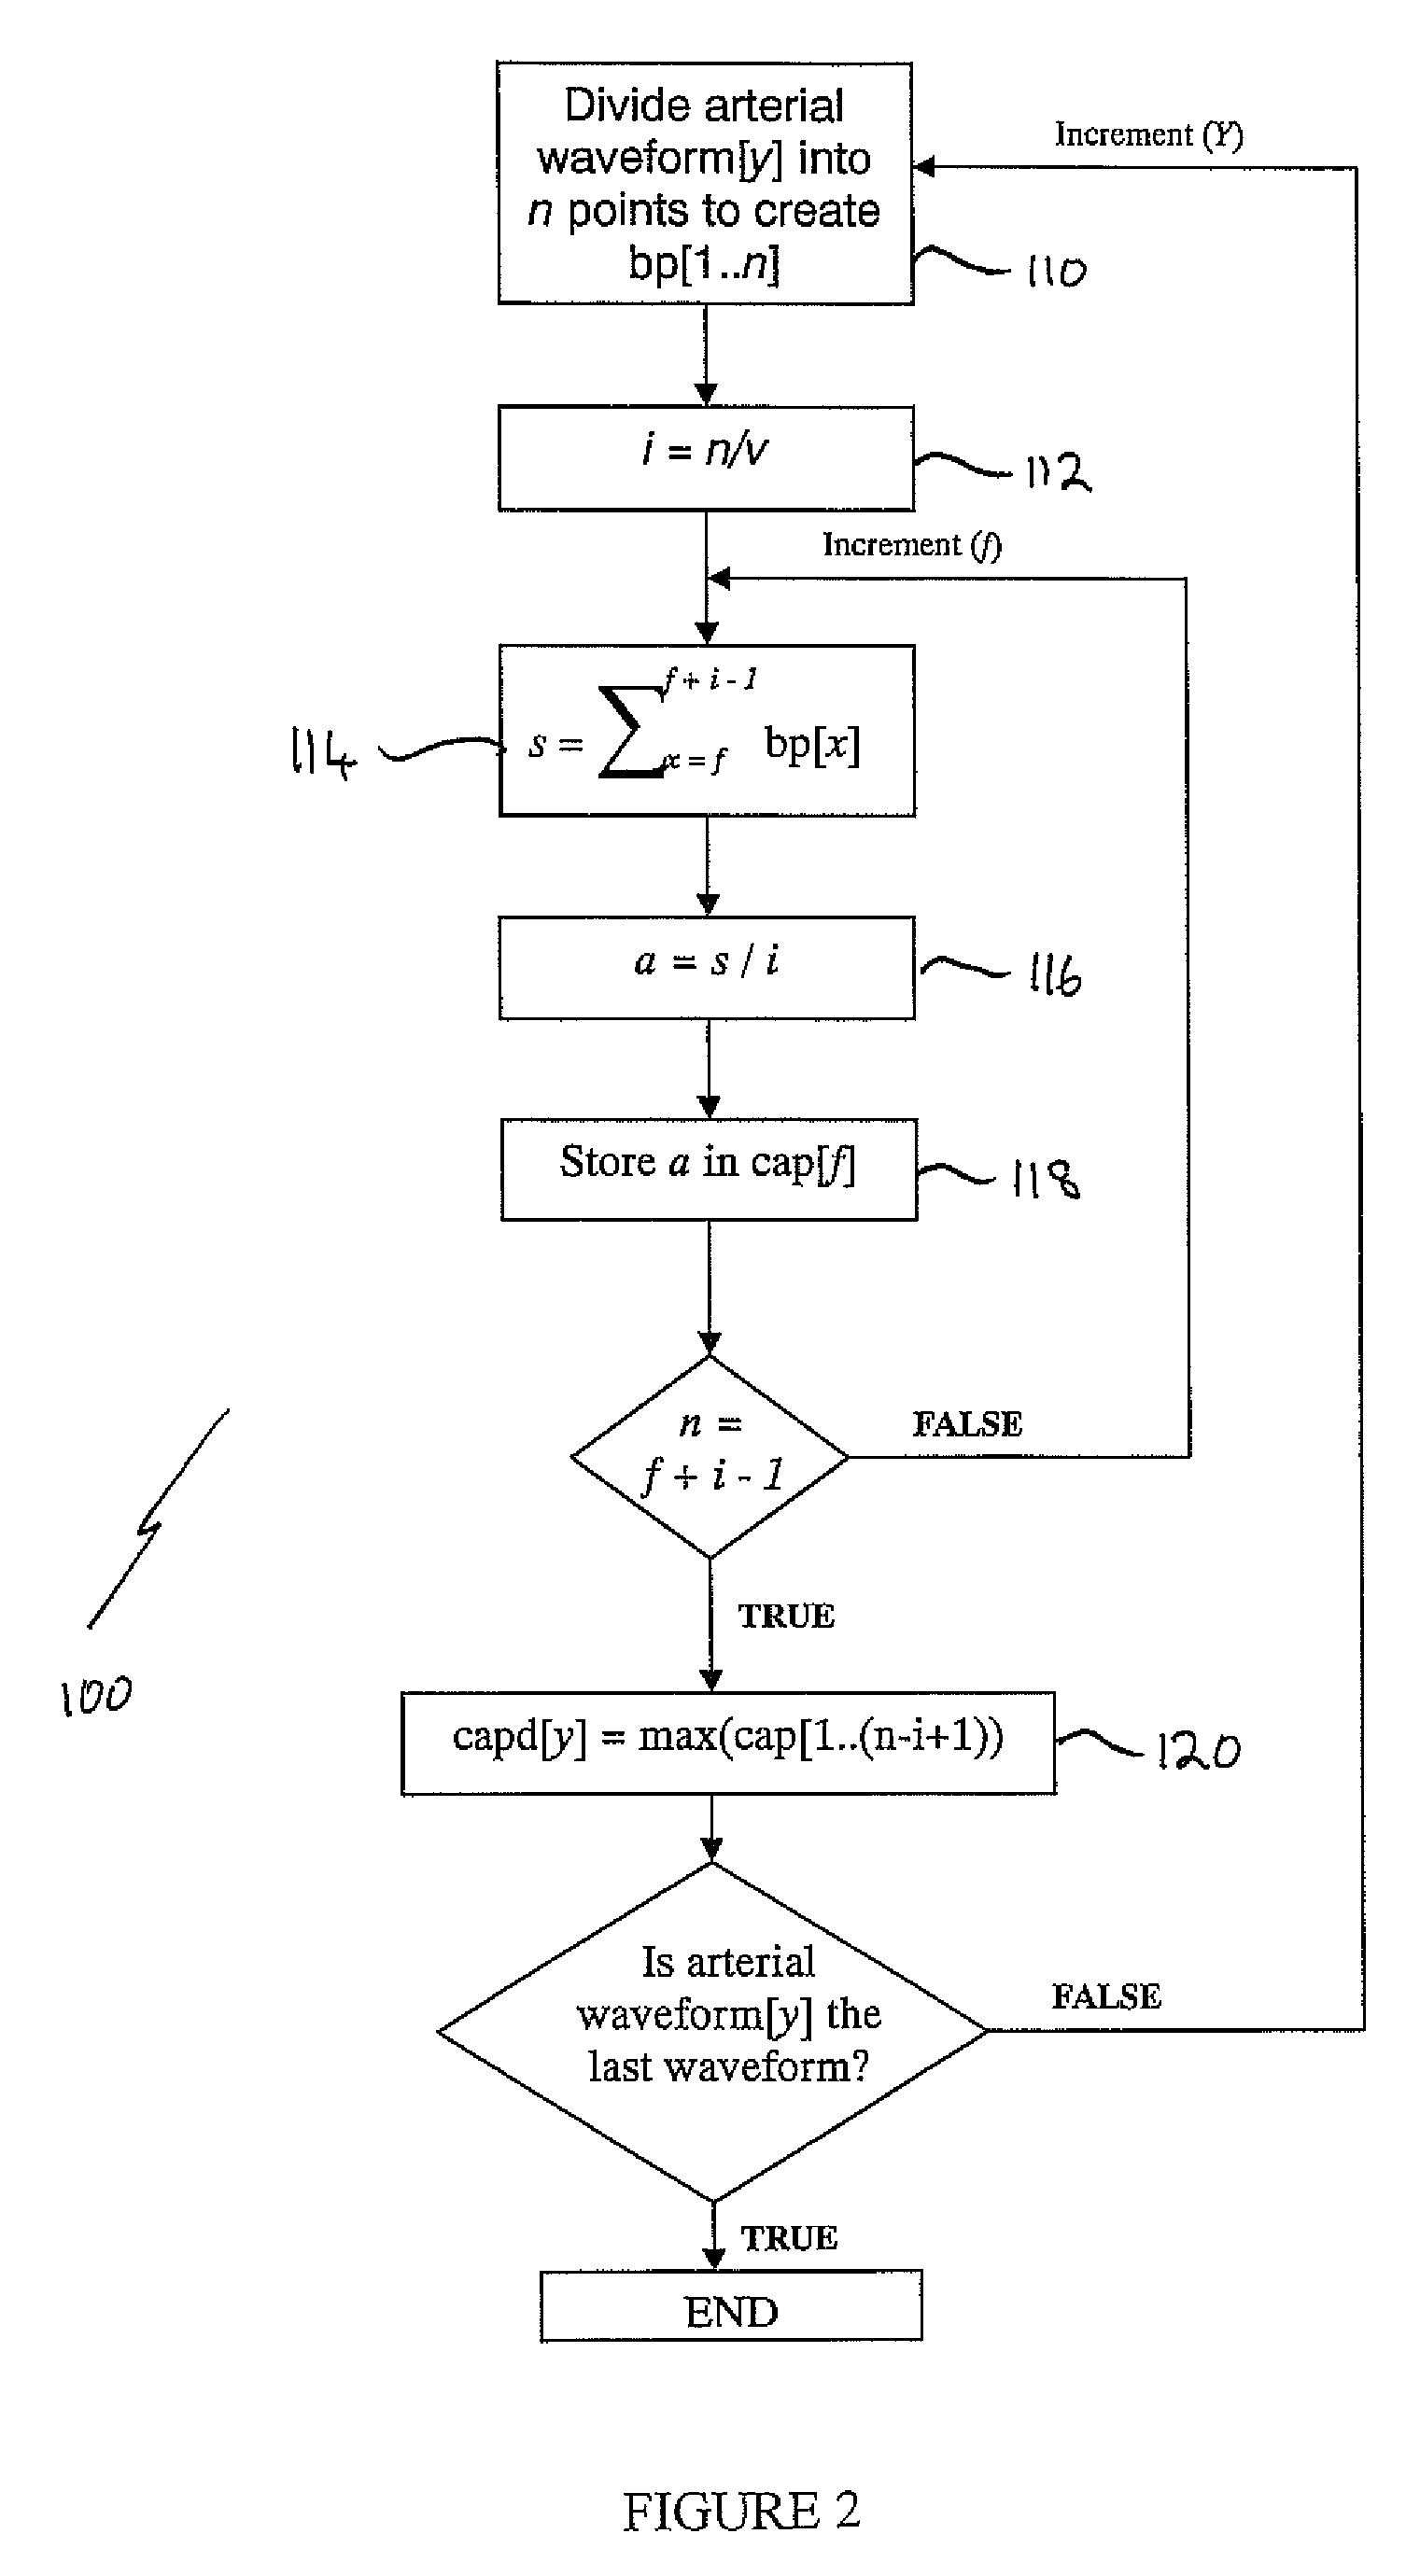
[0077]In accordance with the present invention there is a method of analyzing an arterial waveform dataset to produce a corresponding central aortic pressure dataset 100. A common precursor to this embodiment is that a medical professional obtains an arterial waveform representation of the blood pressure of a living body according to any technique as would be known to the person skilled in the art. This arterial waveform representation is then provided to a central processing station for determination of the corresponding central aortic pressure. Following receipt of the arterial waveform representation the central processing station operates as follows:
[0078]For each arterial waveform in the waveform dataset, a corresponding central aortic pressure value a is determined and stored in the central aortic pressure dataset according to the following process.
[0079]The arterial waveform 102 being processed is divided into a set of representative blood pressure measurements (step 110). Th...
third embodiment
[0087]In accordance with the invention, where like numerals reference like steps, there is a method of analyzing an arterial waveform dataset to produce a corresponding central aortic pressure dataset (not shown). This embodiment is based on experiments conducted by the applicant where it has been found that the n value can be any value in excess of 15.
[0088]In this embodiment, while it is preferred that the v value be 4 to determine an appropriate interval, a substantially accurate aortic pressure value has been able to be obtained where the interval value is in a range, the limits of which are determined as follows:
irange=n / (t×v)±(n / (t×30))
where in this embodiment, the variable t is representative of the duration of a single waveform (in seconds).
[0089]This embodiment will now be described in more detail in the context of the following example:
[0090]In accordance with step 12, a set of blood pressure measurements from a living body representative of an arterial waveform are create...
PUM
 Abstract
Description
Claims
Application Information
 - R&D
- Intellectual Property
- Life Sciences
- Materials
- Tech Scout
- Unparalleled Data Quality
- Higher Quality Content
- 60% Fewer Hallucinations
Browse by: Latest US Patents, China's latest patents, Technical Efficacy Thesaurus, Application Domain, Technology Topic, Popular Technical Reports.
© 2025 PatSnap. All rights reserved.Legal|Privacy policy|Modern Slavery Act Transparency Statement|Sitemap|About US| Contact US: help@patsnap.com


