Detection and quantification of stiction
a technology of stiction and quantification, which is applied in the direction of adaptive control, testing/monitoring control system, instruments, etc., can solve the problem that stiction cannot be easily detected, and achieve the effect of reducing the cost of control loop performance maintenan
- Summary
- Abstract
- Description
- Claims
- Application Information
AI Technical Summary
Benefits of technology
Problems solved by technology
Method used
Image
Examples
example 1
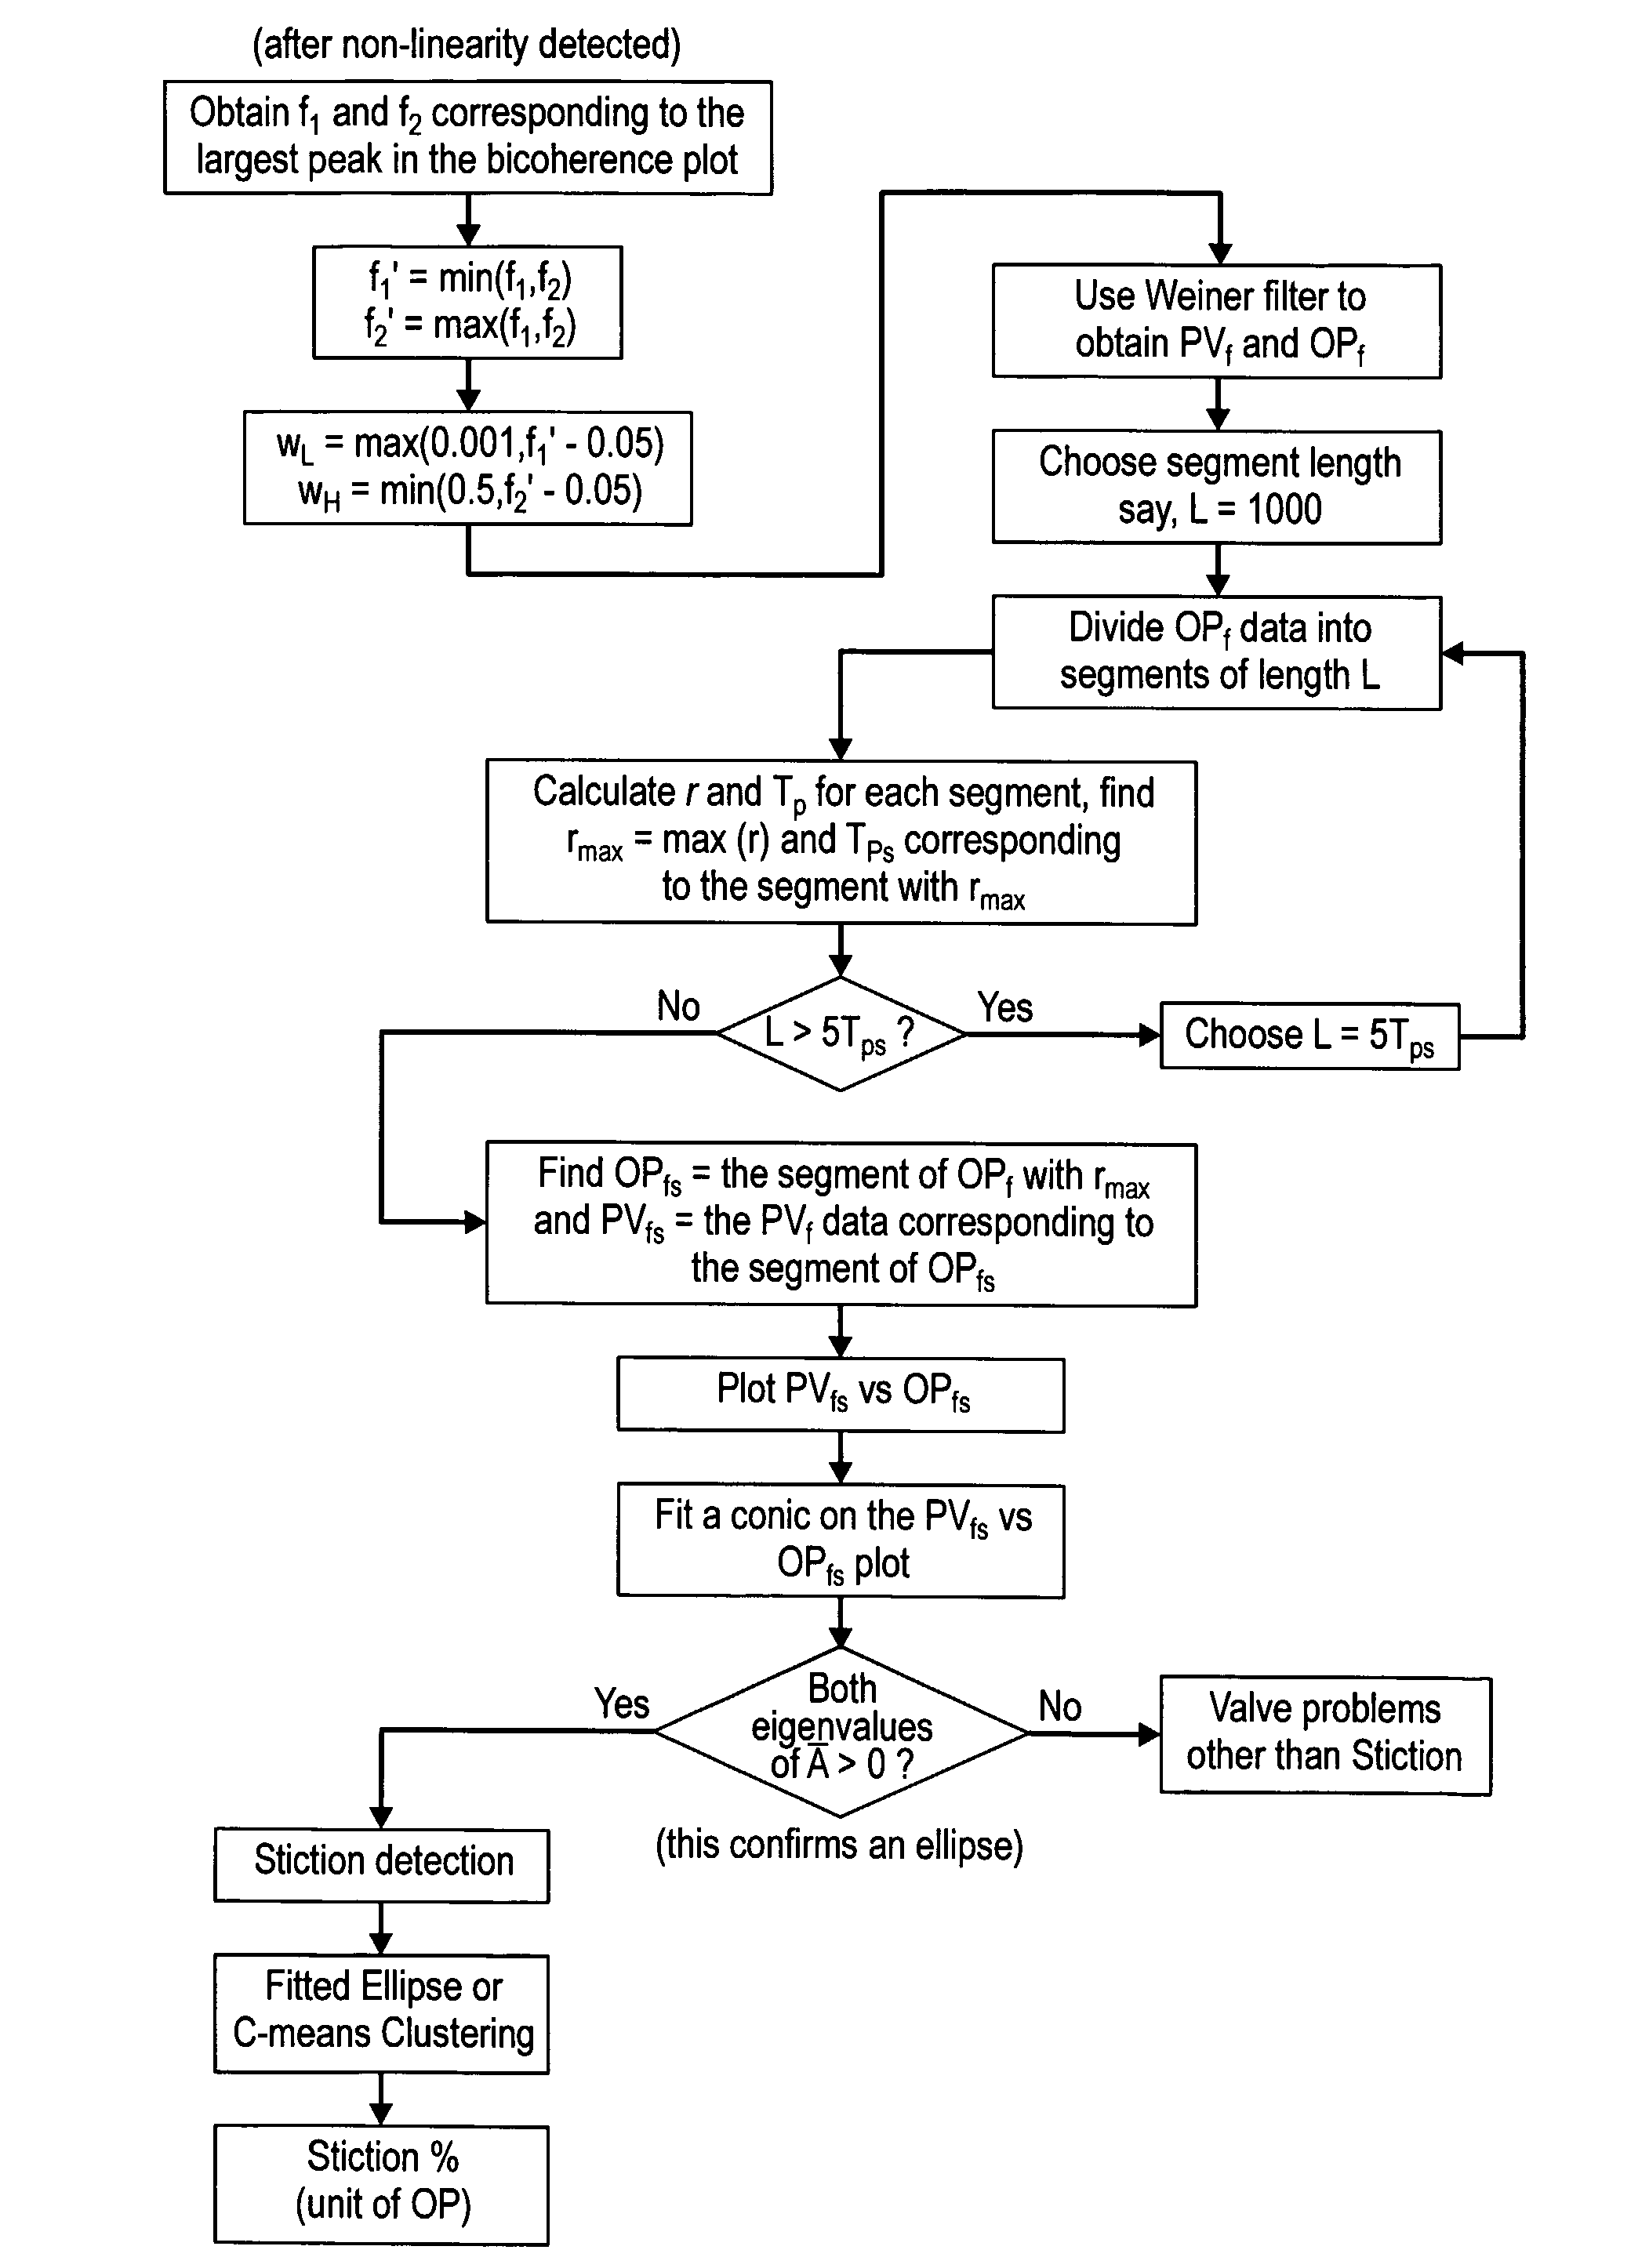
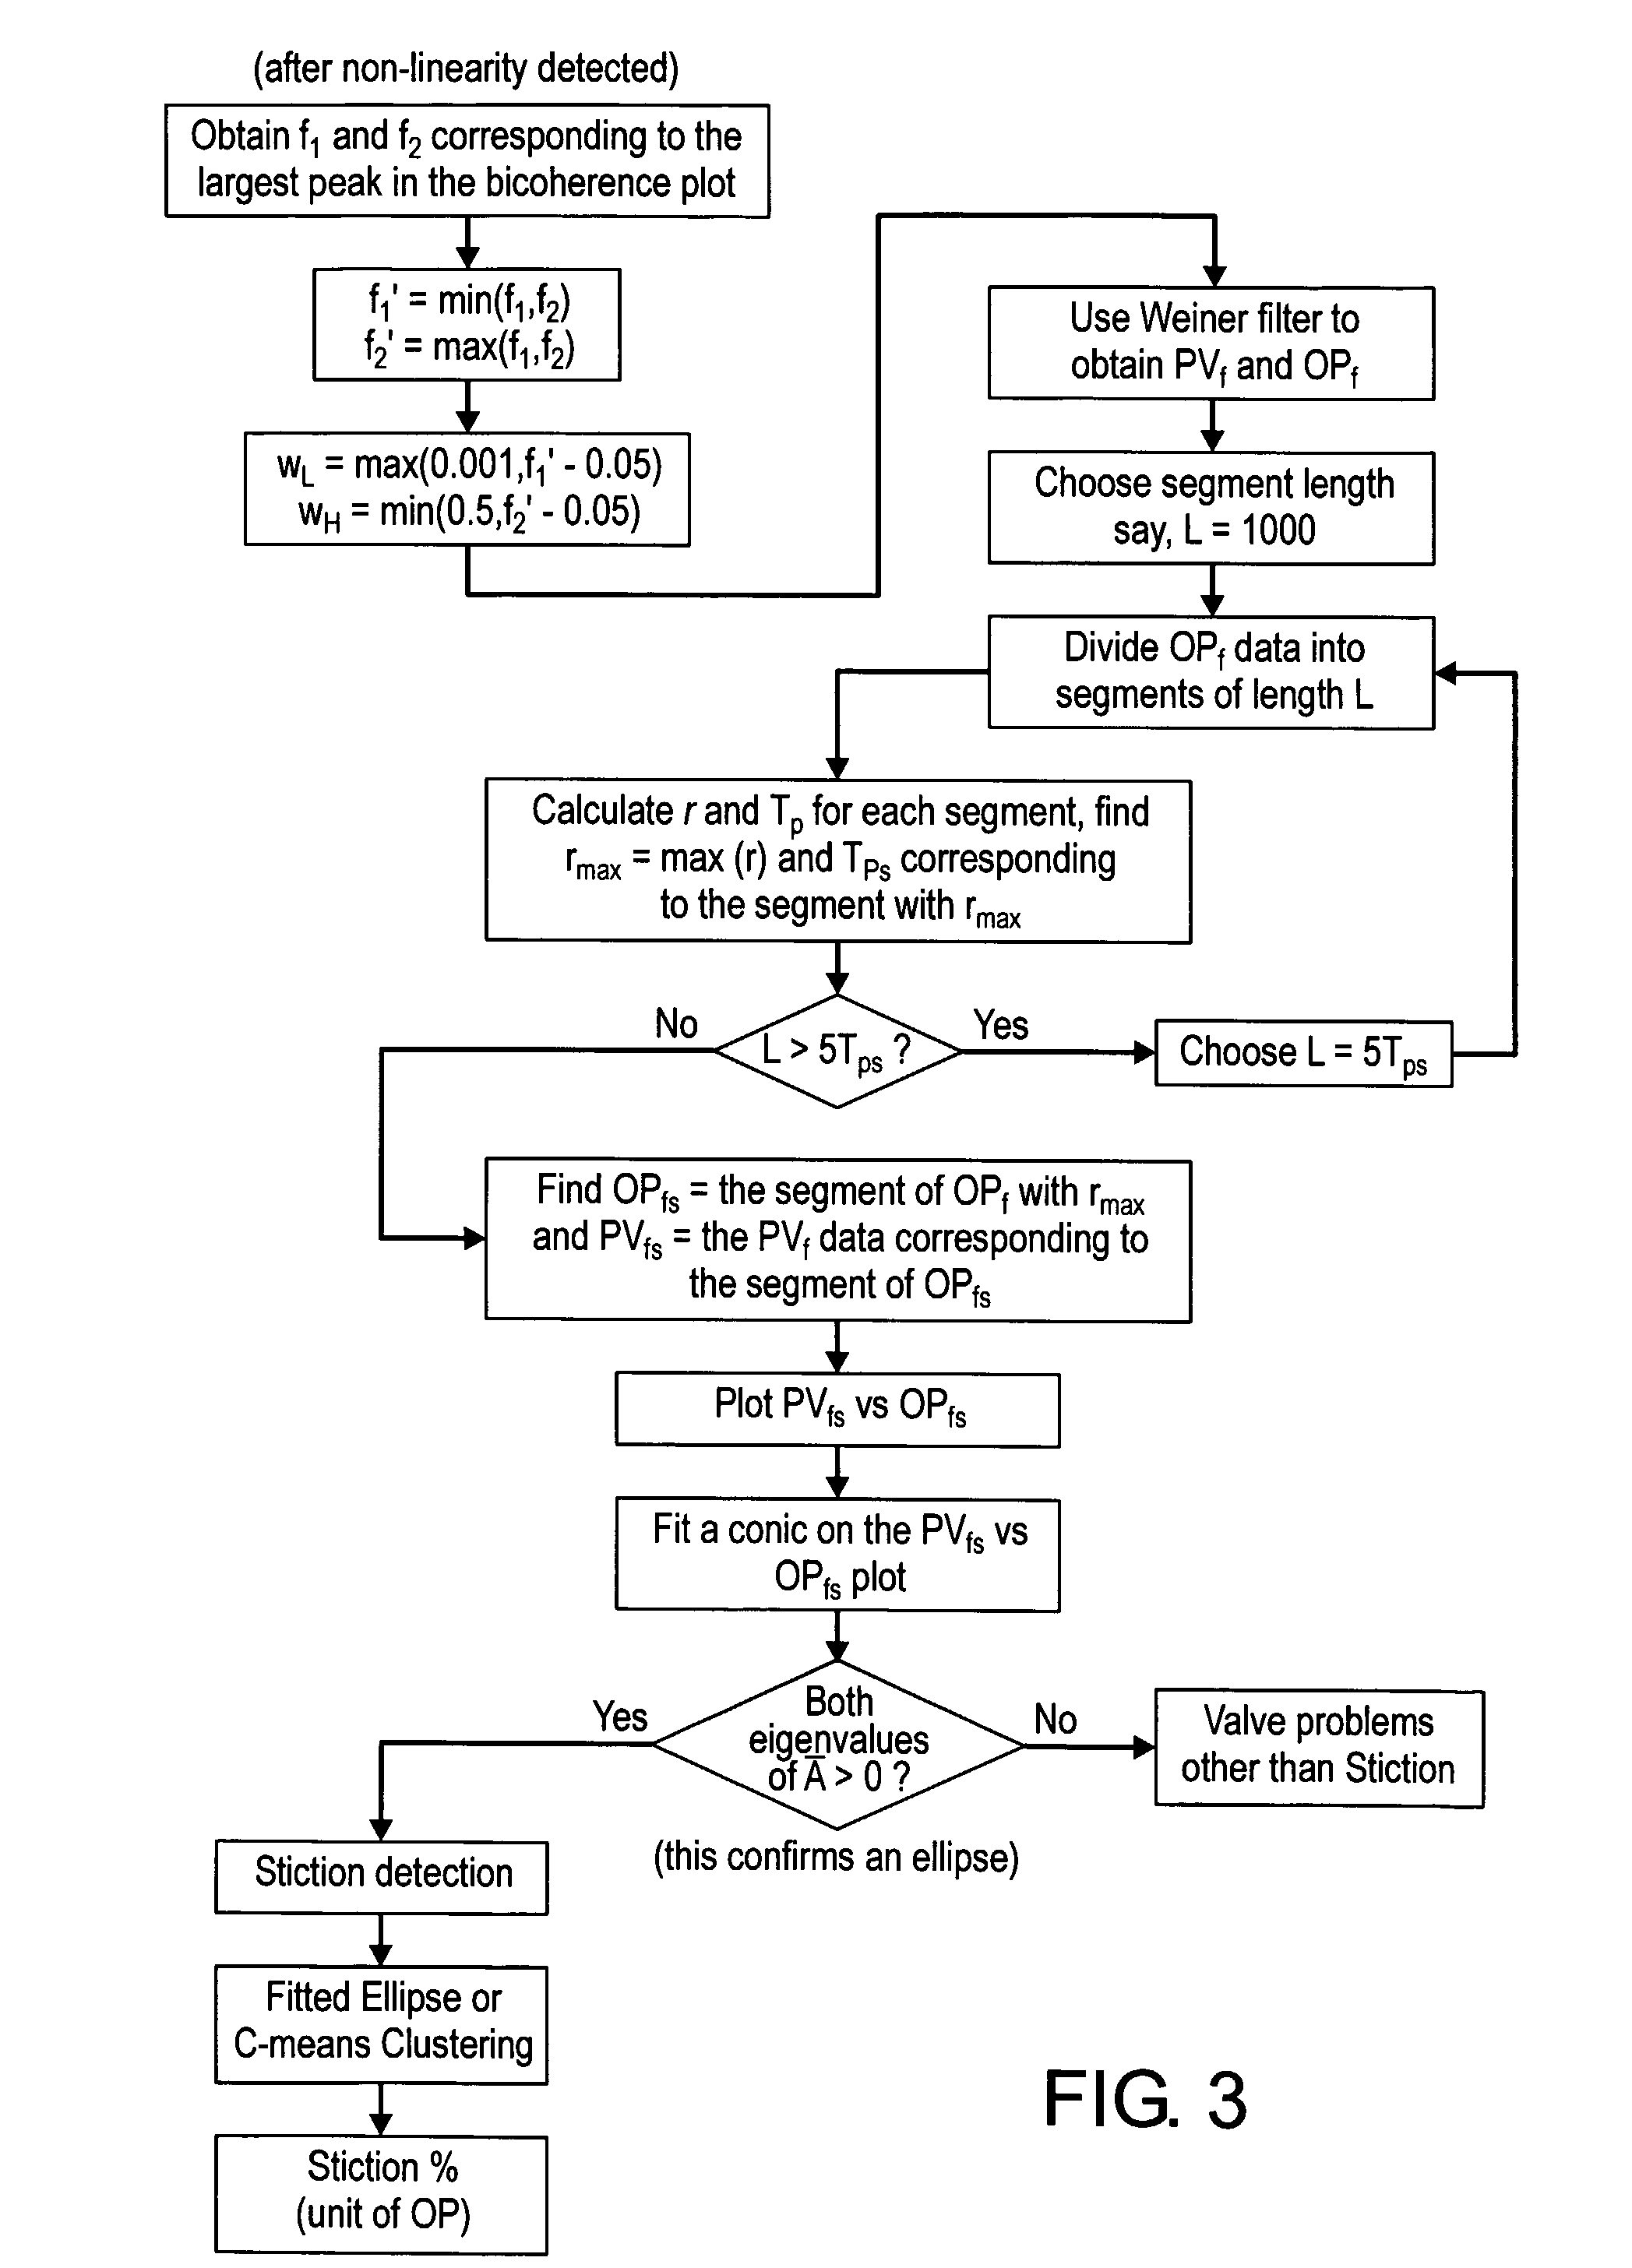
[0099]A first example represents a level control loop in a power plant, which controls the level in a condenser located at the outlet of a turbine by manipulating the flow rate of the liquid condensate from the condenser. In total 8640 samples for each tag were collected at a sampling rate of 5 s. FIG. 4(a) shows the time trends for level (pv), set point (sp) and the controller output (op). The loop shows oscillatory behavior. 4096 data points were used for the bicoherence calculation and FIG. 4(b) shows the squared bicoherence plot corresponding to the controller error signal (sp-pv). The values of NGI and NLI were found to be 0.04 and 0.61, respectively, indicating the presence of significant loop non-linearity. From the bicoherence plot in FIG. 4(b), it can be found that frequencies in the range 0.001 to 0.1 are the most significant frequencies of the signal that are responsible for non-linear interactions. Therefore, the pv and op signals were filtered using a Wiener filter with...
example 2
[0101]The applicability of the methods of the present invention for the detection and quantification of valve stiction were demonstrated by simulation through a known simulated case of stiction. A simple single-input, single-output (SISO) system in a feedback control configuration (FIG. 6) was used for generating simulated data. The first order process with time delay is given by the following transfer function:
[0102]G(z-1)=z-3(1.45-z-1)1-0.8z-1(9)
[0103]The process is operating under regulatory control with a PI controller. A random walk disturbance generated by passing random noise through an integrator was added to the process. The signal to noise ratio defined by the ratio of the variance of the controlled output (pv) to the variance of the random noise was 6. The simulation was performed for 6000 sampling intervals. To remove the effect of transients, the first few hundred data points were discarded and the last 4096 points of the error signal to the controller (sp-pv) were a...
example 3
[0105]Often times an unmeasured oscillatory disturbance, for example a sine wave, can initiate cycles in the controlled and manipulated variables and can often be misdiagnosed as a valve problem. This example illustrates the effect of a sinusoidal disturbance with amplitude 2 and frequency 0.01 when added to the process in addition to the noise (refer to FIG. 6). The stiction model was not used in the loop. So, the diagnosis results should show that there is no stiction or any other non-linearity. The time trend of the controlled variable (pv) in FIG. 8(a) shows the oscillatory behavior of the process output. Horch's cross-correlation test (Horch, 1999) shows an odd correlation function indicating possible valve stiction (see FIG. 8(b)). However, the higher order statistical test developed here shows that NGI equals 0 indicating a linear loop. The bicoherence plot for the error signal to the controller is shown in FIG. 8(c). The flatness of the bicoherence plot confirms the linearit...
PUM
 Abstract
Description
Claims
Application Information
 - R&D
- Intellectual Property
- Life Sciences
- Materials
- Tech Scout
- Unparalleled Data Quality
- Higher Quality Content
- 60% Fewer Hallucinations
Browse by: Latest US Patents, China's latest patents, Technical Efficacy Thesaurus, Application Domain, Technology Topic, Popular Technical Reports.
© 2025 PatSnap. All rights reserved.Legal|Privacy policy|Modern Slavery Act Transparency Statement|Sitemap|About US| Contact US: help@patsnap.com


