
Systems and methods for price and promotion response analysis

a price and promotion response and analysis system technology, applied in the field of price and promotion response analysis, can solve the problems of difficult forecasting costs, difficult forecasting costs, and difficult functions for forecasting demand, and achieve the effect of being easily configurable by the user

Inactive Publication Date: 2011-08-30
ACOUSTIC LP
View PDF83 Cites 219 Cited by
  • Summary
  • Abstract
  • Description
  • Claims
  • Application Information

AI Technical Summary

Benefits of technology

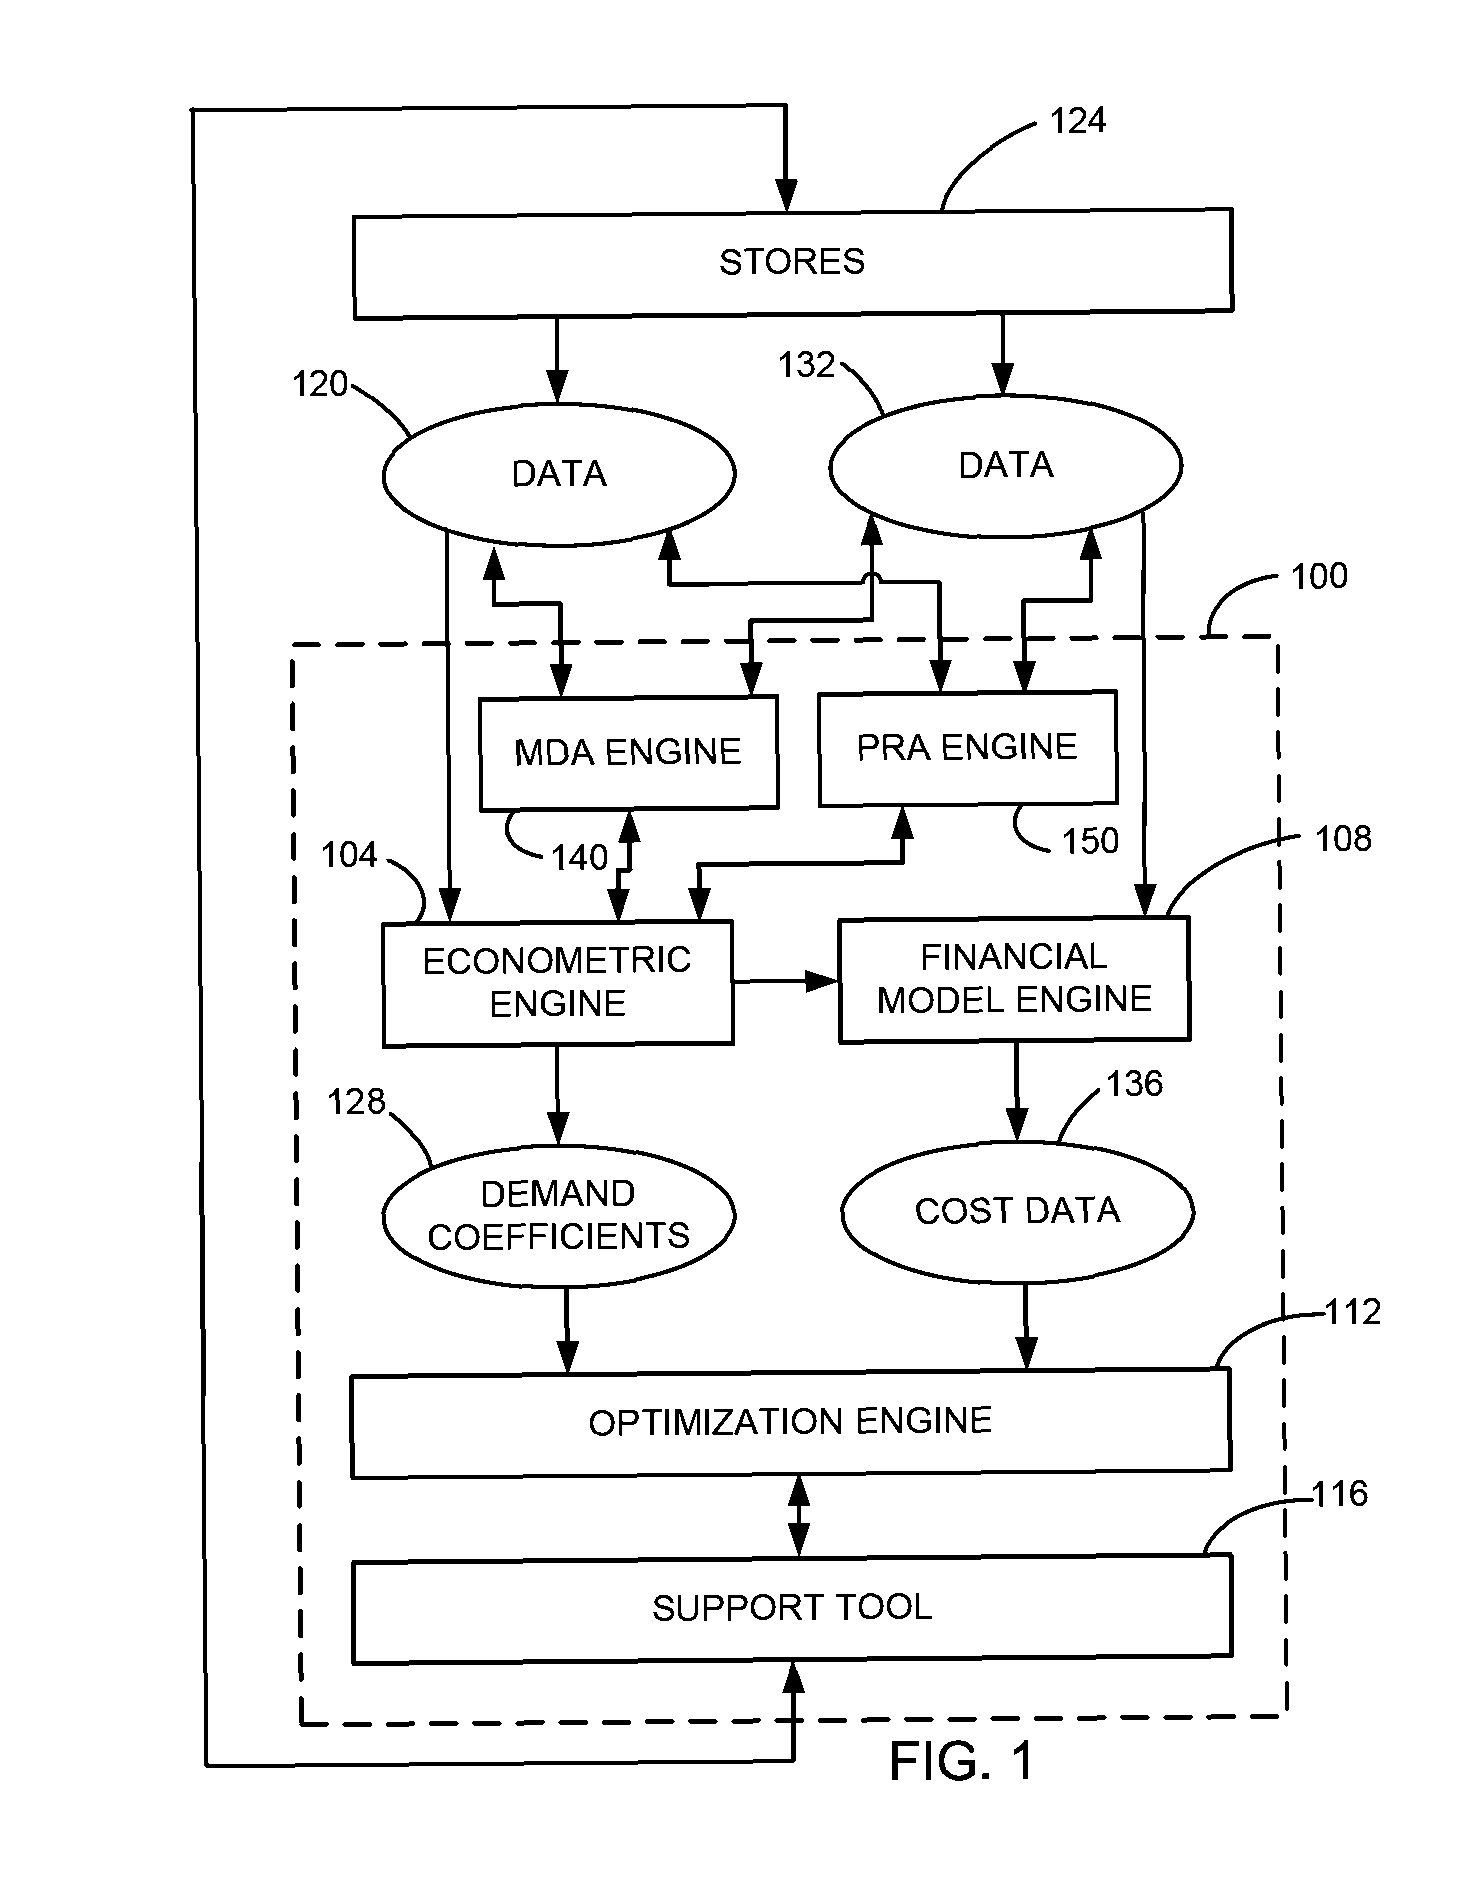
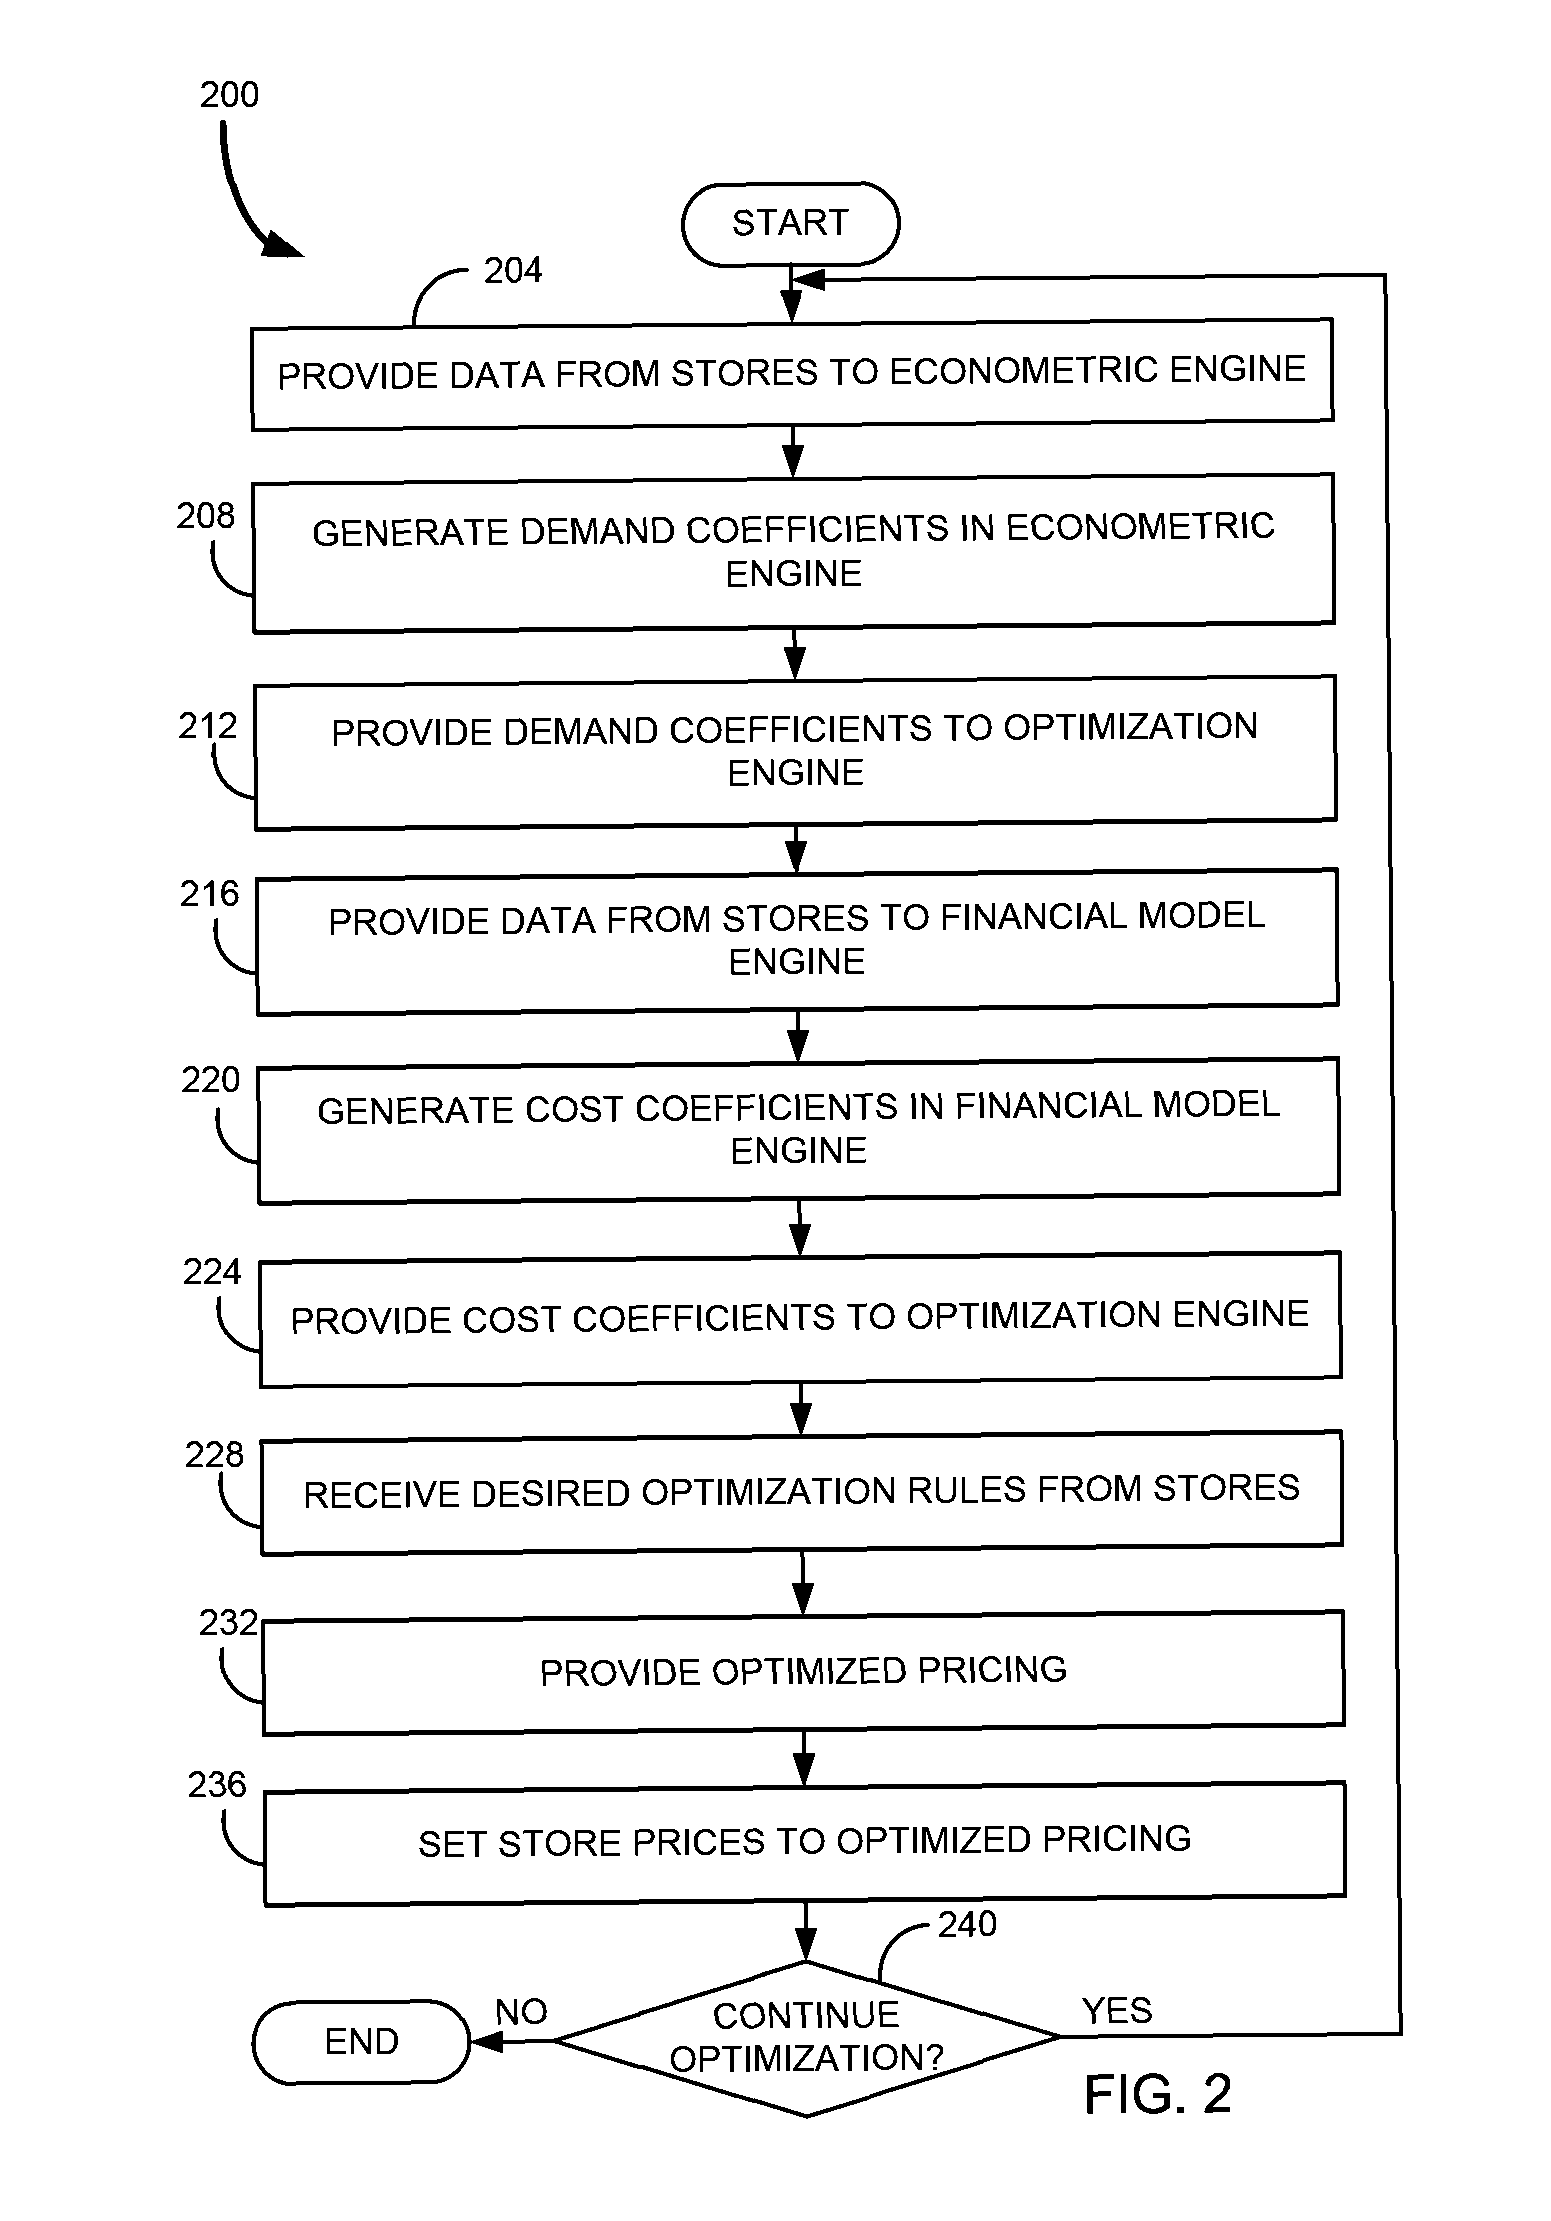
[0011]One advantage of the present invention is that the response analysis is readily configurable by the user, and provides consolidated and meaningful forecast data for business planning. The system for generating response data for a plurality of products in response to changes in pricing and promotions is useful in conjunction with a price optimization system.
[0012]The system first sets the configuration of the response report. The configuration includes price change and promotion change intervals. Promotions include at least one of temporary price reductions, displays, ads and multiples.
[0013]Then modeling data is received for the plurality of products. The modeling data is generated during product price optimization, or as a result of natural fluctuations in pricing and promotions.
[0014]Forecasts are then generated for the sales of the products dependent upon the price change and promotion change intervals. Forecasts include both non-cannibalistic and cannibalistic forecasts. Moreover, forecasts include at least one of product forecasts, demand group forecasts, line level forecasts and category level forecasts.
[0015]In some embodiments confidence matrices may be generated. Confidence matrices reflect accuracy of the generated forecasts. Confidence matrices include at least one of minimum and maximum price change, number of price changes, number of categorical price changes, temporary price reduction count, ad count, display count, and multiple count.
[0016]The response report may then be generated by collecting the forecasts and the confidence matrices according to the set configuration of the response report. Suspect forecasts, which include forecasts that have below a minimum level of confidence, may be flagged and excluded from the response report.

Problems solved by technology

As a result, the function for forecasting demand may be very complex.
As a result, the function for forecasting costs may be very complex.
For a chain of stores with tens of thousands of different products, forecasting costs and determining a function for forecasting demand are difficult.
Additionally, typical price optimization provides little information to the business manager as to what effect changes in price and promotional activity will have.
Moreover, little to no information is available as to the accuracy of the optimization forecasts.
This results in a gap in the business manager's strategic knowledge, thereby reducing the effectiveness of business planning.
Currently forecasts for changes in price, or price response, is very limited.
These forecasts, where available, typically lack confidence measurements or configurability.
Comparing different product base pricing is difficult in such systems.
Moreover, promotional response data is even more limited than price response data.
Such limited techniques for forecasting a range of price and promotional activity may greatly impede a business planner or manager's ability to effectively make business decisions, and are wholly inadequate to base business decisions upon as they do not provide confidence measurements.
For the typical business, the above systems are still too inaccurate, inaccessible, and intractable in order to be utilized effectively for price and promotion response analysis.
Thus, a typical business may not be able to effectively compile data for price and promotion response analysis.

Method used


Image

  • Systems and methods for price and promotion response analysis
  • Systems and methods for price and promotion response analysis
  • Systems and methods for price and promotion response analysis

Examples


Embodiment Construction

[0102]The present invention will now be described in detail with reference to several embodiments thereof as illustrated in the accompanying drawings. In the following description, numerous specific details are set forth in order to provide a thorough understanding of the present invention. It will be apparent, however, to one skilled in the art, that the present invention may be practiced without some or all of these specific details. In other instances, well known process steps and / or structures have not been described in detail in order to not unnecessarily obscure the present invention. The features and advantages of the present invention may be better understood with reference to the drawings and discussions that follow.

[0103]This invention relates generally to Price and Promotion Response Analysis (PRA) system and method to provide fast and efficient forecasts with price optimization systems for business planning More particularly, the present invention relates to a method for...


PUM


Abstract

A system and method for price and promotion response analysis is provided. Such a system is useful for a business to analyze the forecasted lifts associated with changes in price and promotion activity. The system sets the configuration of the response report, which includes price change and promotion change intervals. Promotions include temporary price reductions, displays, ads and multiples. Modeling data is received for the products. Forecasts, both non-cannibalistic and cannibalistic, are generated for the sales of the products dependent upon the price change and promotion change intervals. Forecasts include at least one of product forecasts, demand group forecasts, line level forecasts and category level forecasts. Suspect forecasts below a minimum confidence may be flagged. Confidence matrices may be generated which reflect accuracy of the forecasts. The response report may be generated by collecting the forecasts and the confidence matrices according to the configuration of the response report.

Description

CROSS REFERENCE TO RELATED APPLICATIONS[0001]This is a continuation-in-part of co-pending U.S. application Ser. No. 09 / 741,959 filed on Dec. 22, 2000, entitled “Econometric Optimization Engine”, which is hereby fully incorporated by reference.BACKGROUND OF THE INVENTION[0002]This invention relates generally to Price and Promotion Response Analysis (PRA) system and method to provide fast and efficient forecasts with price optimization systems for business planning. More particularly, the present invention relates to a method for analyzing historic sales data in conjunction with modeling data to forecast product sales and profits under various price and promotion conditions for the purpose of detailed business planning.[0003]For businesses, prices of various products need to be set. These prices may be set with the goal of maximizing profit or demand or for a variety of other objectives. Traditionally price setting may be performed by experienced business managers, by comparison to co...

Claims


Application Information

Patent Timeline
IPC IPC(8): G06Q10/00
CPCG06Q30/02G06Q30/0201G06Q30/0242
Inventor WU, HOWARD YIHZANKERVIN, SEANGUNNINK, JASON LEEVALENTINE, SUZANNE NOELDESAI, PARITOSH
Owner ACOUSTIC LP
Learn More