
Generating an operational definition of baseline for monitoring network traffic data

a network traffic and baseline value technology, applied in the field of network and application management of computer networks, can solve the problems of very difficult, very complex computer networks of today, and the baseline value obtained by using this sample mean can be very misleading

Active Publication Date: 2011-06-14
NETSCOUT SYSTEMS
View PDF7 Cites 12 Cited by
  • Summary
  • Abstract
  • Description
  • Claims
  • Application Information

AI Technical Summary

Benefits of technology

The patent describes a system and method for creating a baseline and identifying specific data ranges that trigger alarms. The system collects and analyzes historical data, grouping it into smaller units and identifying patterns in the data. These patterns are then used to predict a baseline and the expected data ranges. This allows for more accurate detection of abnormal data. The technical effect of this invention is improved accuracy and efficiency in detecting and responding to abnormal data patterns.

Problems solved by technology

Today's computer networks are extremely complex with hundreds of applications, thousands of servers, hundreds of locations, hundreds of thousands of clients and traffic routed by numerous switches and routers on local area networks (LANs) and wide area networks (WANs).
However, it also becomes very difficult because there is no commonly accepted operational definition of the baseline of a given measure.
In other words, the baseline value obtained by using this sample mean can be very misleading (e.g., inaccurate), and an inner band and outer band based on the sample mean and sample variance may become meaningless due to an unknown sample data distribution with a large variance of the network traffic measure.

Method used


Image

  • Generating an operational definition of baseline for monitoring network traffic data
  • Generating an operational definition of baseline for monitoring network traffic data
  • Generating an operational definition of baseline for monitoring network traffic data

Examples


Embodiment Construction

[0018]The Figures and the following description relate to preferred embodiments of the present invention by way of illustration only. It should be noted that from the following discussion, alternative embodiments of the structures and methods disclosed herein will be readily recognized as viable alternatives that may be employed without departing from the principles of the claimed invention.

[0019]Reference will now be made in detail to several embodiments, examples of which are illustrated in the accompanying figures. It is noted that wherever practicable similar or like reference numbers may be used in the figures and may indicate similar or like functionality. The figures depict embodiments of the present invention for purposes of illustration only. One skilled in the art will readily recognize from the following description that alternative embodiments of the structures and methods illustrated herein may be employed without departing from the principles described herein.

[0020]Emb...


PUM


Abstract

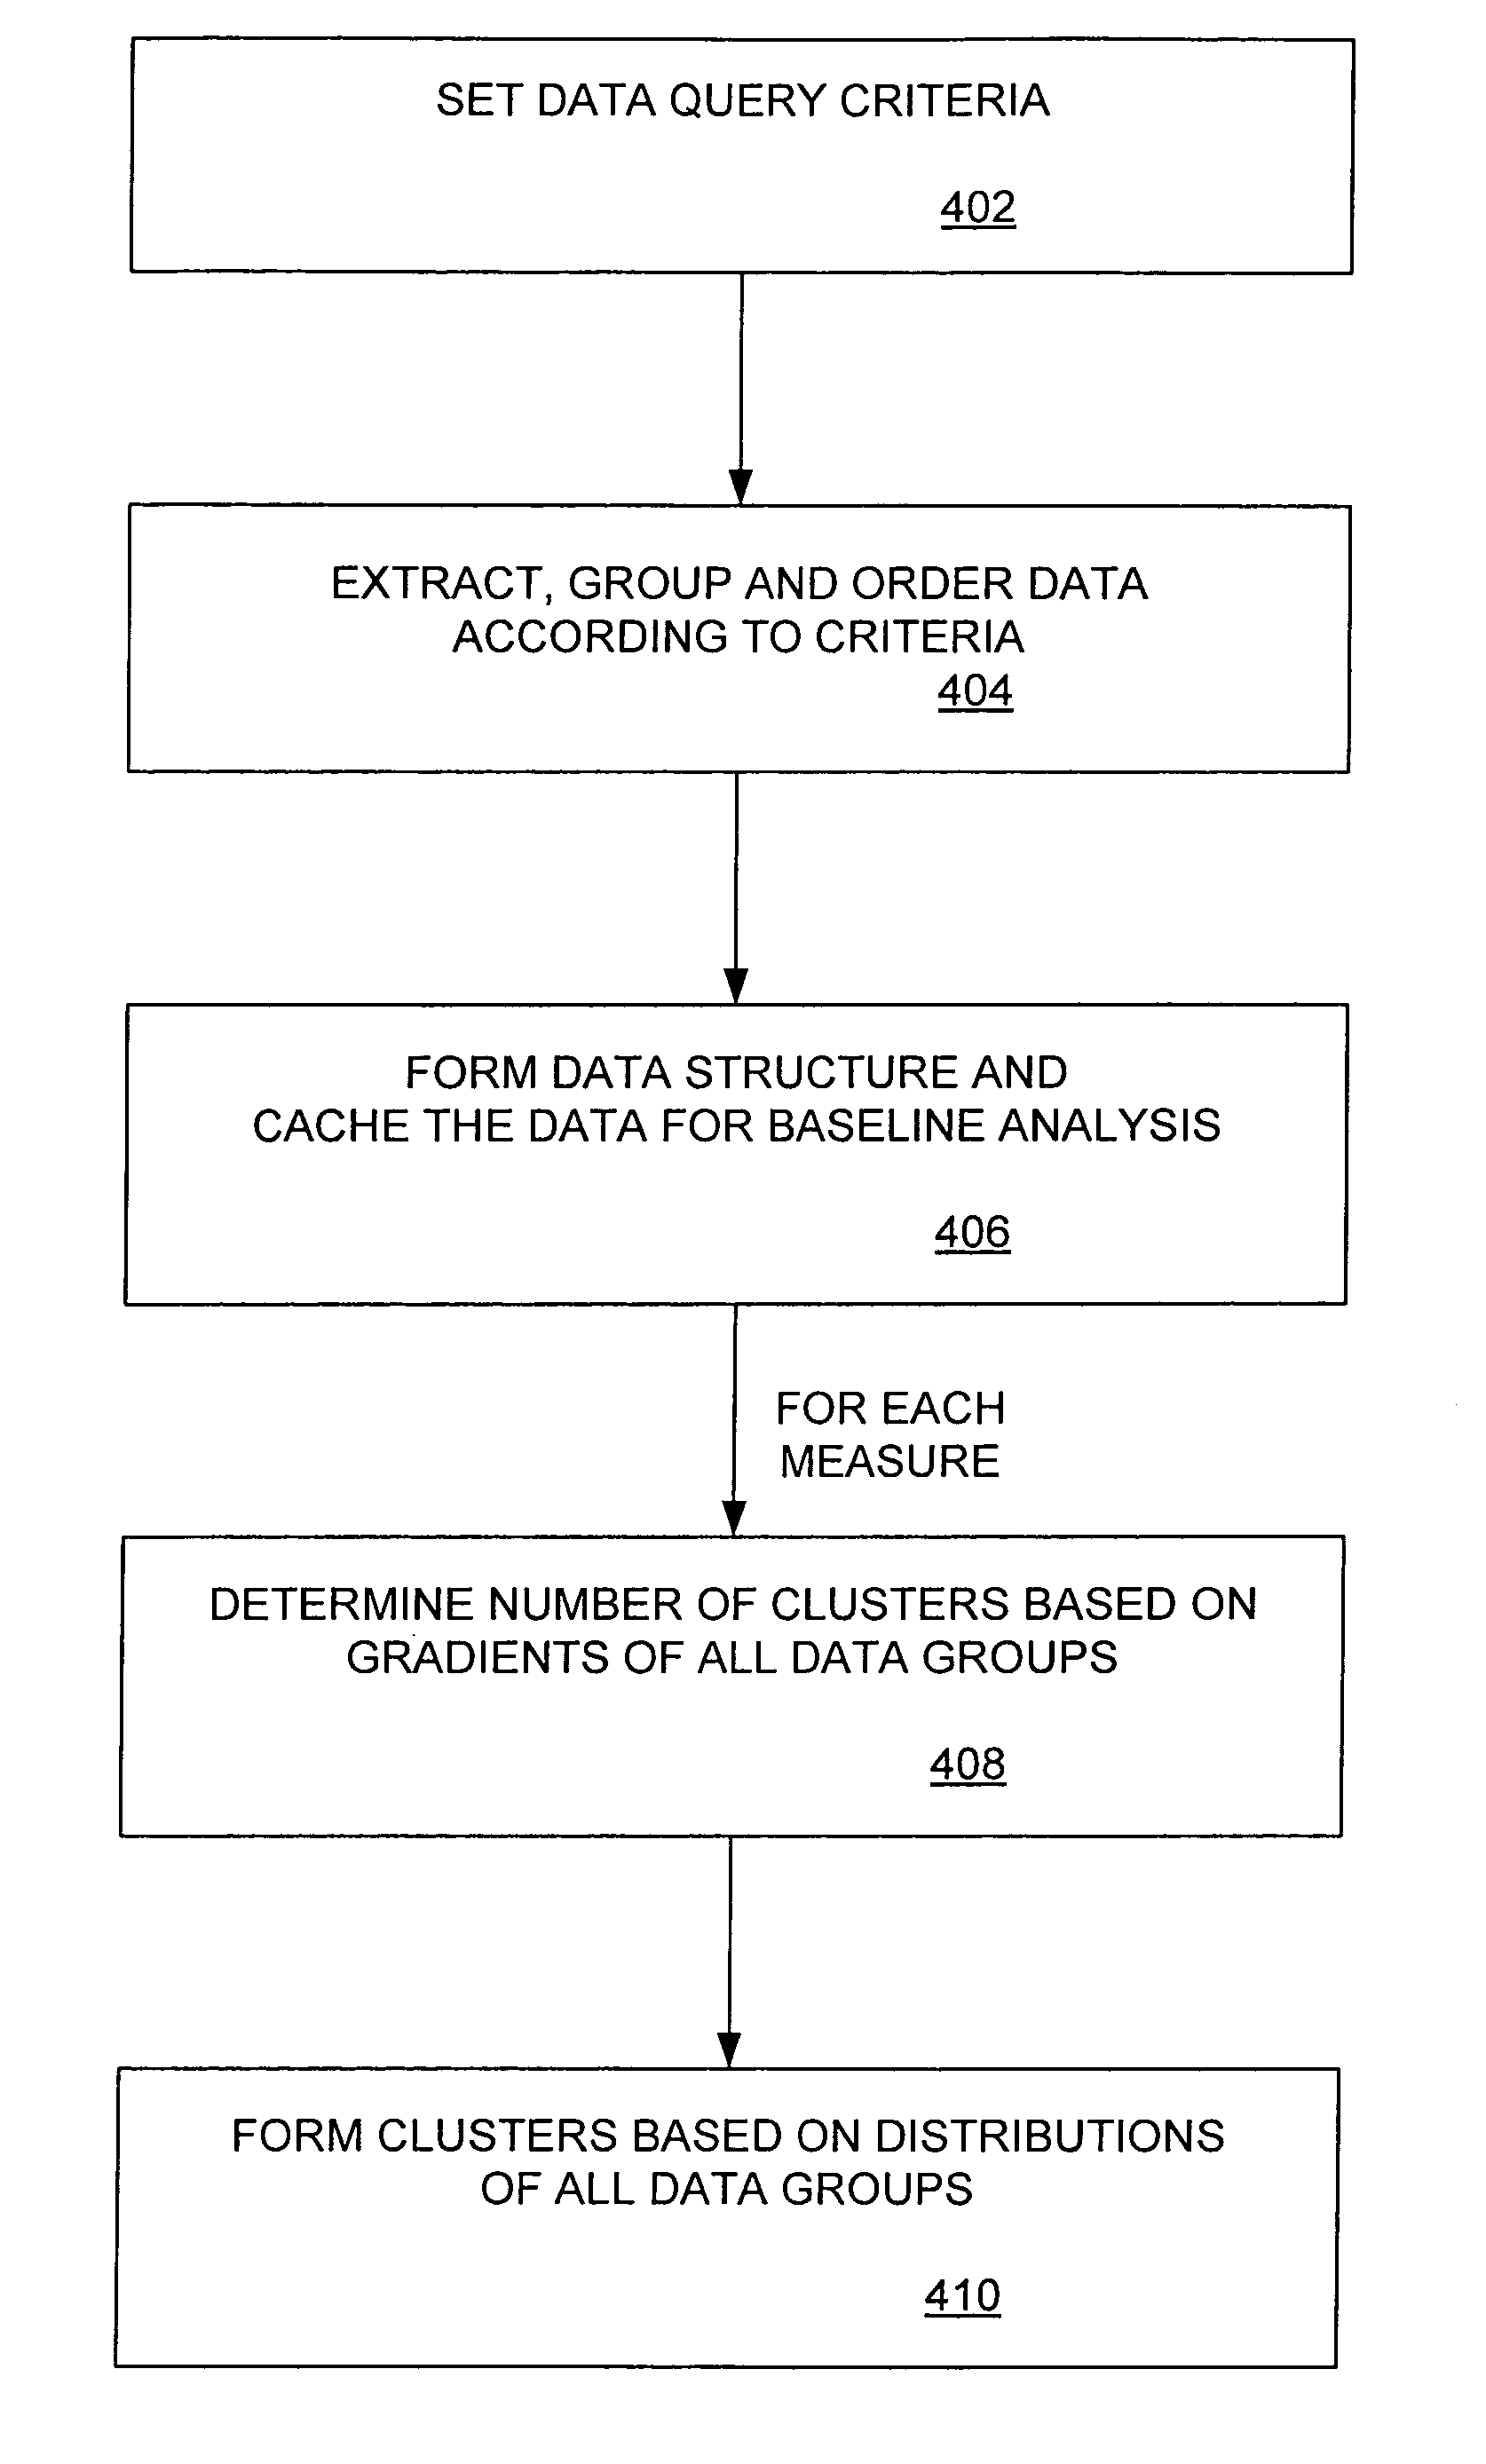
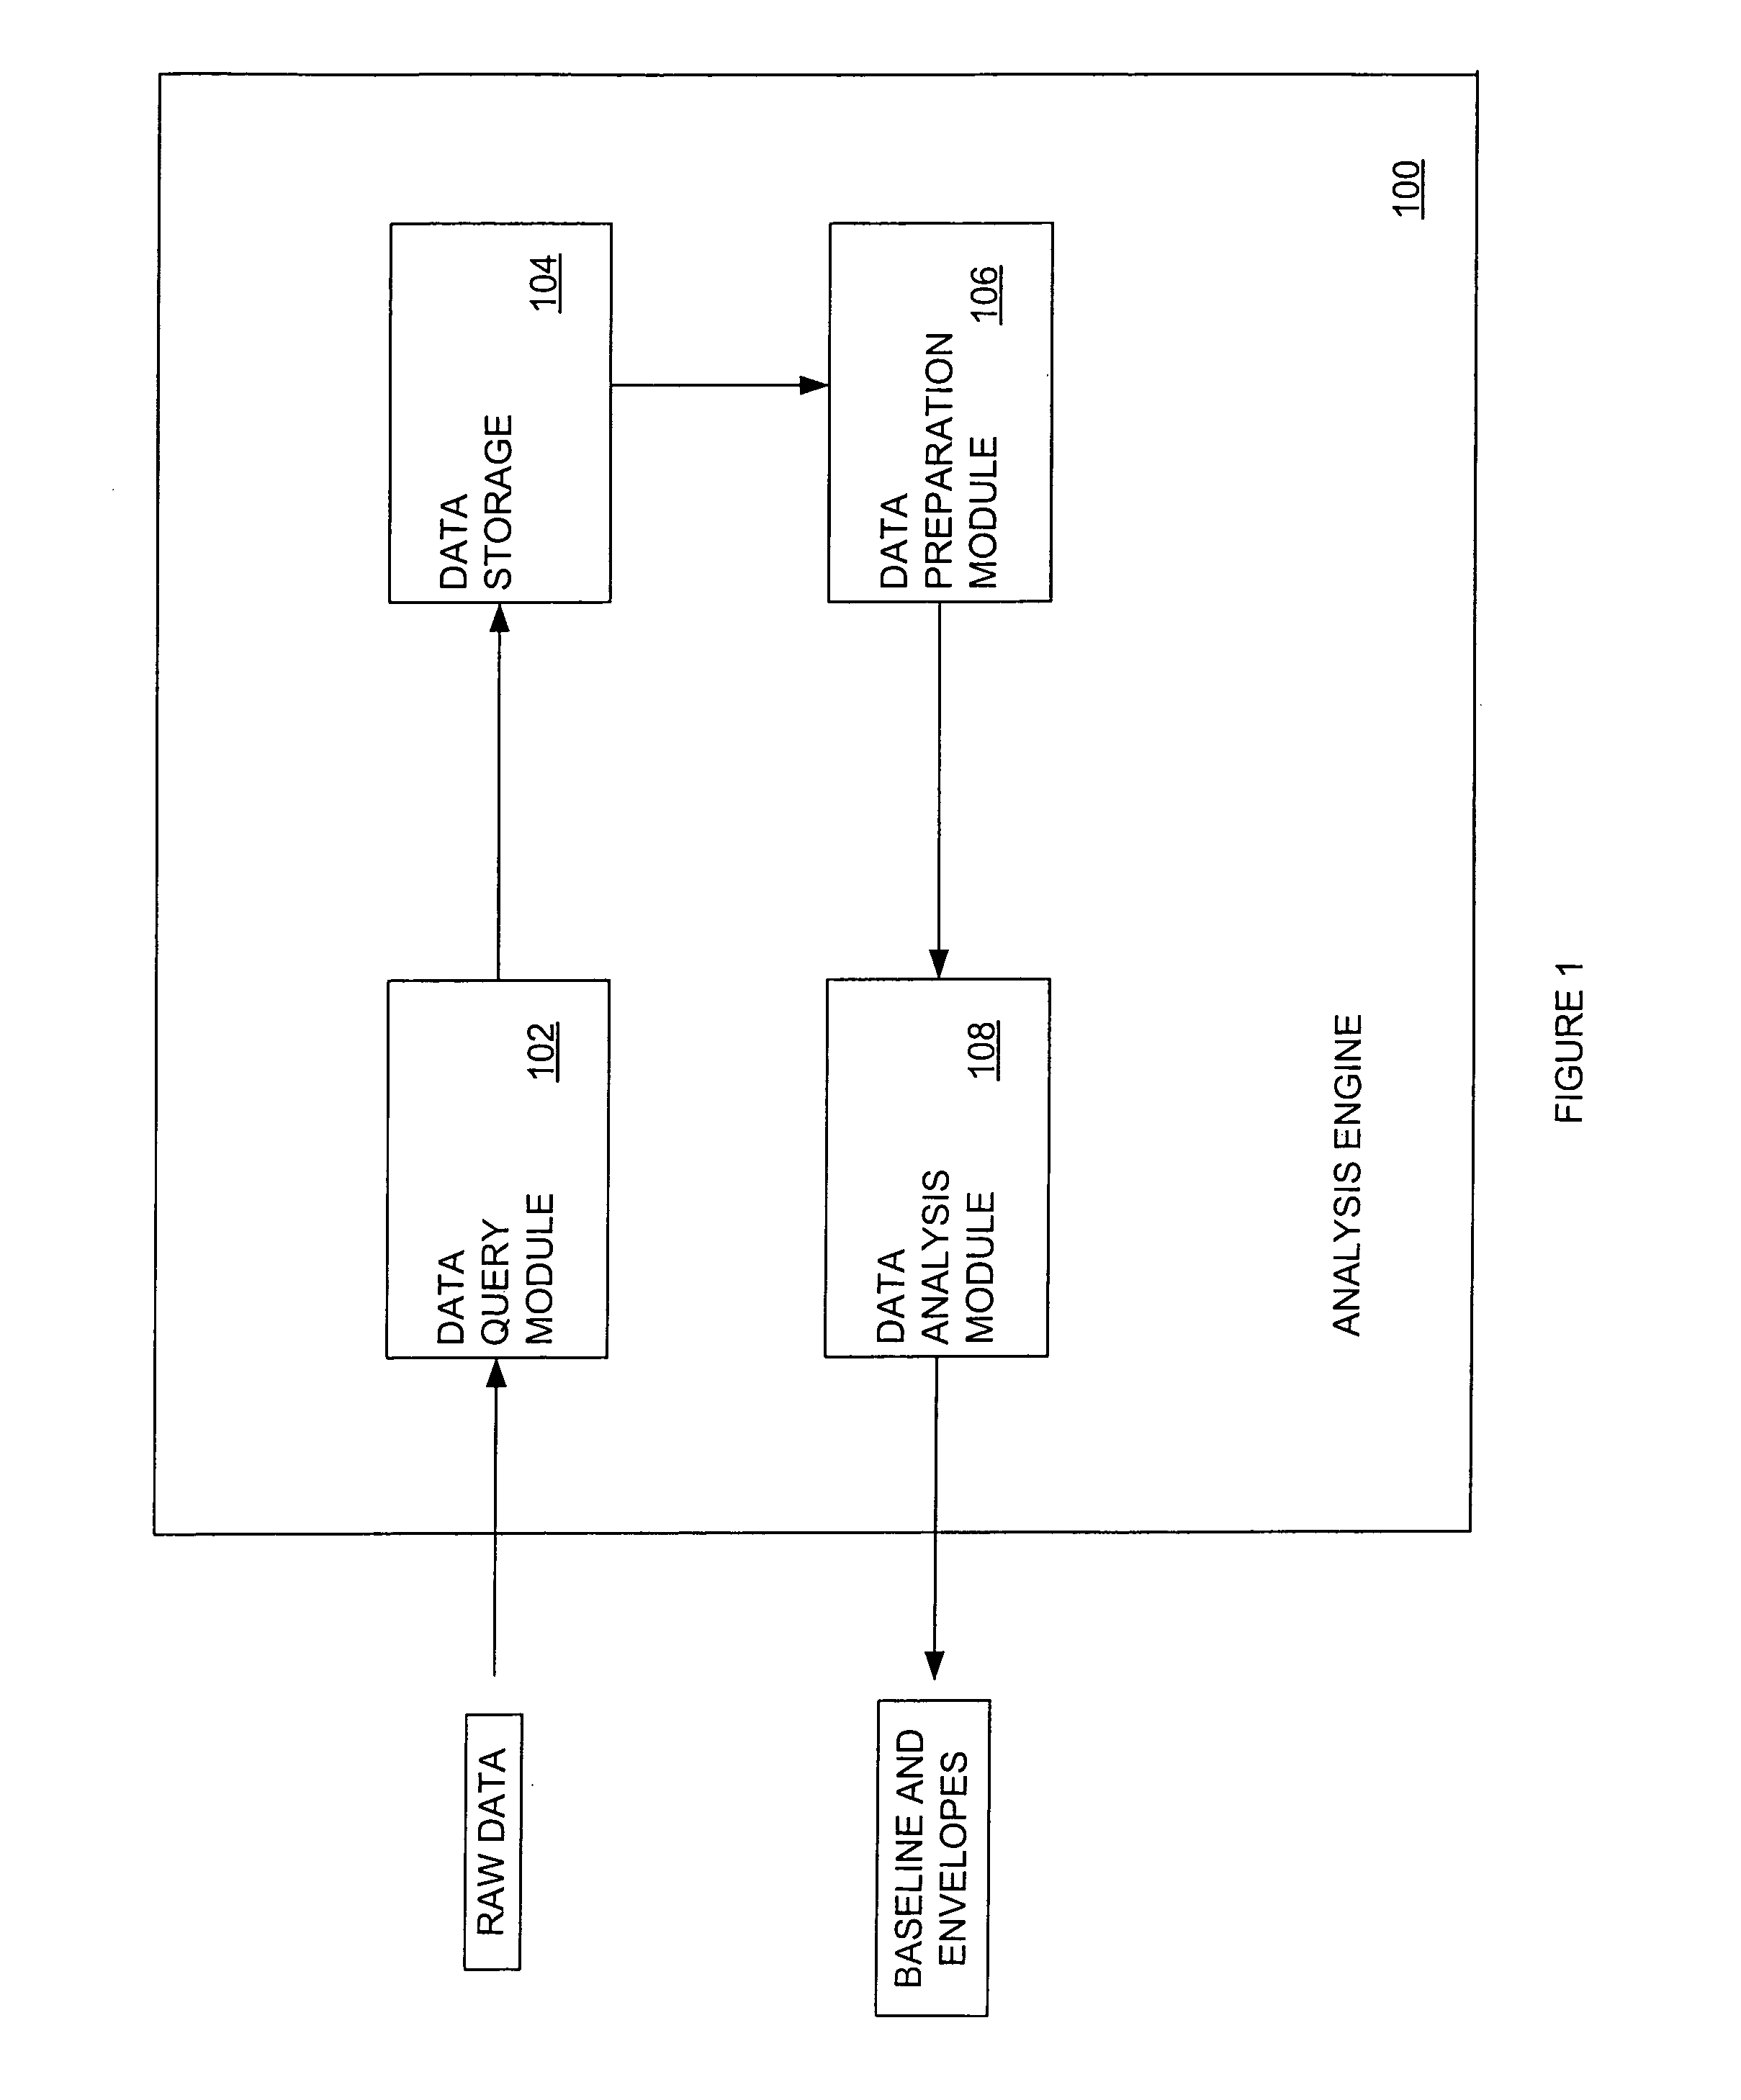
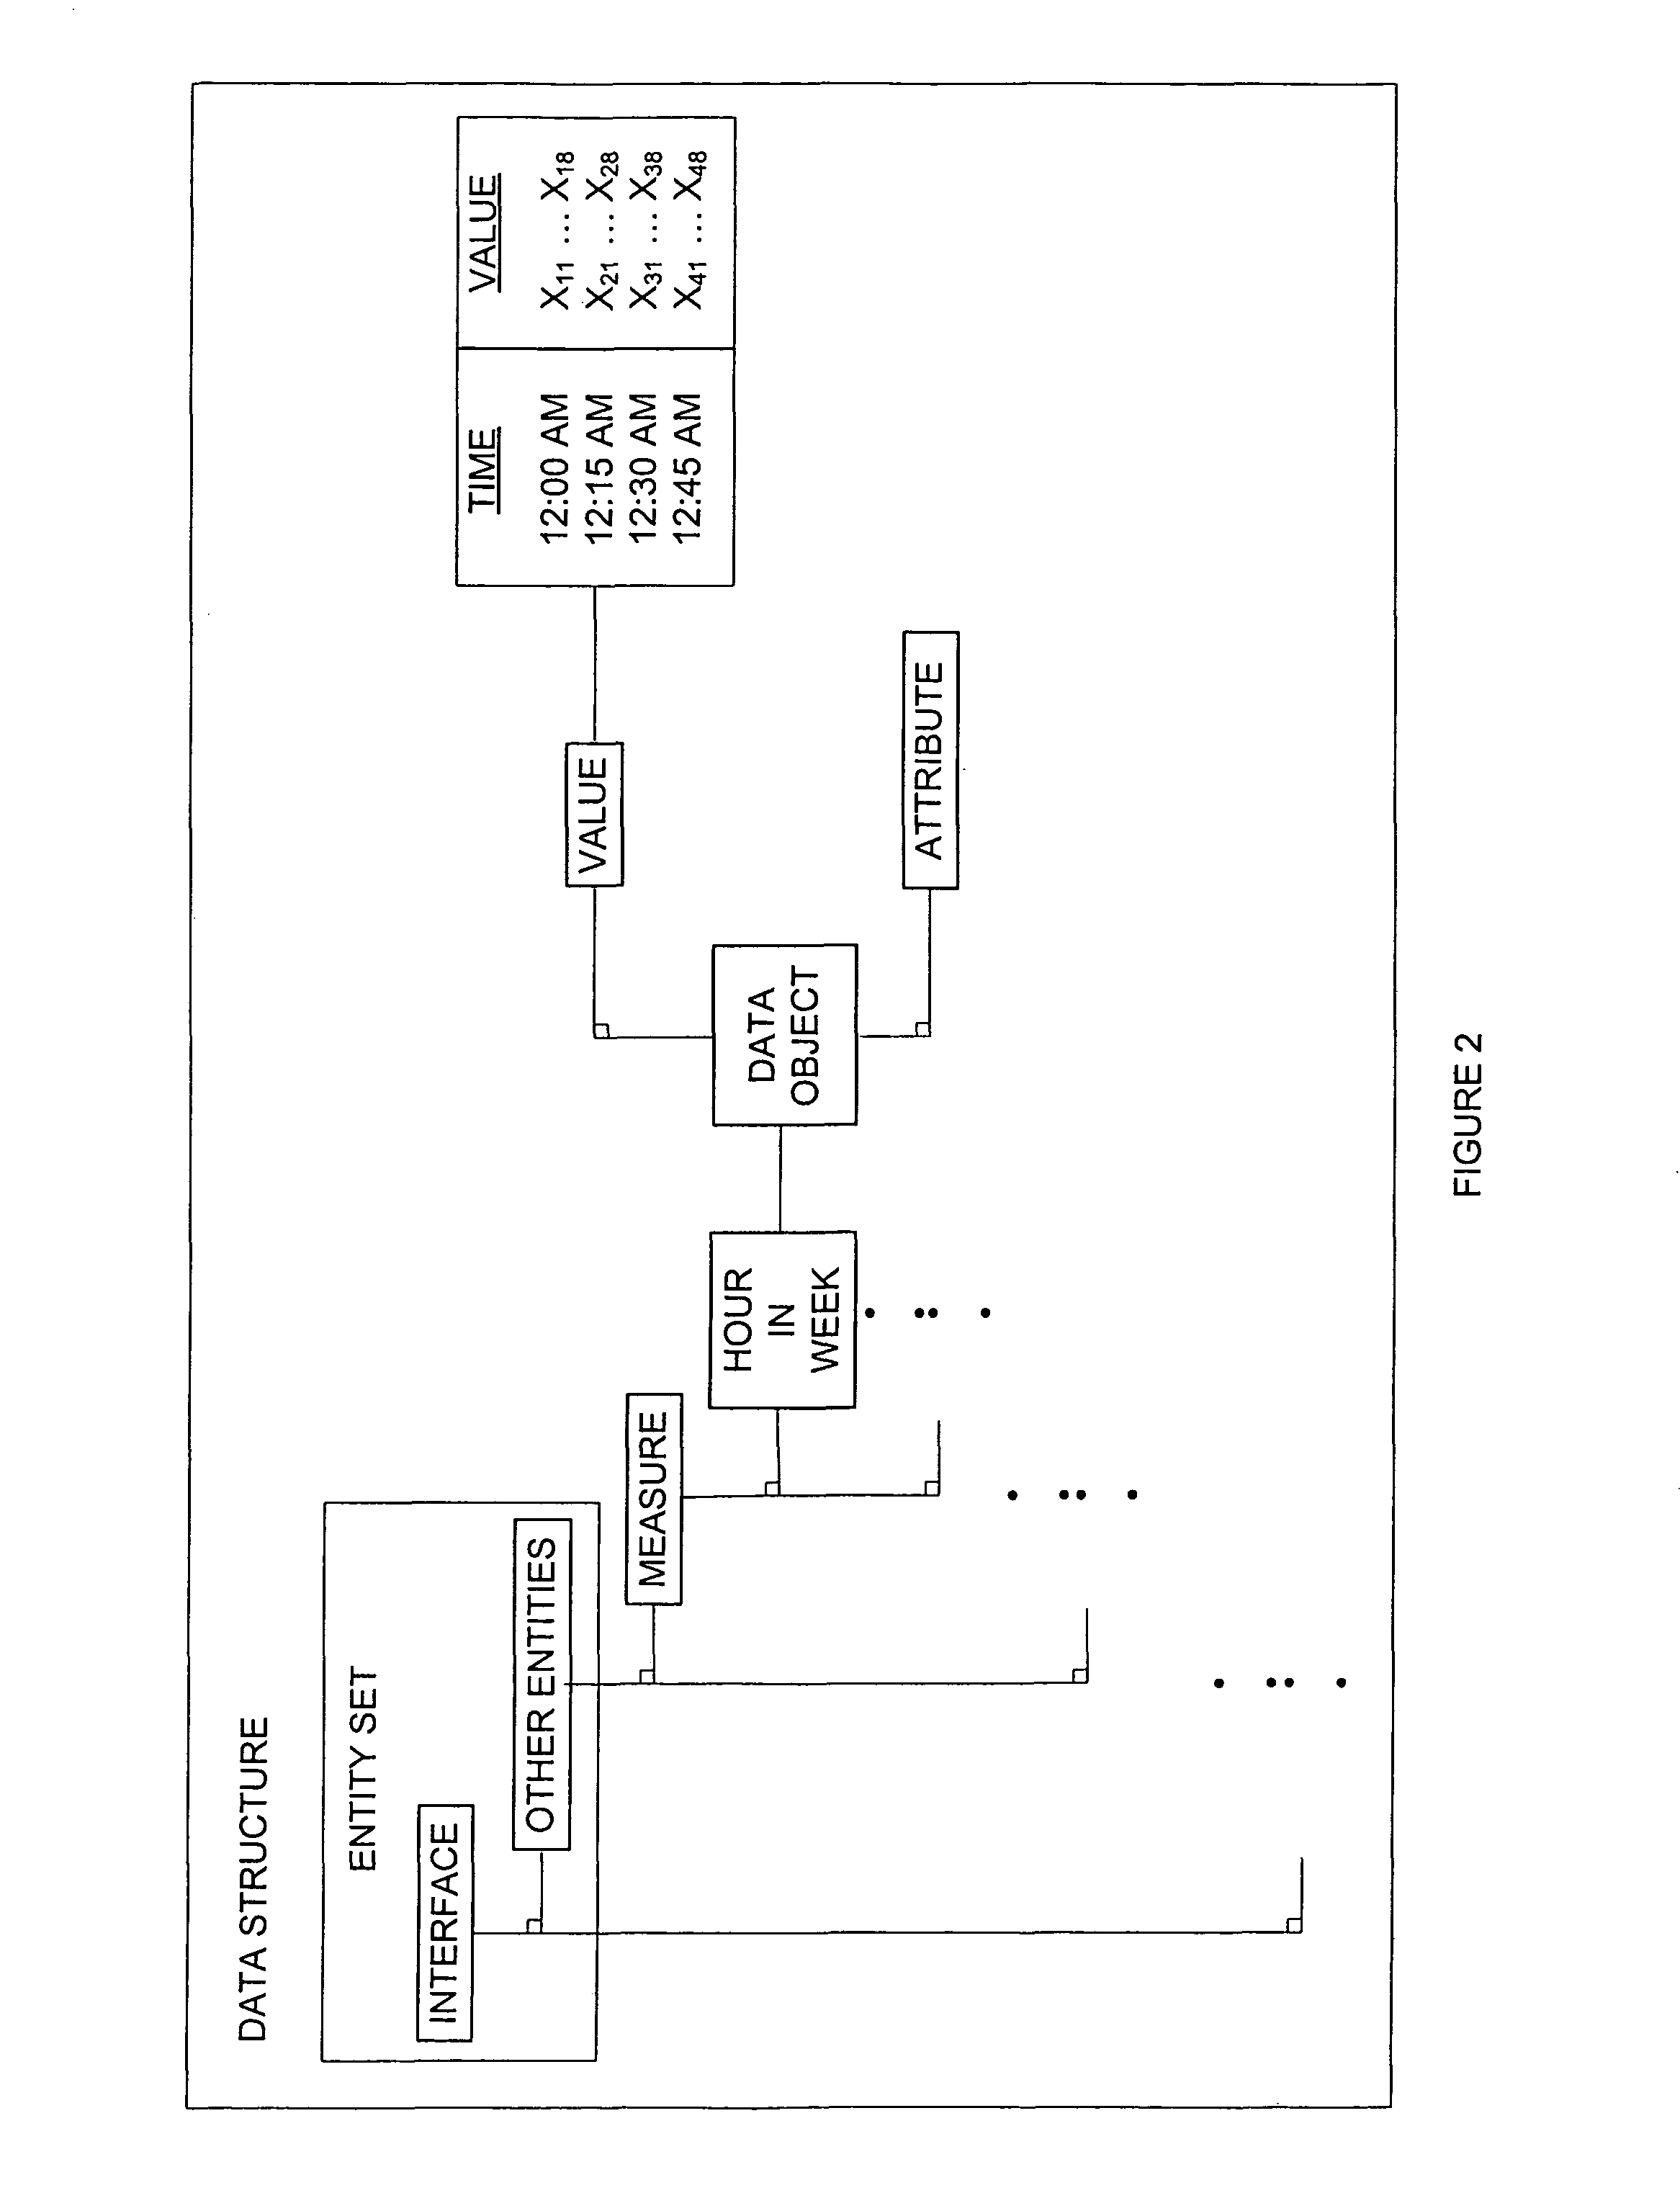
A system and a method are disclosed for establishing a baseline and the corresponding bands of data for alarming, etc. Historical raw data are aggregated and grouped. For example, the data may be and hourly grouped as 168 groups of data in a weekly frame. Clusters of the groups of data are then formed based on dynamic data window by analyzing statistical similarity among the 168 groups of data. Data in each cluster of groups, originated from the raw data at specific hour(s) of day on specific day(s) of week, are used as historical data to predict a baseline and the envelopes at these associated hour(s) and day(s). Generating a baseline includes determining a mapping function, which transforms data in a cluster to become normal or nearly normal. A mean and standard deviation of the transformed data are calculated. Envelopes are determined using the mean and the standard deviation. An inverse transformation function is uniquely derived. The mean and the envelopes are inversely transformed using the inverse function. This operationally decides a baseline and the corresponding bands for every weekly time frame hour.

Description

BACKGROUND[0001]1. Field of Art[0002]The present invention relates generally to the field of network and application management of computer networks, and, more specifically, to the field of monitoring networks.[0003]2. Description of the Related Art[0004]Today's computer networks are extremely complex with hundreds of applications, thousands of servers, hundreds of locations, hundreds of thousands of clients and traffic routed by numerous switches and routers on local area networks (LANs) and wide area networks (WANs). Detection of network faults and performance problems become very critical to have an efficient working environment. However, it also becomes very difficult because there is no commonly accepted operational definition of the baseline of a given measure.[0005]A conventional moving average is often used as a baseline. In this approach, a baseline value is an arithmetic average of measured values within a fixed time window. Since baselining is to show a relatively short t...

Claims


Application Information

Patent Timeline
Patent Type & Authority Patents(United States)
IPC IPC(8): G06F15/173G06F13/00
CPCG06F13/00G06F15/173H04L41/147H04L43/04H04L41/142H04L43/045
Inventor CHANG, HUNG-JENMATURI, MOHAN KUMAR
Owner NETSCOUT SYSTEMS
Learn More