
Metric transport and database load

a technology of metric transport and database load, applied in the field of system model, can solve the problems of poor performance of computer system, fundamentally incapable of performing well,

Active Publication Date: 2009-11-10
T MOBILE INNOVATIONS LLC
View PDF4 Cites 26 Cited by
  • Summary
  • Abstract
  • Description
  • Claims
  • Application Information

AI Technical Summary

Benefits of technology

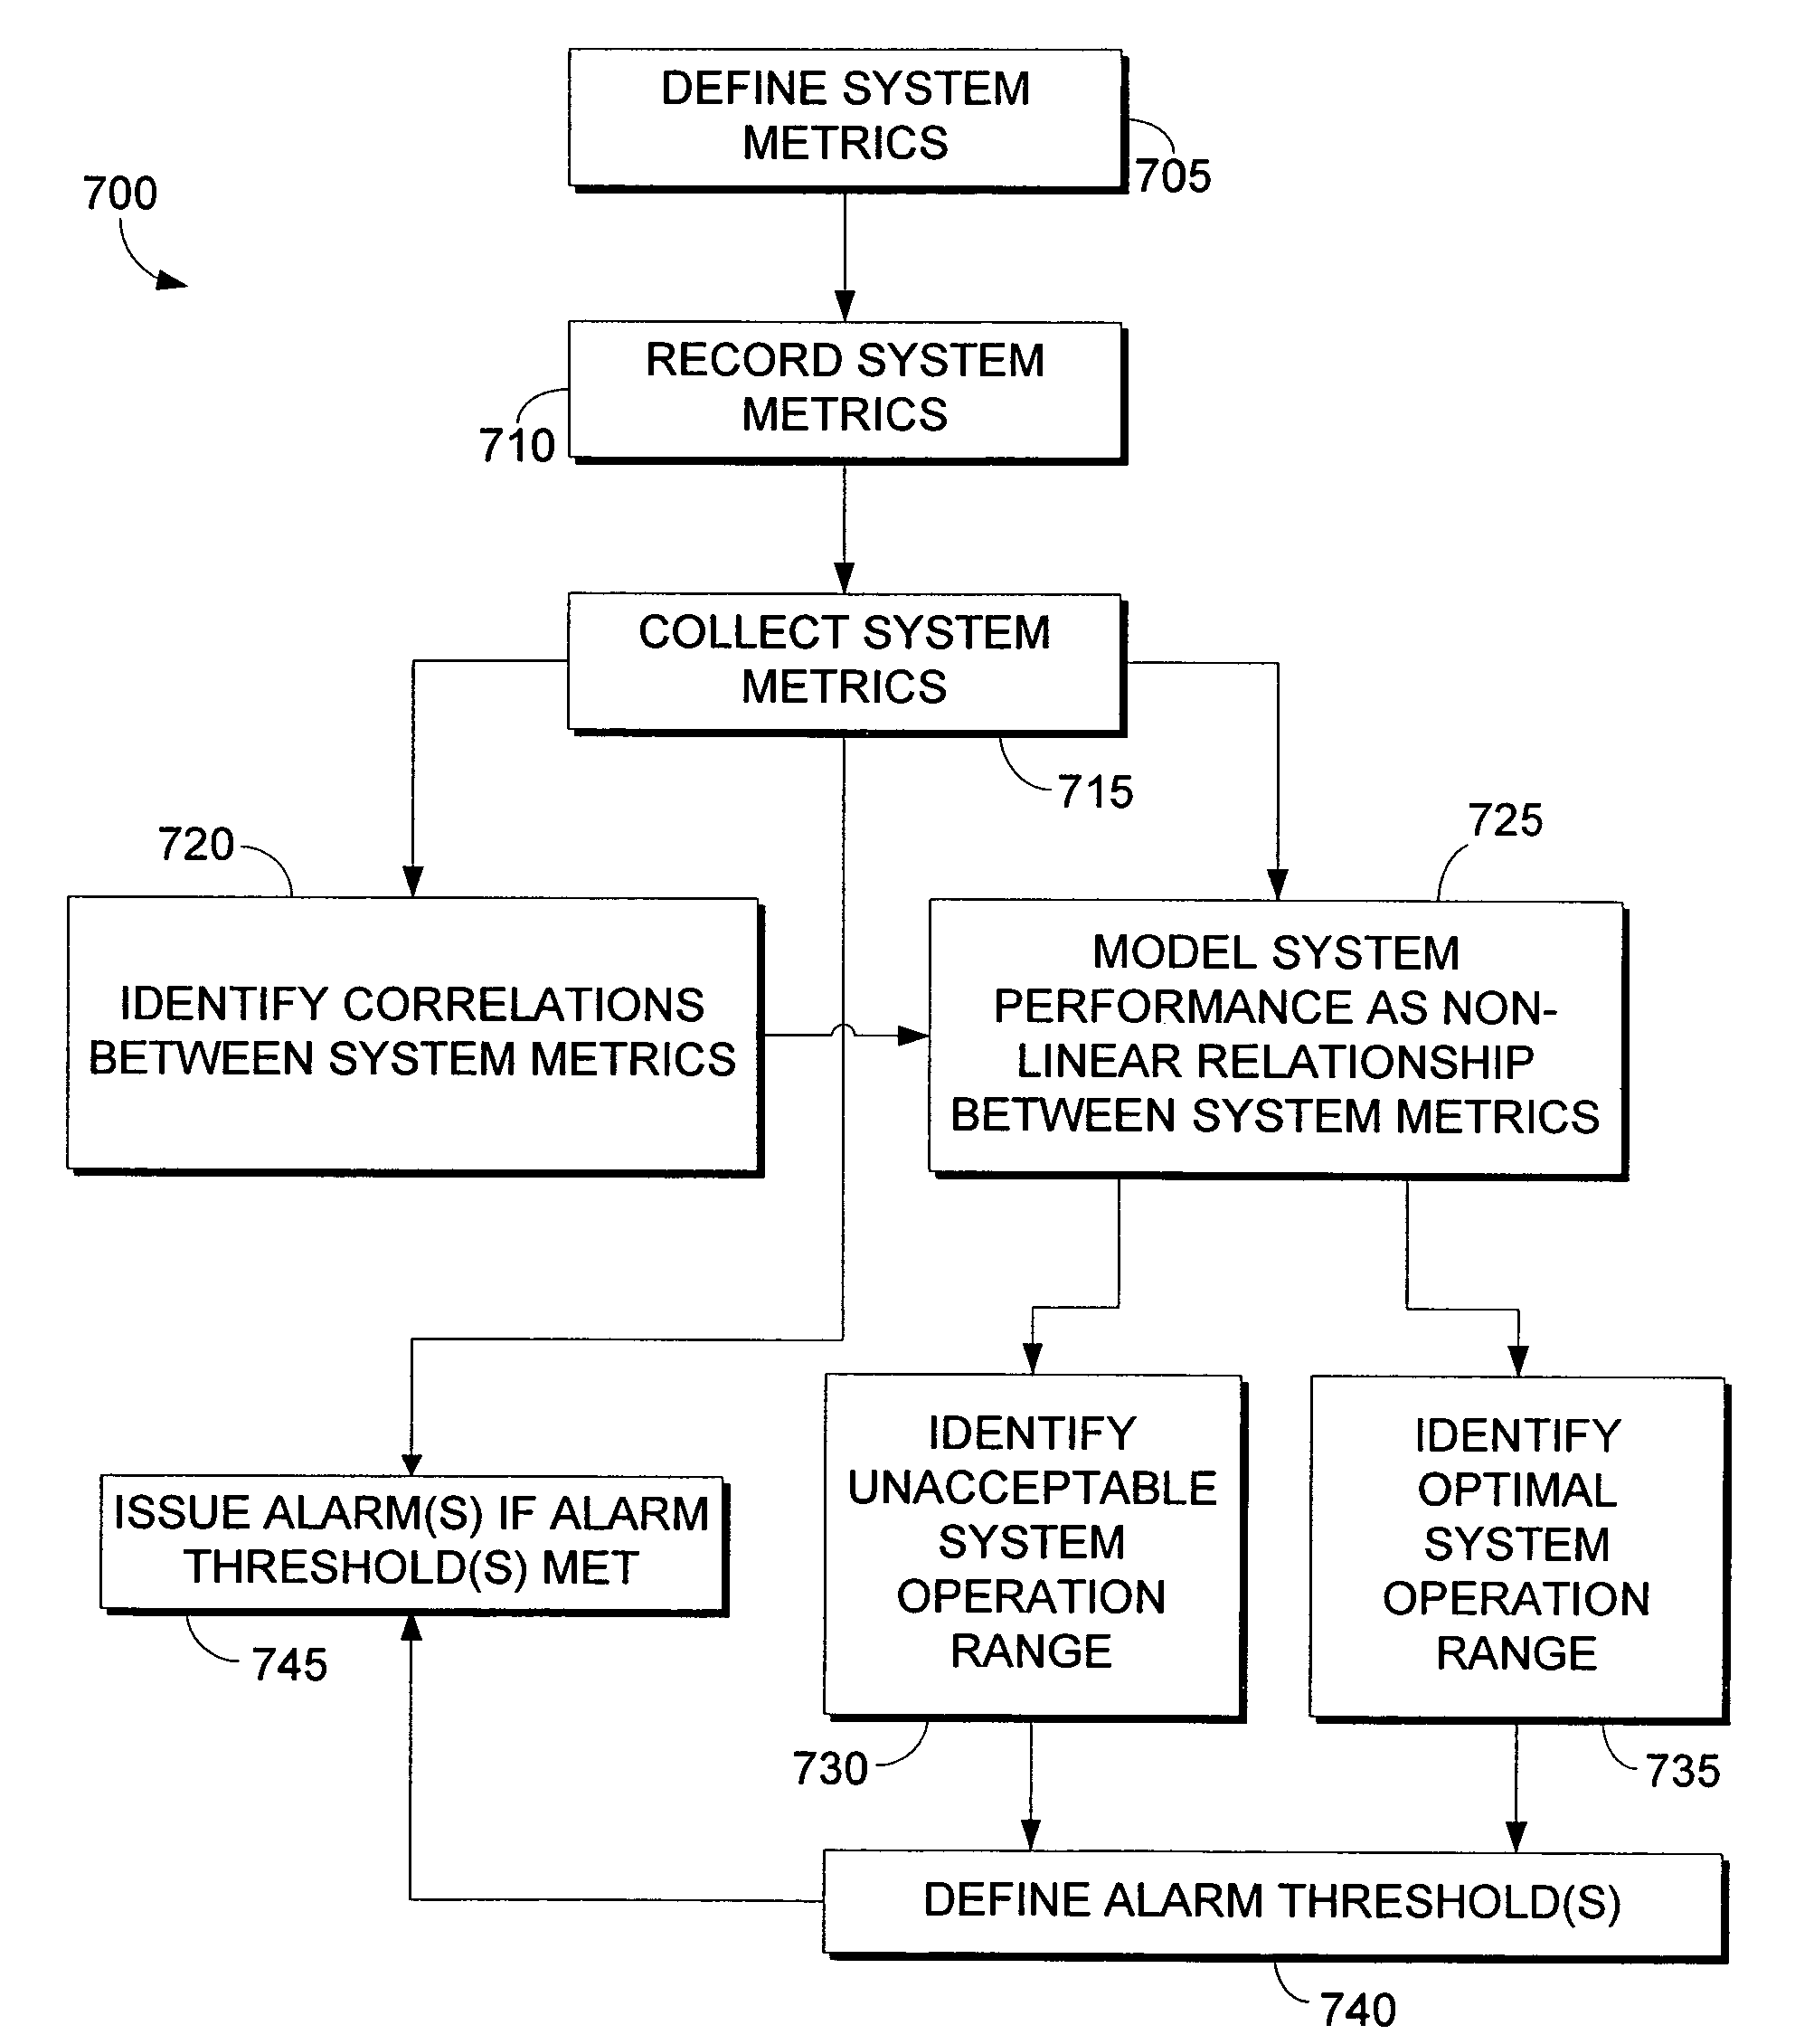
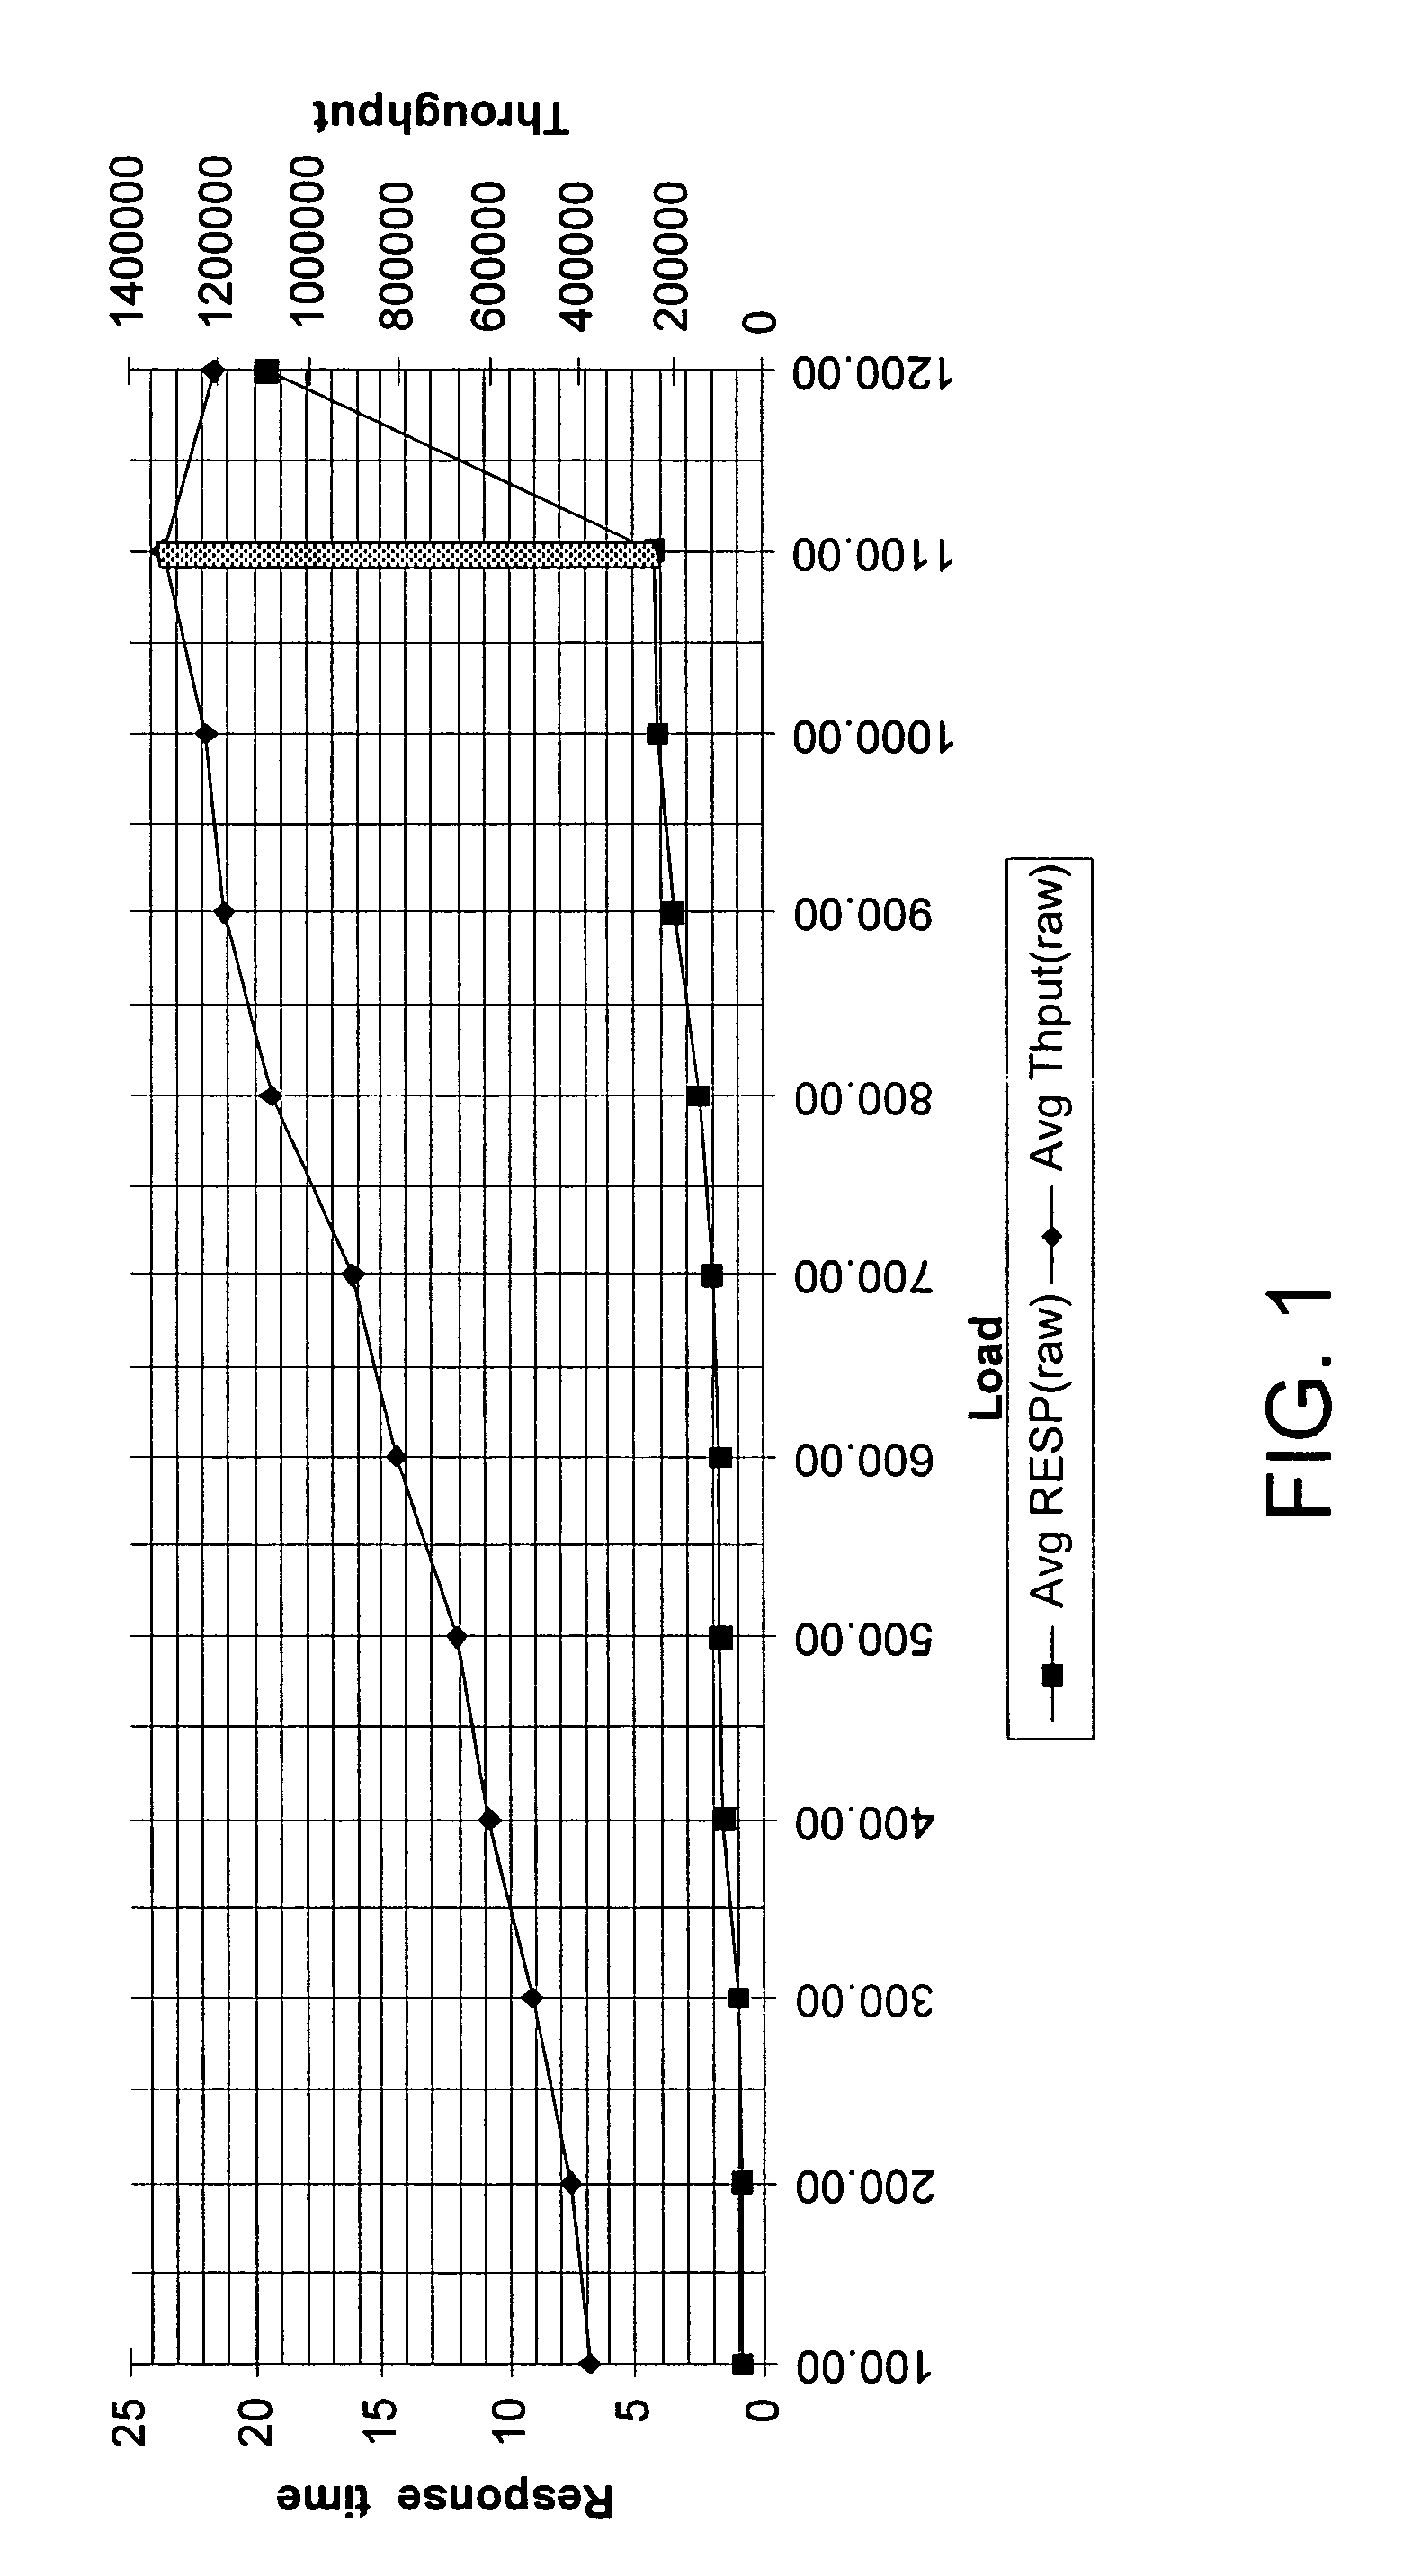
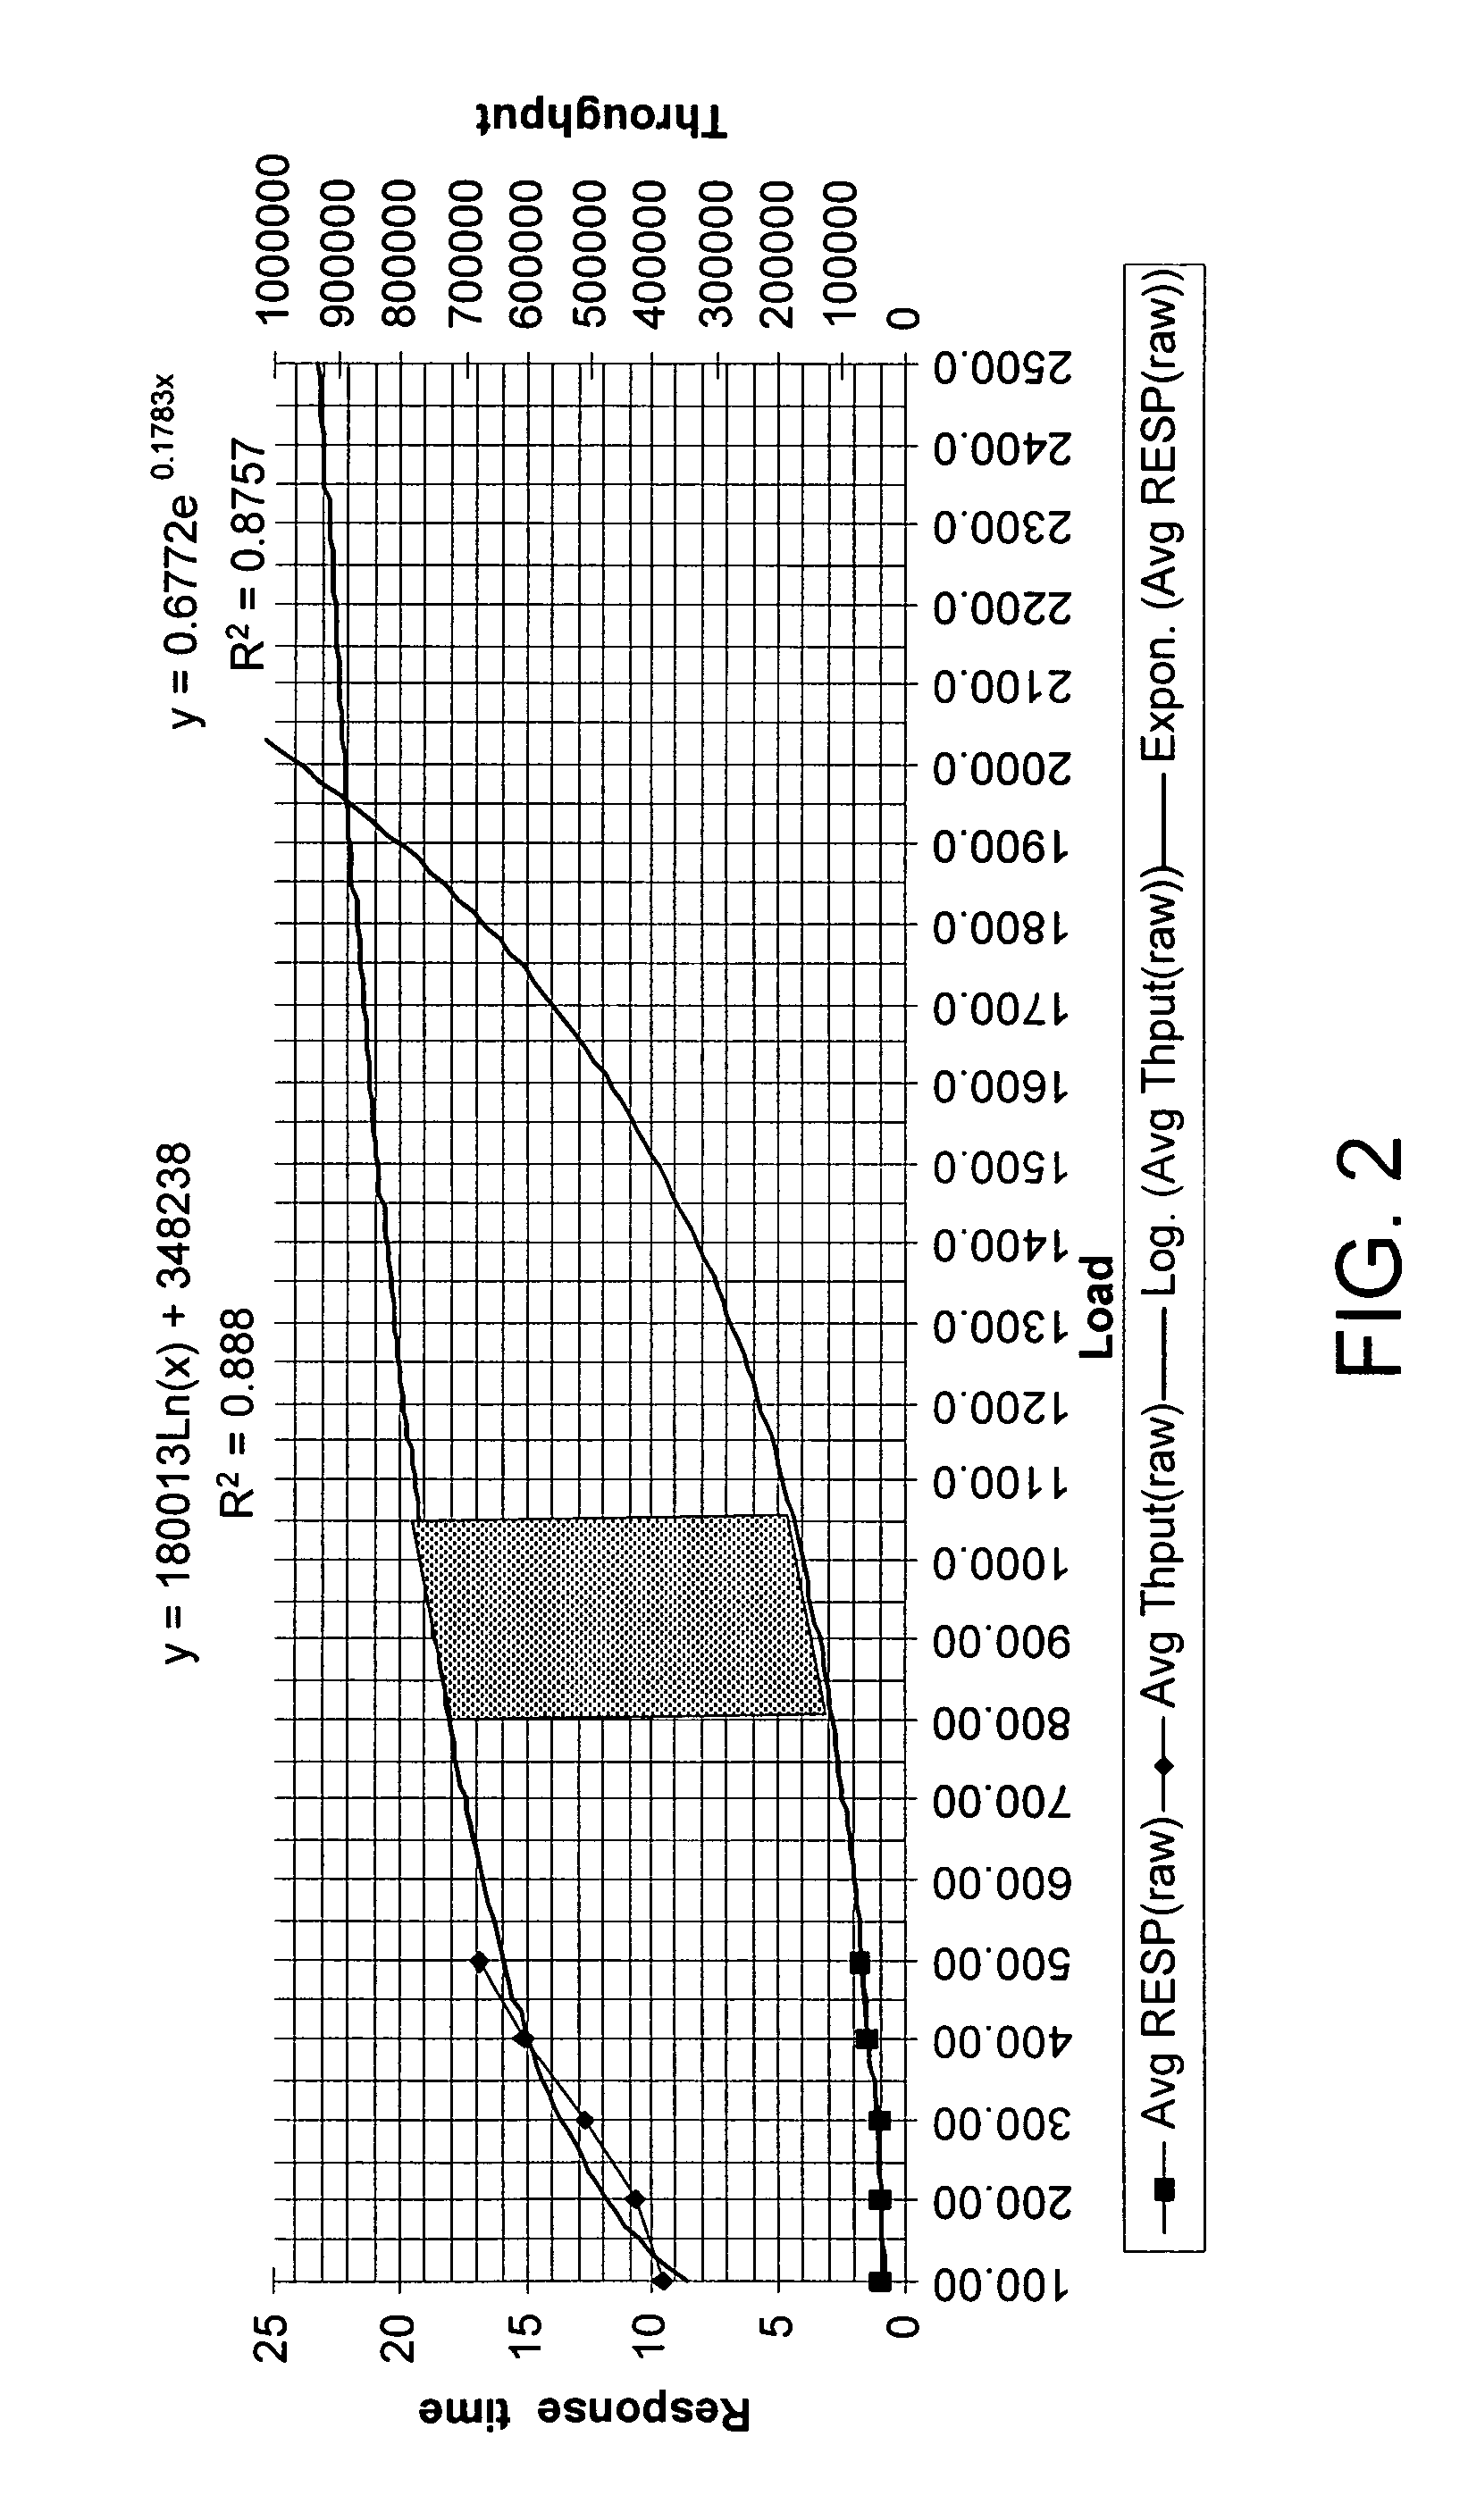
[0010]The present invention provides systems and methods to collect metrics from a system operating in a production environment. The collected metrics may be used as a plurality of data points to model system performance by fitting a non-linear curve to the data points. The use of a non-linear curve may better identify the load at which a system's operation will become unacceptable. Systems and methods in accordance with the present invention may also identify correlations between measured system metrics, which may be used to develop further models of system performance. The present invention may also be utilized to identify a point of interest in system performance for use in monitoring a system in a production environment so that an alarm may issue if system performance exceeds predetermined parameters around the point of interest.

Problems solved by technology

Most people are likely regrettably familiar with poor performing computer systems.
A poor performing computer system may be simply poorly designed and, therefore, fundamentally incapable of performing well.
Even well-designed systems will perform poorly, however, if adequate resources to meet the demands placed upon the system are not available.
Predicting the load that will be placed upon a system may involve a number of issues, and this prediction may be performed in a variety of ways.
Such data may be collected by monitoring a system or its predecessor, although such historical data may not always be available, particularly for an entirely new system.
Determining what amount of resources are required to meet a given system demand may also be a complex problem.
One skilled in the art will also appreciate that such testing can be an enormously complex and expensive proposition, and will further realize that such testing often does not provide accurate information as to at what load a system's performance will deteriorate.
One reason for the expense and difficulty of testing is the large number of tests necessary to obtain a reasonably accurate model of system performance.
System performance often becomes non-linear at some point as the load on the system increases.
At this point system performance suffers severely, but identifying the knee in testing can be difficult.
Obtaining sufficient data points to determine when a linear model of system performance breaks down often requires extensive testing.
At the same time, such testing may not yield an accurate model of system performance, particularly as the system moves beyond a load range in which its performance is substantially linear.
However, linear modeling of system performance using system metrics collected in a production environment will not be likely to yield a better prediction of the system's knee unless the system operates at or beyond that point.
Of course, one skilled in the art will appreciate that the purpose of system testing and system modeling is to avoid system operation at and beyond the knee, meaning that if such data is available the modeling and monitoring has already substantially failed.
A further challenge to using system metrics collected in a production environment is the burden of collecting the metrics.
Simply put, collecting system metrics consumes resources.

Method used


Image

  • Metric transport and database load
  • Metric transport and database load
  • Metric transport and database load

Examples


Embodiment Construction

[0027]The present invention provides systems and methods for monitoring system performance, identifying correlations between system metrics, modeling system performance, identifying acceptable operating parameters, and issuing alarms if acceptable operating parameters are exceeded, wherein a system comprises computer software operating on computer hardware. The present invention may be used in conjunction with a system comprising any computer software operating on any computer hardware. One example of such a system is an order processing system that receives orders input into a user interface, processes that information, and then provides pertinent information to persons or systems responsible for filling the orders. However, any system comprising software operating on hardware may be monitored and / or modeled using systems and methods in accordance with the present invention. In systems and methods in accordance with the present invention, system metrics may be measured and used to ...


PUM


Abstract

Systems and methods for collecting metrics from monitored systems are provided. Collected metrics may be further used for modeling system performance. Collected metrics may be analyzed to identify correlations between metrics, which may then be a basis for system modeling. One or more alarm thresholds may be set based upon system models. If the monitoring of a system indicates that an alarm threshold has been passed, the appropriate alarm may be issued. Alarm levels may vary for different alarm thresholds.

Description

CROSS-REFERENCE TO RELATED APPLICATIONS[0001]None.STATEMENT REGARDING FEDERALLY SPONSORED RESEARCH OR DEVELOPMENT[0002]None.TECHNICAL FIELD[0003]The present invention relates to the modeling of systems comprising computer software operating on computer hardware. More particularly, the present invention relates to real-time collection of system metrics and the systems and methods for the modeling of system performance parameters as non-linear functions for use in predicting system performance, identifying circumstances at which system performance will become unacceptable, and issuing alarms when system performance is near or beyond unacceptable conditions.BACKGROUND OF THE INVENTION[0004]Computing systems have become an integral part of business, government, and most other aspects of modern life. Most people are likely regrettably familiar with poor performing computer systems. A poor performing computer system may be simply poorly designed and, therefore, fundamentally incapable of ...

Claims


Application Information

Patent Timeline
Patent Type & Authority Patents(United States)
IPC IPC(8): G06F15/173
CPCG06F11/3419G06F11/3447G06F11/3476G06F2201/87G06F2201/81
Inventor WASHBURN, BRIAN JOHNFARRELL, BRIAN PAUL
Owner T MOBILE INNOVATIONS LLC
Learn More