
Sampling spectrophotometer comprising an interferometer

Inactive Publication Date: 2008-10-21
ASTRIUM SAS
View PDF7 Cites 2 Cited by
  • Summary
  • Abstract
  • Description
  • Claims
  • Application Information

AI Technical Summary

Benefits of technology

[0013]Thus, according to the invention, the spacings between the values of the optical path length difference corresponding to two successive measurements of light intensity in the interferogram are no longer identical. The spectral distribution of the light in the beam can now no longer be evaluated by Fourier transform, but it can be evaluated by solving the set of equations (1). This set of equations forms a system of N linear equations with N unknown values, which are the values Ak of the intensities of the spectral components associated with the frequencies fk. Such a system of equations can be solved very simply, in a known manner, by using calculation means that are simple and inexpensive.
[0015]According to one preferred embodiment of the invention, the interferometer can comprise a Michelson apparatus. In this case, the various values of the optical path length difference can be produced simultaneously. All of the light intensities that form the sample of the interferogram can therefore be measured at the same time by using a linear array of photodetectors. Measurement time is saved as a result.
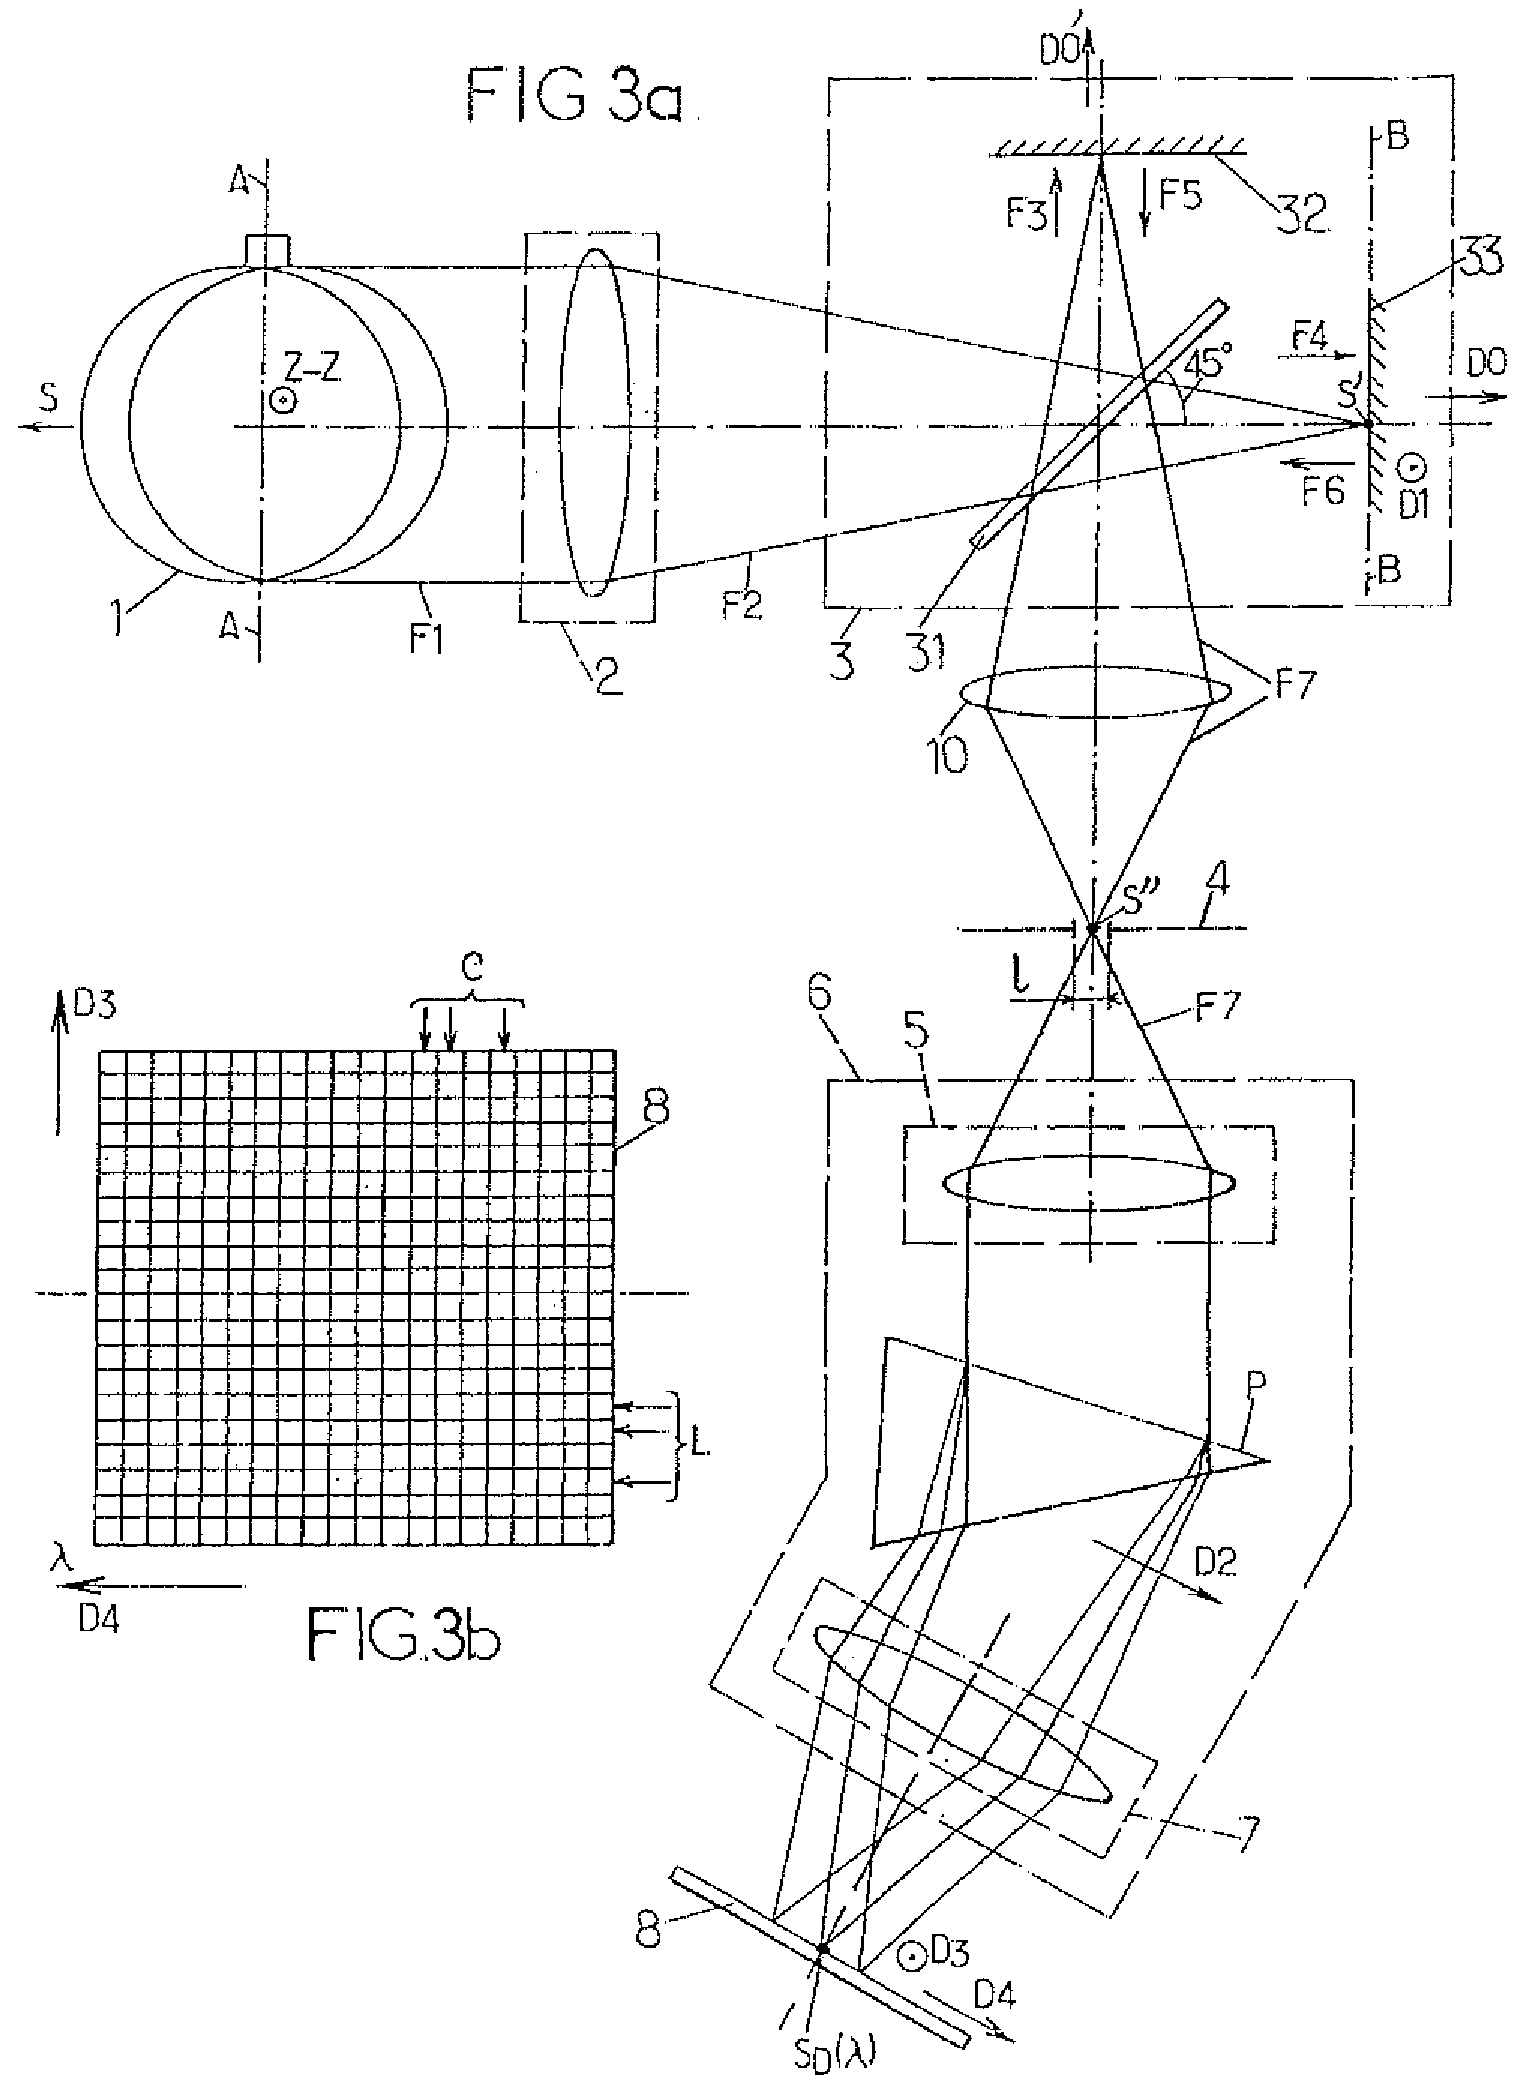
[0017]According to one improvement of the invention, the interferometer can form several interferograms corresponding to respective spectral intervals. The spectrophotometer can then also comprise a dispersing system arranged in such a manner as to spatially separate parts of the light from the beam which respectively correspond to the interferograms. Advantageously, the interferograms can be formed by respective sets of light intensity values which are measured parallel to a common interferogram direction, and the dispersing system is oriented so that a direction of dispersion of the latter is substantially perpendicular to the interferogram direction. For such a spectrophotometer, the spectral interval that corresponds to each of the interferograms can be deduced from information collected in the dispersion direction. Furthermore, the use of a matrix of photodetectors allows all the interferograms to be recorded simultaneously. The measurement time required for analysing a light beam is not therefore increased.

Problems solved by technology

But, a filter that corresponds to any given spectral interval is not always available.
The limited variety of the available filters therefore leads to a constraint on the spectral interval within which a light beam may be analysed using a Fourier transform spectrophotometer.
Such a constraint can be a problem, especially for measurements in space performed from a satellite, since the spectrophotometer filter cannot be easily changed.

Method used


Image

  • Sampling spectrophotometer comprising an interferometer
  • Sampling spectrophotometer comprising an interferometer
  • Sampling spectrophotometer comprising an interferometer

Examples


Embodiment Construction

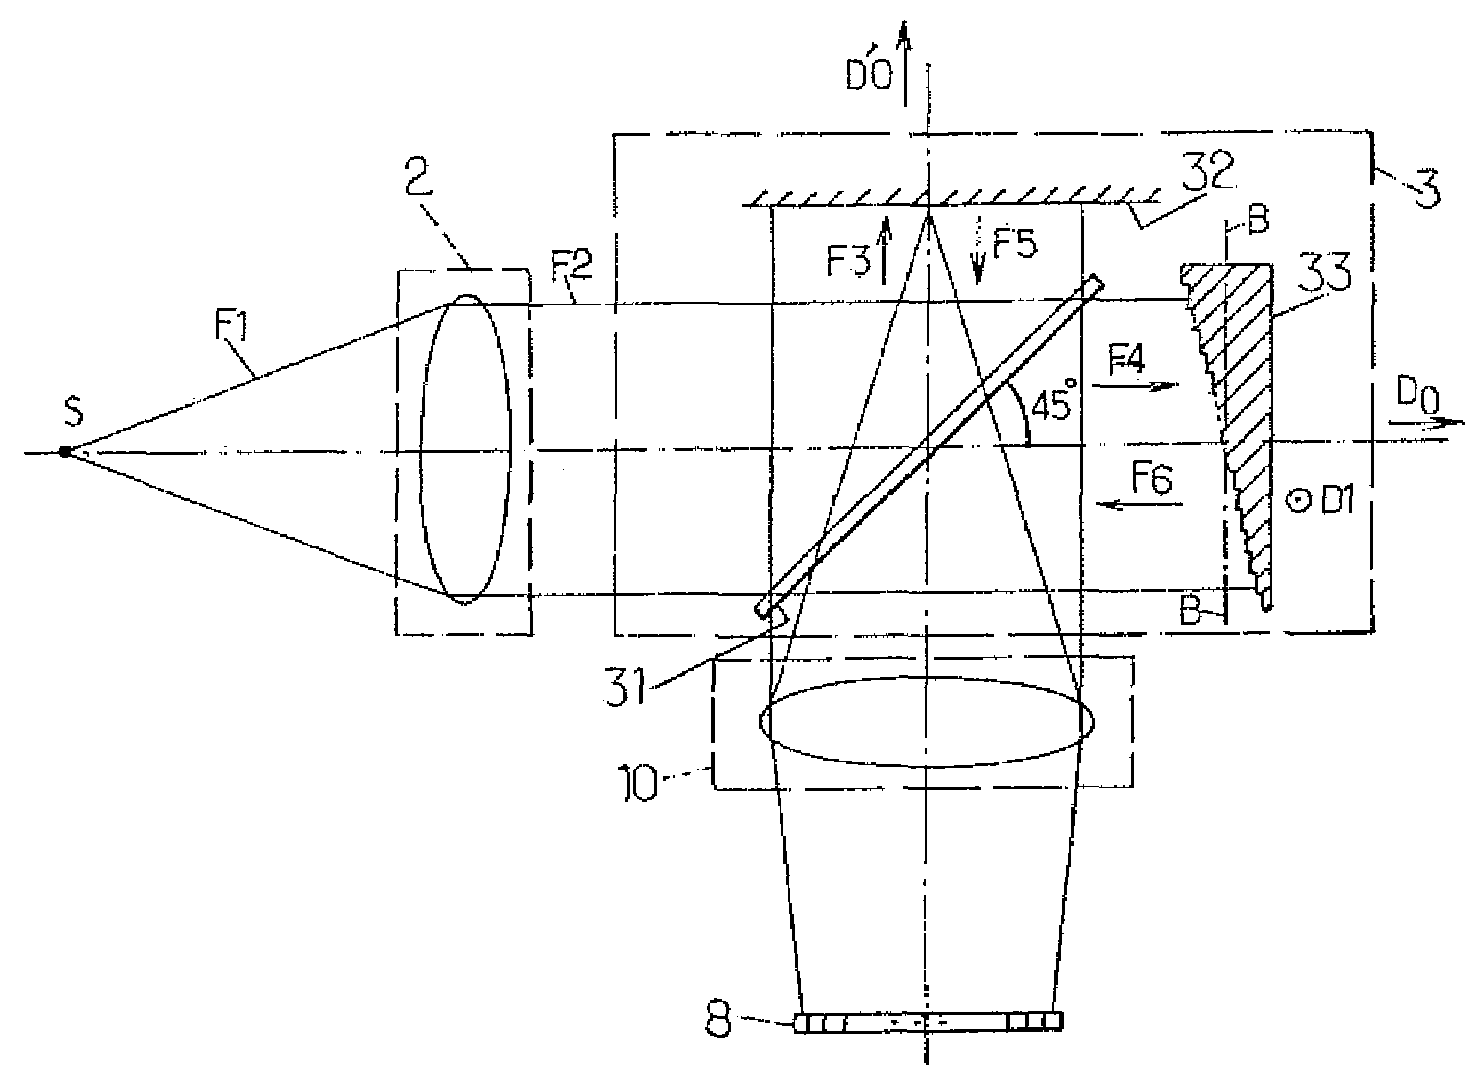
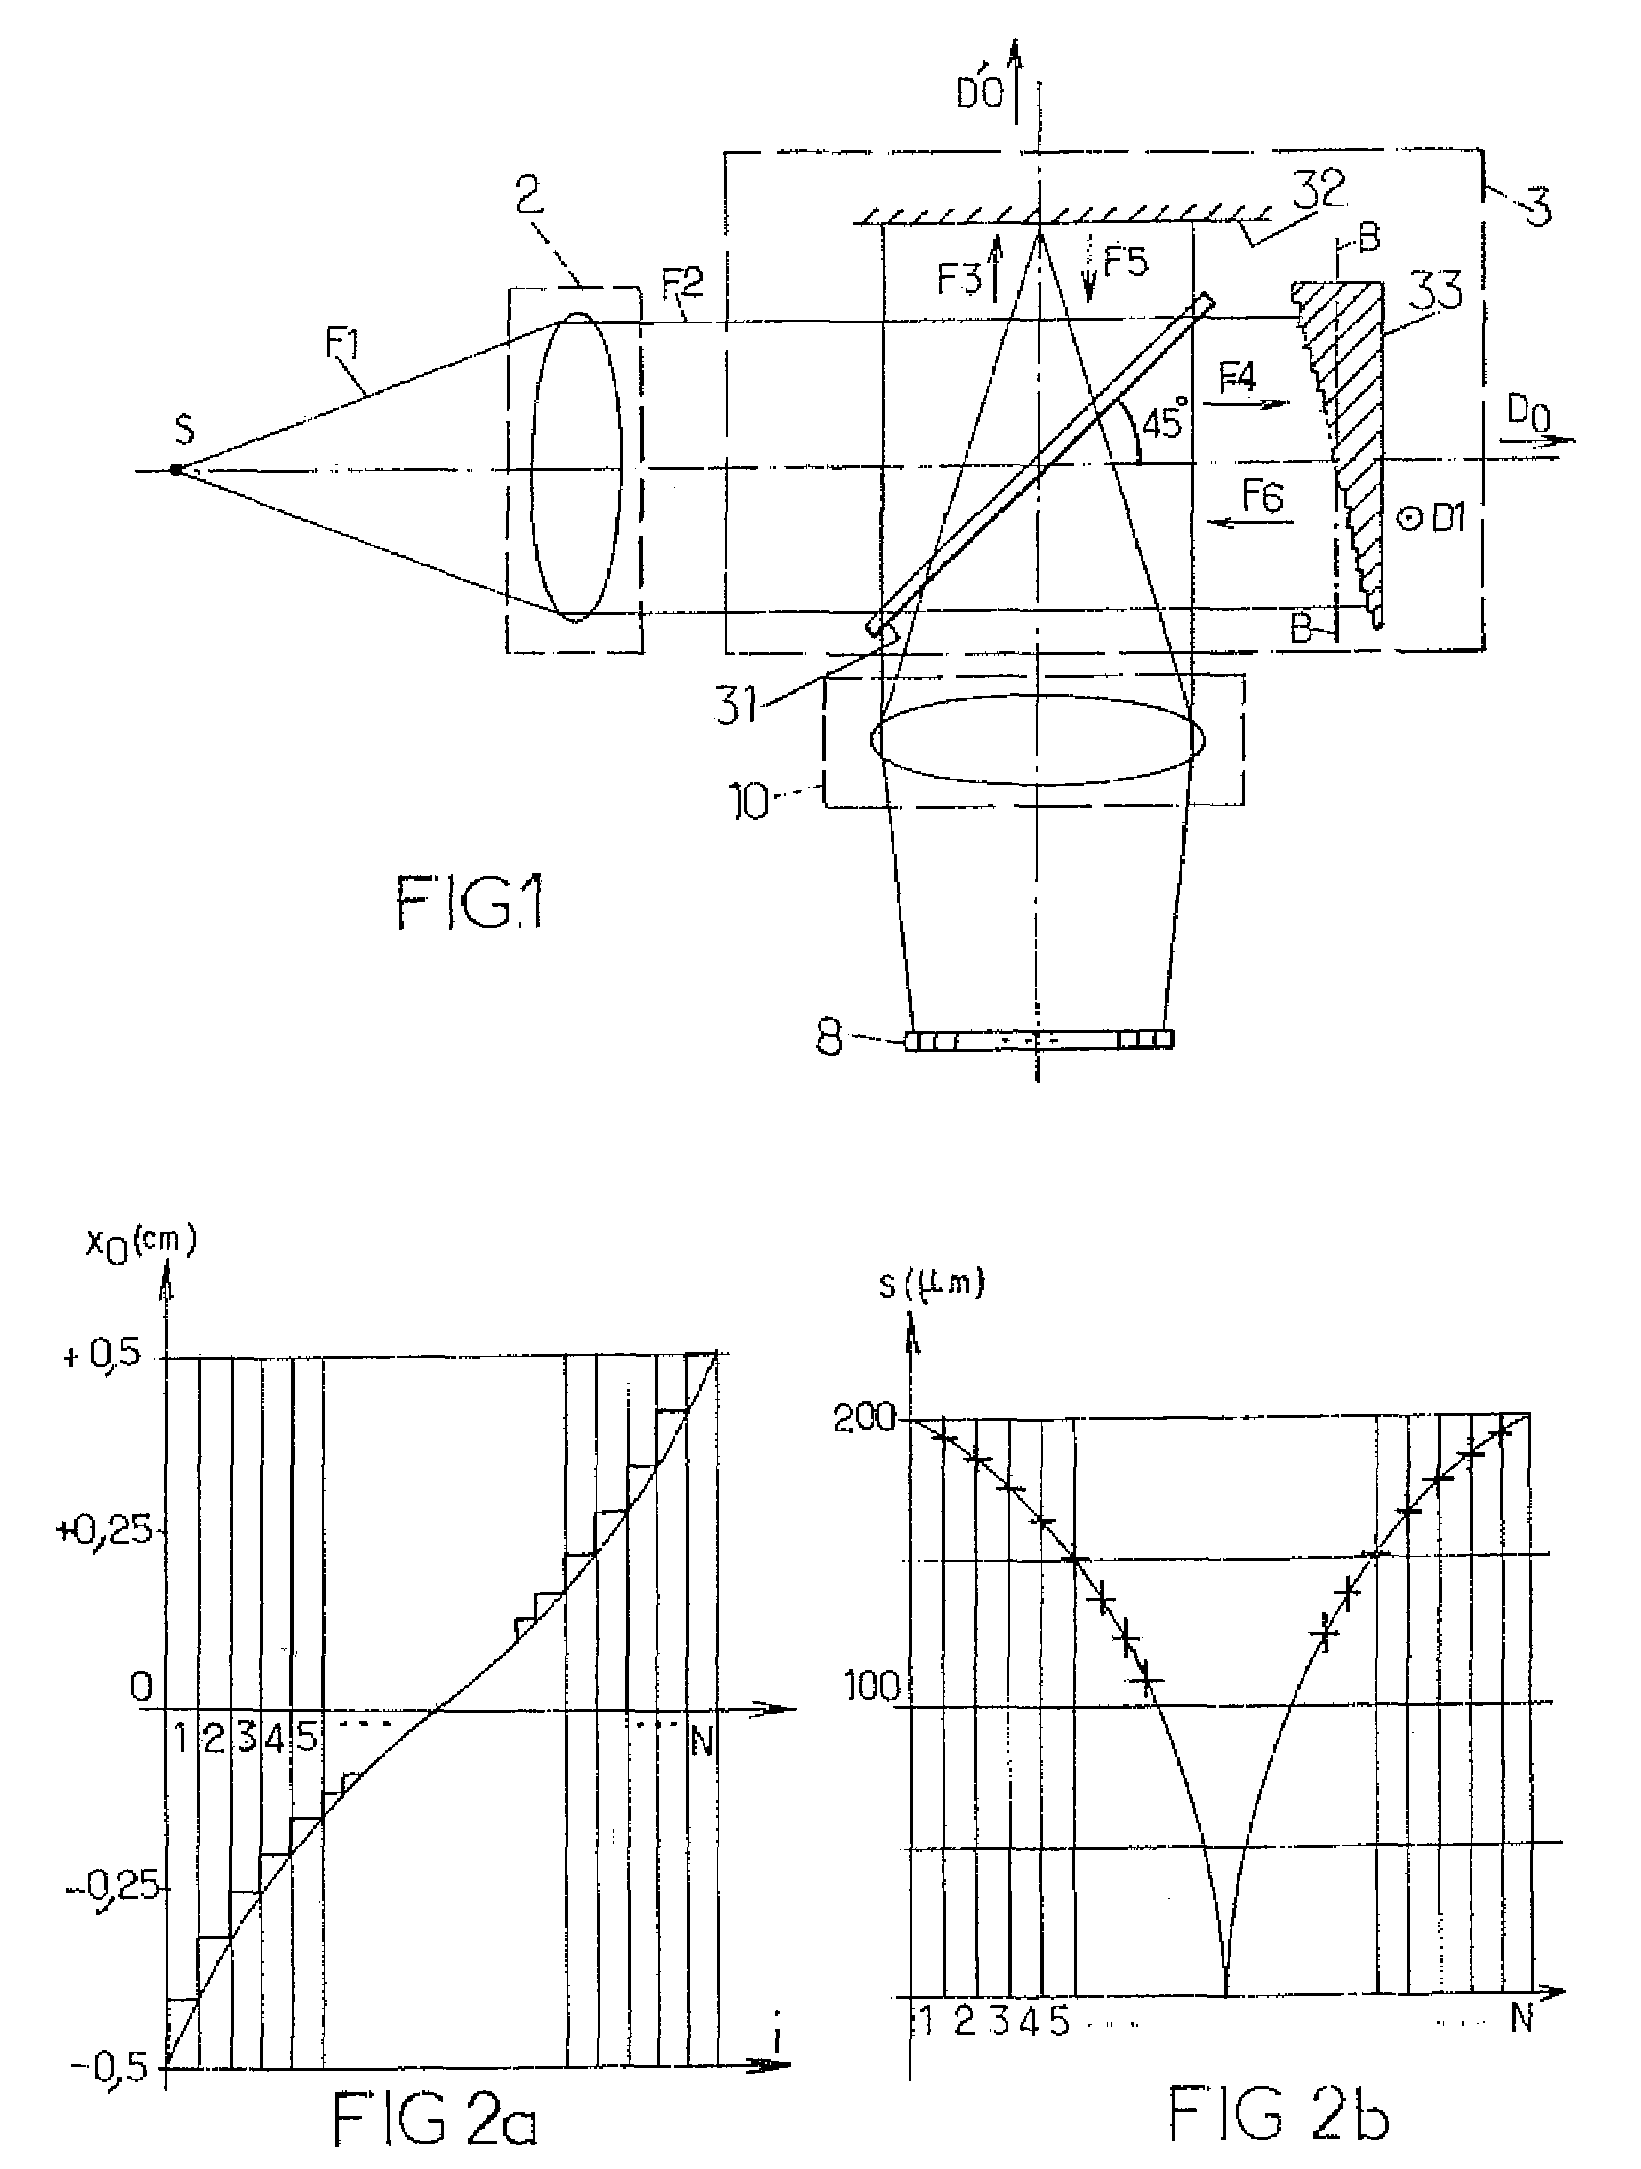
[0030]FIGS. 1 and 3a illustrate different arrangements of optical elements within spectrophotometers according to two particular embodiments of the invention. For reasons of clarity, the dimensions of the optical elements shown in these figures and the distances between these elements are not in proportion with actual dimensions and distances. In addition, identical references in these figures denote identical elements, or which have identical functions. Lastly, in the following description, the optical elements known to those skilled in the art are not described in detail. Only indications are given concerning their use within the spectrophotometers described.

[0031]According to FIG. 1, a spectrophotometer comprises an optical entry 2, a Michelson interferometer, an intermediate optical assembly 10 and a linear array of photodetectors 8. In a known manner, the Michelson interferometer itself comprises:[0032]a device 31 for separating, by intensity division, a primary beam F2 enterin...


PUM


Abstract

A sampling spectrophotometer comprising an interferometer is used for performing a spectral analysis of light produced by a source. The sampling is adapted for eliminating uncertainty in the frequencies that are associated with spectral components deduced from an interferogram. Preferably, the interferometer is of Michelson type, and is equipped with at least one staircase mirror in one of the two optical paths. Elementary reflecting strips of the staircase mirror can then be offset with respect to one another according to a variable step.

Description

FIELD OF THE DISCLOSURE[0001]The present invention relates to a sampling spectrophotometer that comprises an interferometer, together with a method for spectral analysis of a light beam.BACKGROUND OF THE DISCLOSURE[0002]Spectrophotometers referred to as Fourier transform spectrophotometers are well known. Each of these instruments is essentially composed of an interferometer that produces an interferogram from a light beam directed into the entry of the instrument. Measurements of light intensity are recorded, which respectively correspond to fixed values of an optical path length difference. This optical path length difference exhibits identical spacings between two successive measurements in the interferogram. The spectral distribution of the light in the beam is then evaluated by calculating a Fourier transform of the measured intensities as a function of the values of the optical path length difference.[0003]Now, the reduction of the interferogram to a limited sample of light in...

Claims


Application Information

Patent Timeline
IPC IPC(8): G01B9/02G01J3/45
CPCG01J3/453G01J2003/4538
Inventor PASTERNAK, FREDERICK
Owner ASTRIUM SAS
Learn More