
Systems and methods for real-time DC microgrid power analytics for mission-critical power systems

a technology of power analytics and dc microgrids, applied in the field of computer modeling and management of systems, can solve the problems of not being applied in real-time to dc microgrids, reducing development costs and superior operation, and predictive failure analysis techniques that generally do not use real-time data that reflect actual system operation

Inactive Publication Date: 2017-02-16
POWER ANALYTICS CORP
View PDF2 Cites 190 Cited by
  • Summary
  • Abstract
  • Description
  • Claims
  • Application Information

AI Technical Summary

Benefits of technology

This patent describes a system and method for modeling the topology of an electrical power system using a virtual system model. The system includes a processor, memory, display device, and input device for selecting power system components and positioning them in a framework. The system can also receive real-time data and perform power analytics on the virtual system model to generate analytical data. This system and method can be used for performing power analytics on a microgrid and providing the data to a recipient. The technical effect of this invention is to enable improved power system modeling and analysis for better decision-making and operational control of power systems.

Problems solved by technology

Such simulation techniques have resulted in reduced development costs and superior operation.
Design and production processes have benefited greatly from such computer simulation techniques, and such techniques are relatively well developed, but they have not been applied in real-time to DC microgrids, e.g., for real-time operational monitoring and management of the microgrid.
In addition, predictive failure analysis techniques do not generally use real-time data that reflect actual system operation.
Static systems simply cannot adjust to the many daily changes to the electrical system that occur at a facility (e.g., motors and pumps switching on or off, changes to on-site generation status, changes to utility electrical feed .
Without a synchronization or aging ability, reliability indices and predictions are of little value as they are not reflective of the actual operational status of the facility and may lead to false conclusions.
It will be understood that such systems are highly complex, a complexity made even greater as a result of the required redundancy.
However, programs leave the understanding of these trajectories, i.e., severity of these disturbances, and their relevance to the power system security Largely to an engineer's judgment.
Conventional approaches to modeling complex network topologies, their interconnectivity, interdependencies and relationships are limited to the application of diagrammatic sketches, computer aided design (CAD), or other forms of design technologies that require extensive training and know-how by the user in order to design realistic and error free networks, such as electrical one-line diagrams for power system simulation.
Also for example, current technology often overburdens users with thousands of pieces of information per second from sensory data points that are distributed throughout the monitored electrical power system facility.
Therefore, it is nearly impossible for facility operators, managers and technicians to digest and understand all the sensory data to formulate an accurate understanding of their relevance to the overall status and health of their mission critical power system operations.
Mixed technologies (i.e., both AC and DC) are not currently well understood.
Current standards create islands of data which do not have the ability to incorporate advanced and / or new power system modeling and analytics methods.
This hinders the overall acceptance and adoption of microgrid systems, especially those comprising DC or mixed technologies.
Currently, no solution exists for performing real-time power analytics on a DC microgrid for mission-critical power systems.

Method used


Image

  • Systems and methods for real-time DC microgrid power analytics for mission-critical power systems
  • Systems and methods for real-time DC microgrid power analytics for mission-critical power systems
  • Systems and methods for real-time DC microgrid power analytics for mission-critical power systems

Examples


Embodiment Construction

.”

BRIEF DESCRIPTION OF THE DRAWINGS

[0021]For a more complete understanding of the principles disclosed herein, and the advantages thereof, reference is now made to the following descriptions taken in conjunction with the accompanying drawings, in which:

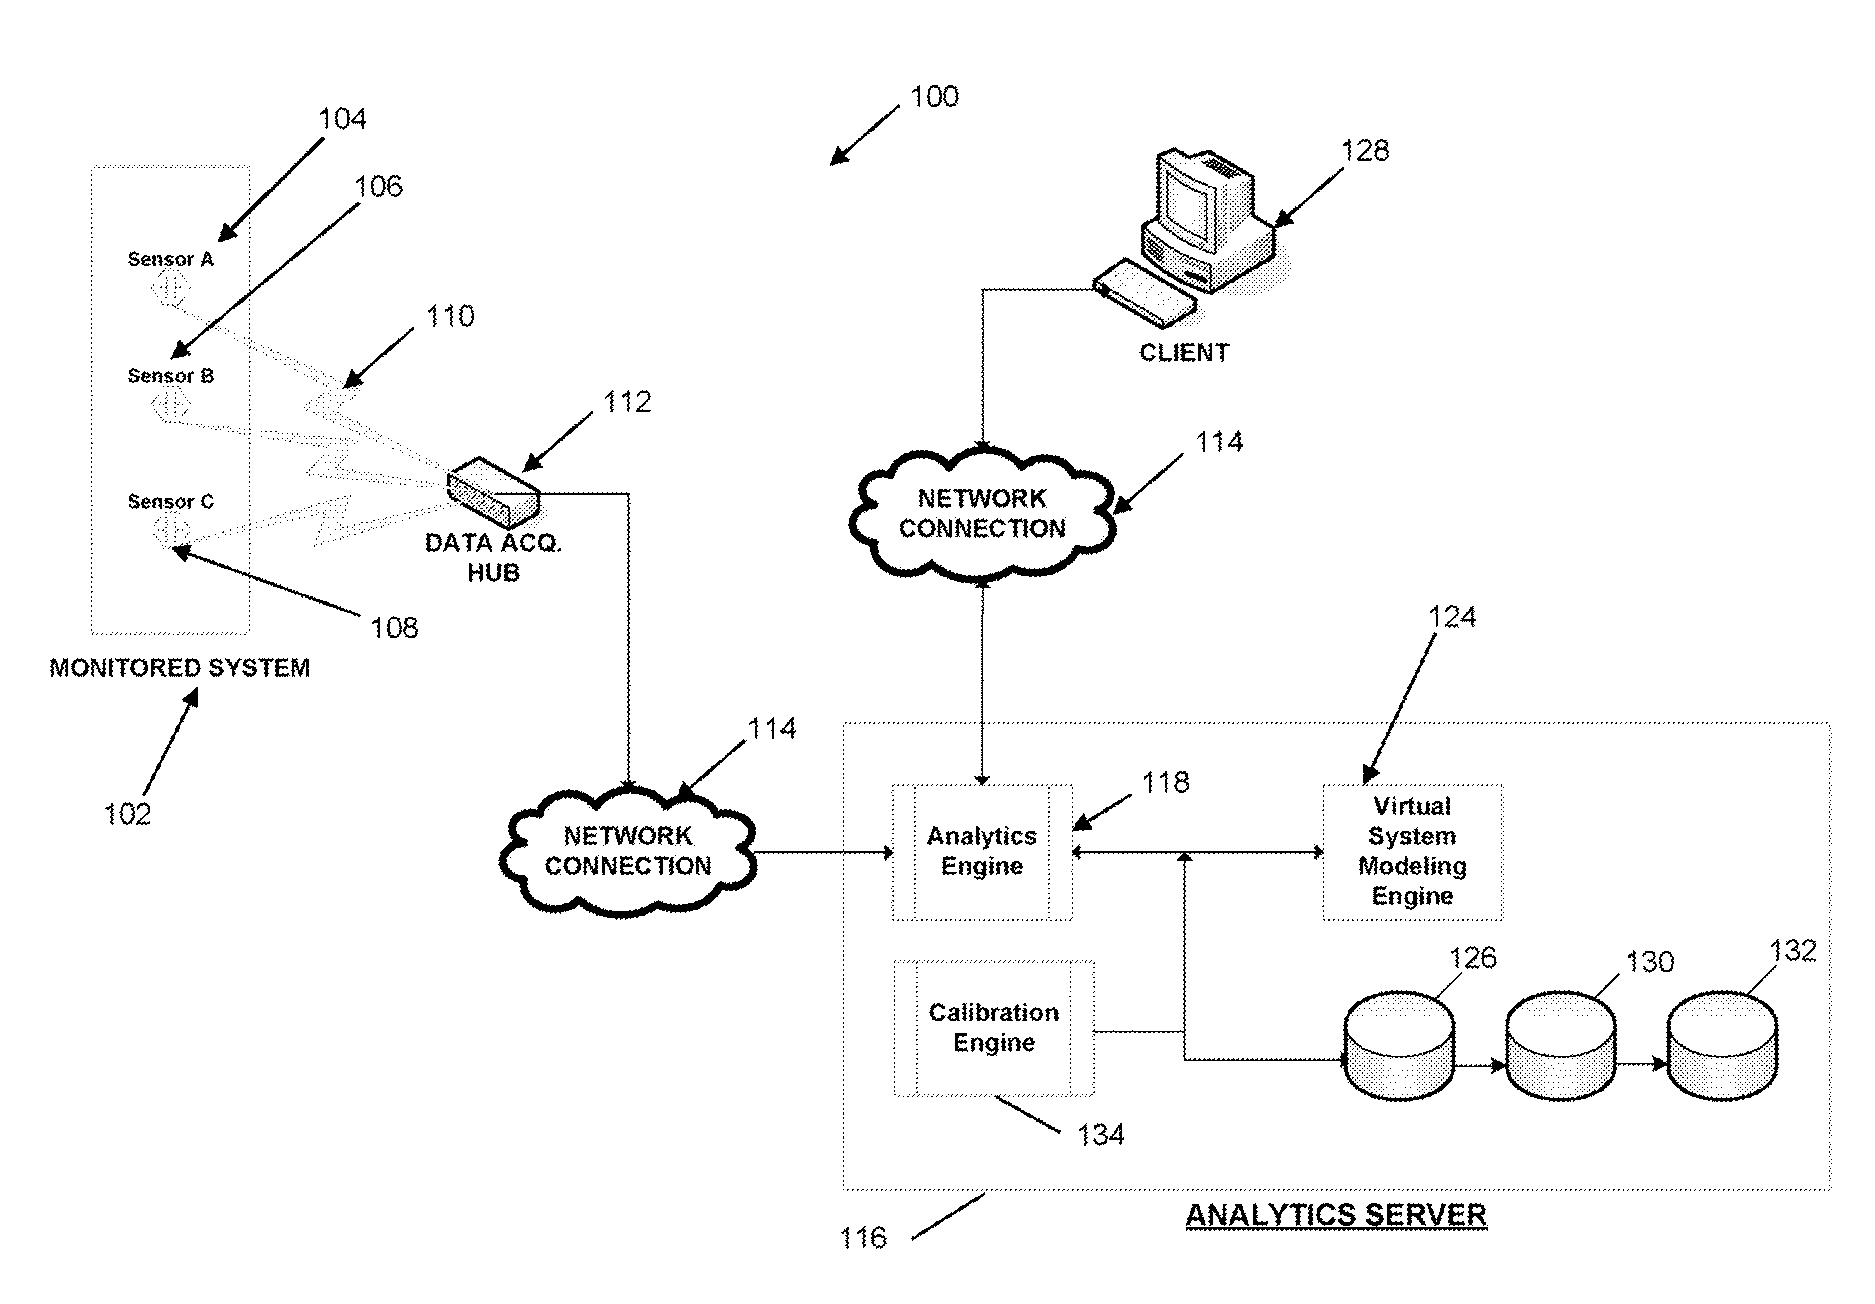
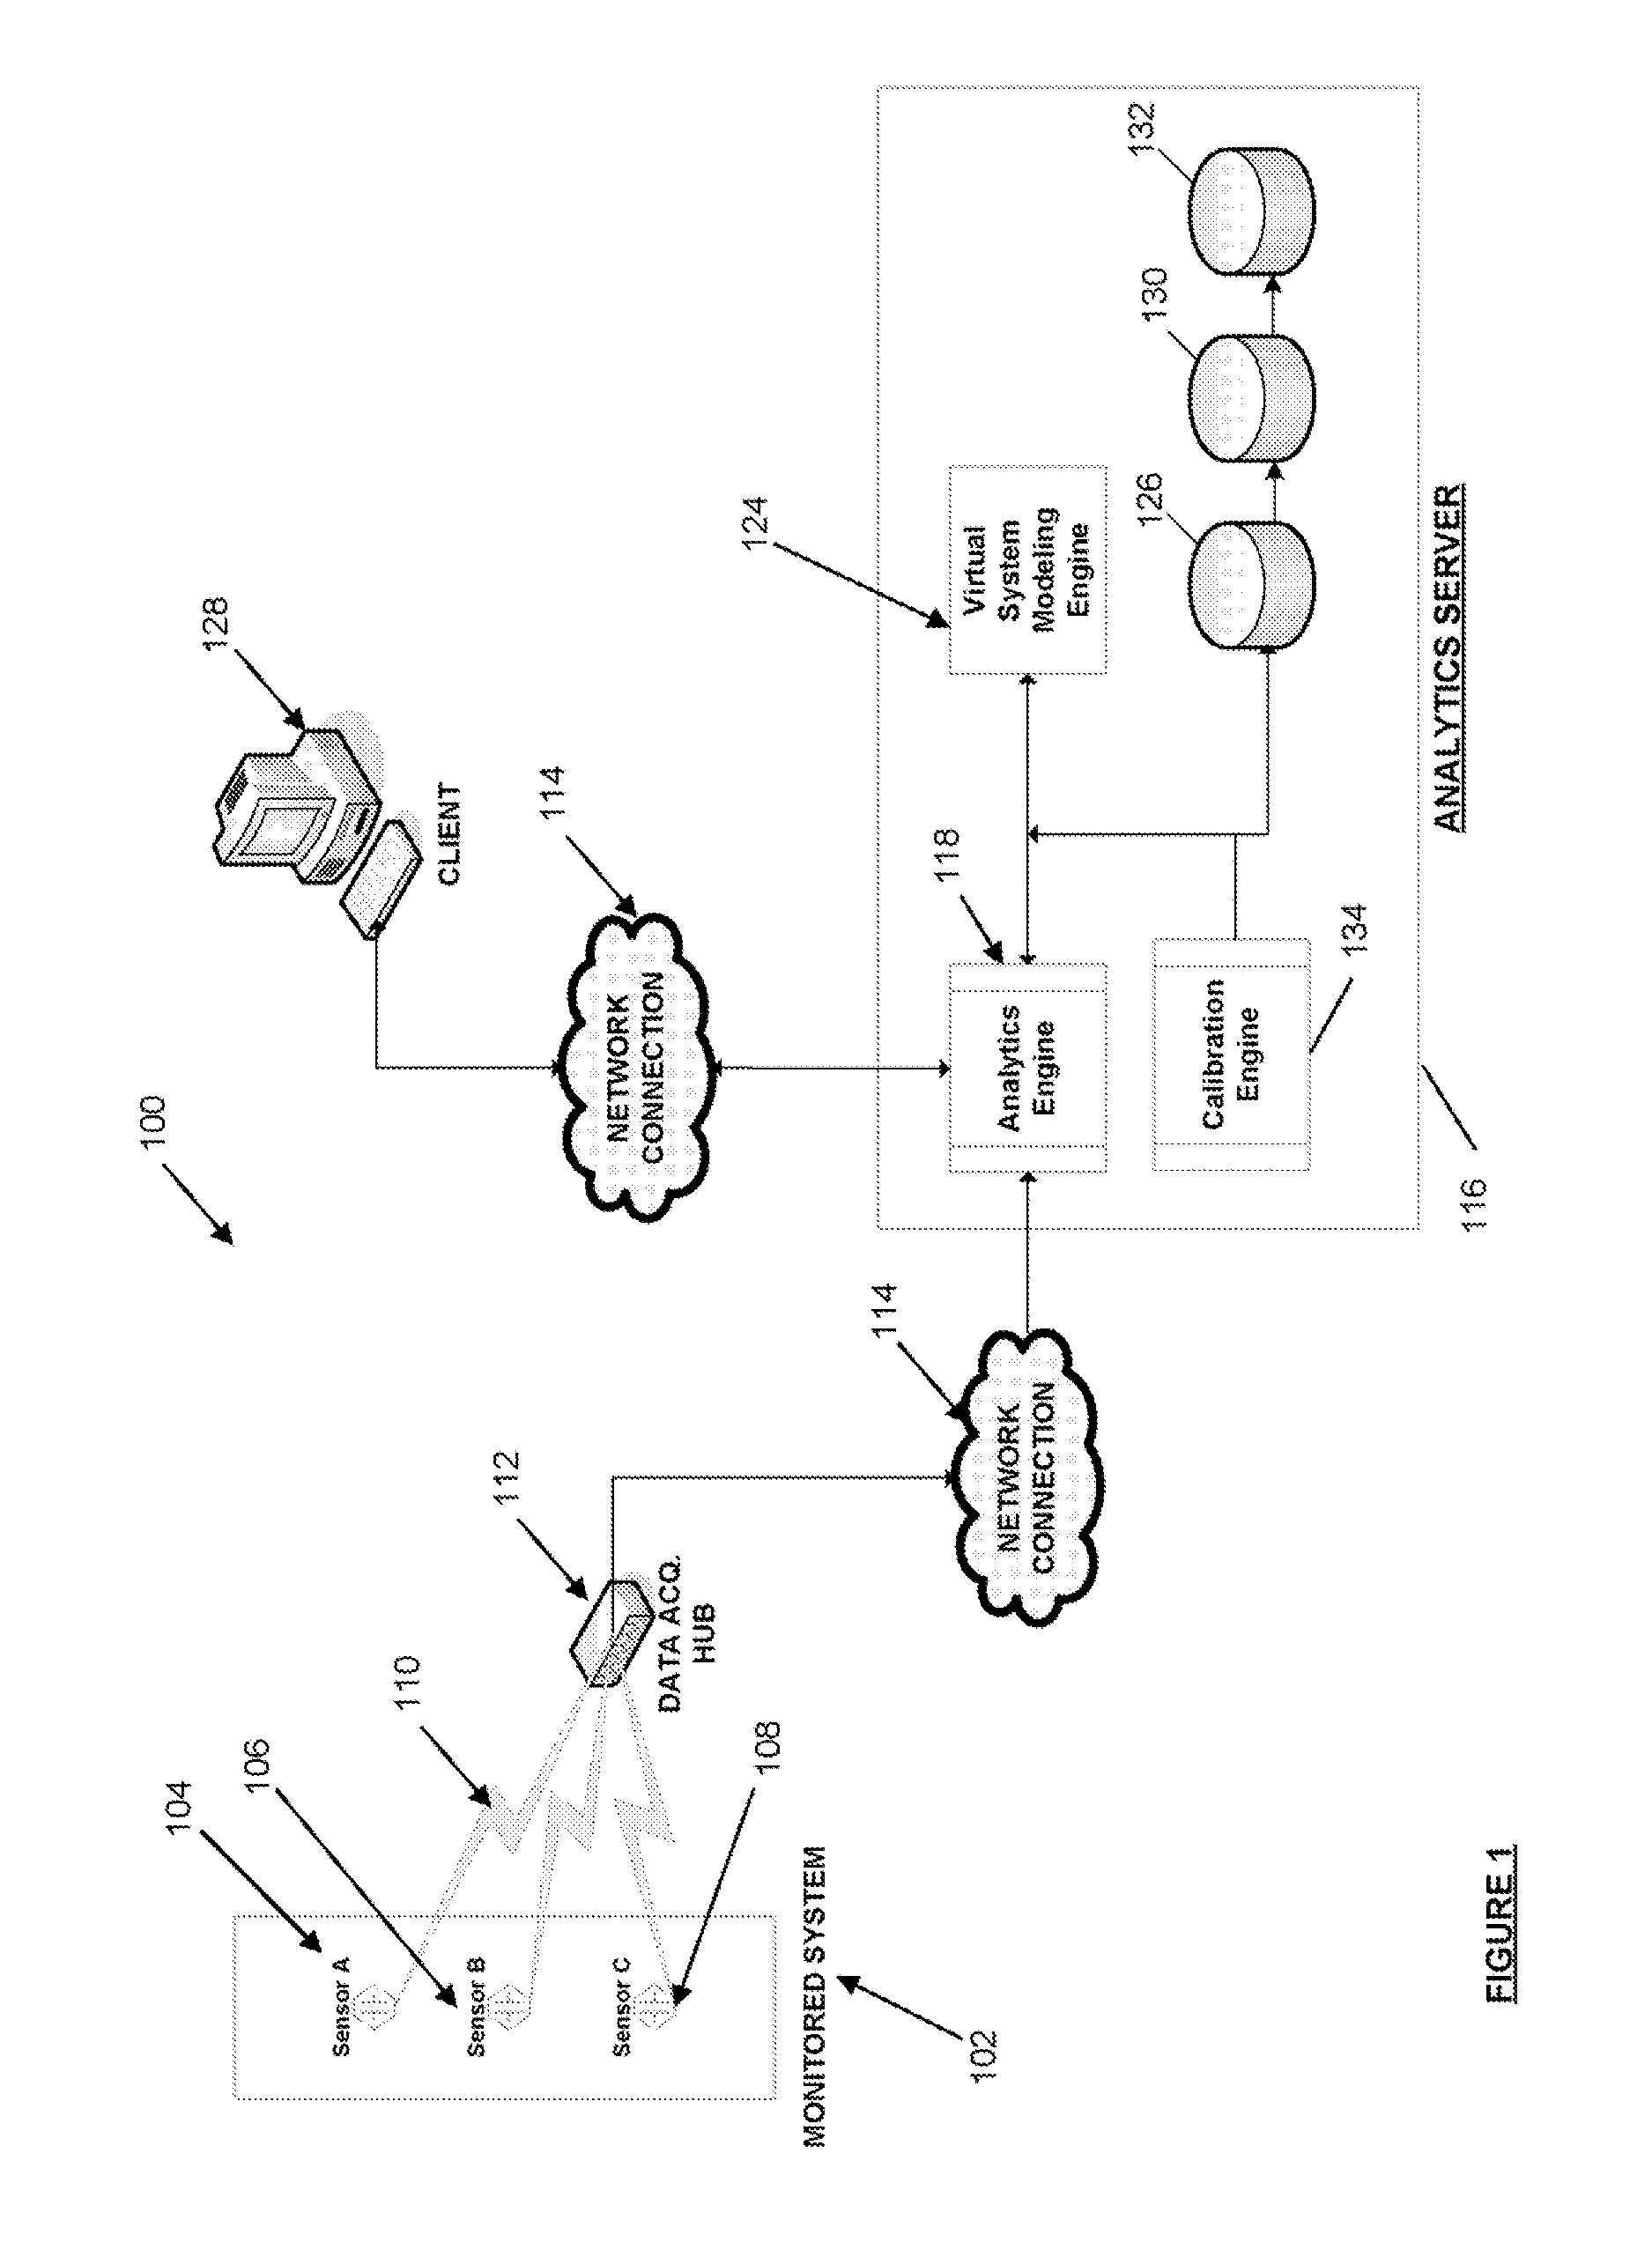
[0022]FIG. 1 is an illustration of a system for utilizing real-time data for predictive analysis of the performance of a monitored system, in accordance with one embodiment.

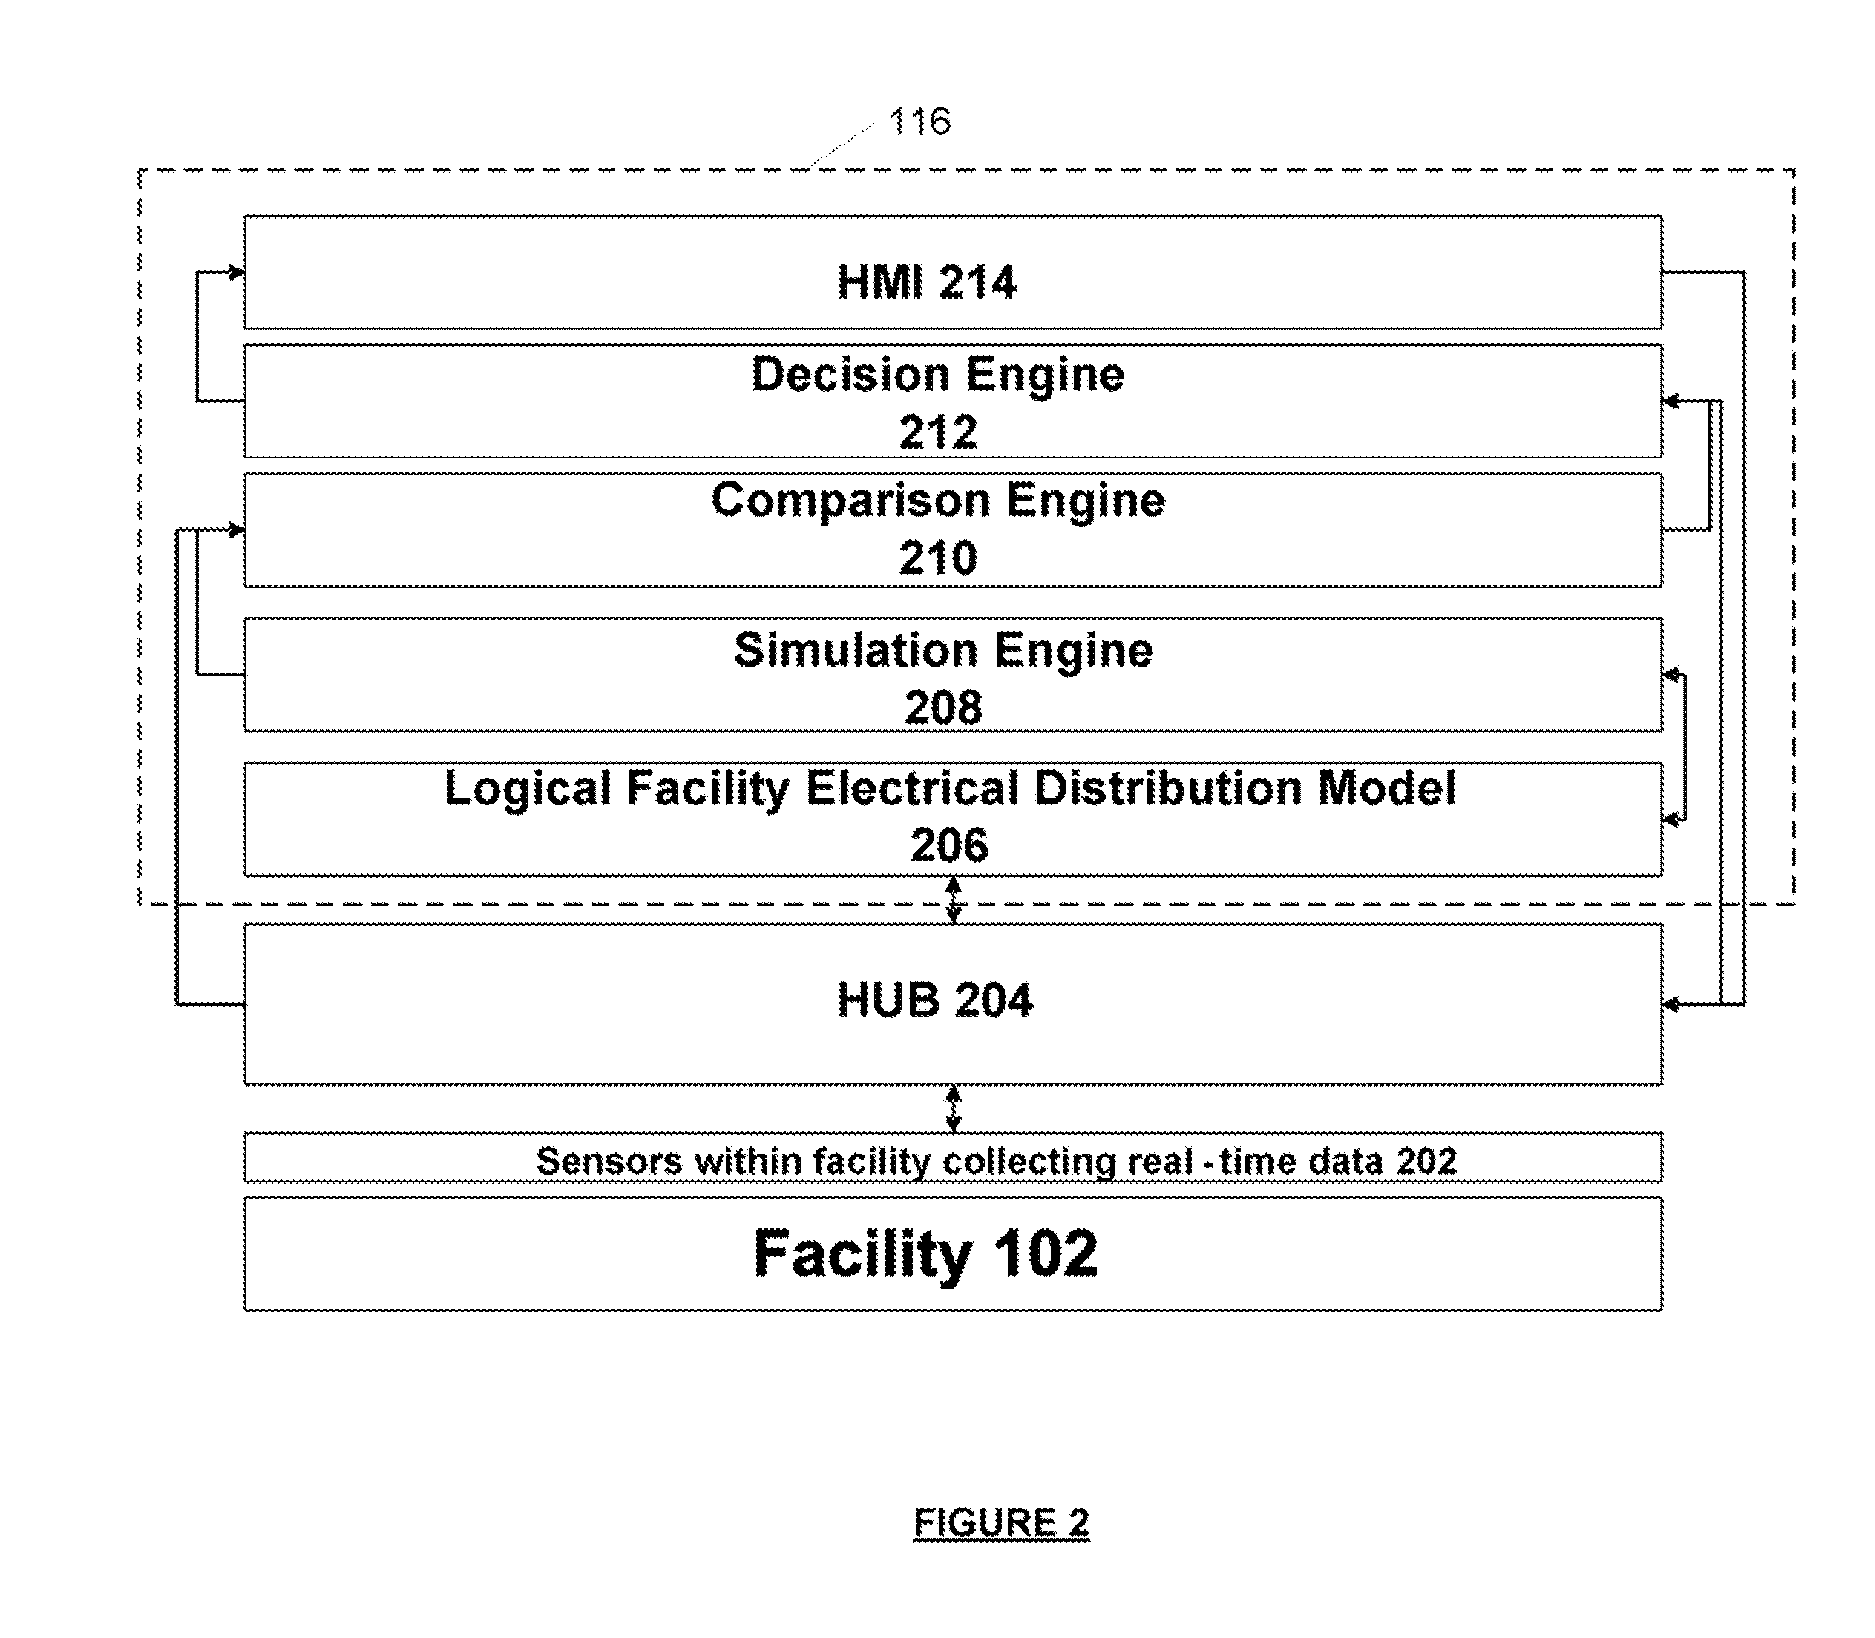
[0023]FIG. 2 is a diagram illustrating a detailed view of an analytics server included in the system of FIG. 1.

[0024]FIG. 3 is a diagram illustrating how the system of FIG. 1 operates to synchronize the operating parameters between a physical facility and a virtual system model of the facility.

[0025]FIG. 4 is an illustration of the scalability of a system for utilizing real-time data for predictive analysis of the performance of a monitored system, in accordance with one embodiment.

[0026]FIG. 5 is a block diagram that shows the configuration details of the system i...


PUM


Abstract

Systems and methods for performing power analytics on a microgrid. In an embodiment, predicted data is generated for the microgrid utilizing a virtual system model of the microgrid, which comprises a virtual representation of a topology of the microgrid. Real-time data is received via a portal from at least one external data source. If the difference between the real-time data and the predicted data exceeds a threshold, a calibration and synchronization operation is initiated to update the virtual system model in real-time. Power analytics may be performed on the virtual system model to generate analytical data, which can be returned via the portal.

Description

CROSS-REFERENCES TO RELATED APPLICATIONS[0001]This application is related to and claims priority from the following U.S. patent applications. This application is a Continuation-In-Part of U.S. patent application Ser. No. 14 / 597,499 filed Jan. 15, 2015, which is a continuation of U.S. patent application Ser. No. 13 / 358,376 filed Jan. 25, 2012, and claims priority to U.S. Provisional Patent App. No. 61 / 436,073, filed on Jan. 25, 2011. This application is also a Continuation-In-Part of U.S. patent application Ser. No. 15 / 068,105 filed Mar. 11, 2016, which is a continuation of U.S. application Ser. No. 14 / 810,451 filed Jul. 27, 2015, which is a continuation of U.S. application Ser. No. 12 / 237,948 filed Sep. 25, 2008, which claims priority under 35 U.S.C. §119(e) of U.S. Provisional Application No. 60 / 975,063 filed Sep. 25, 2007. U.S. patent application Ser. No. 12 / 237,948 is also a Continuation-In-Part of U.S. patent application Ser. No. 12 / 236,030 filed Sep. 23, 2008, which claims prio...

Claims


Application Information

Patent Timeline
Patent Type & Authority Applications(United States)
IPC IPC(8): G06F17/50H02J13/00
CPCG06F17/5009H02J13/0003G06F2217/78G05F1/66H02J13/0006H04L67/10Y04S10/40H02J3/00G06F2119/06G06F30/367H02J13/00001H02J2203/20H02J13/00017Y02E60/00Y04S40/20Y04S40/124G06F30/20G06F30/00H02J13/00002H02J13/00
Inventor MEAGHER, KEVINRADIBRATOVIC, BRIANNASLE, ADIB
Owner POWER ANALYTICS CORP
Learn More